Abstract
Jean‐Louis Le MouëlFernand LopesVincent Courtillot
We first apply singular spectrum analysis (SSA) to the international sunspot number (ISSN; 1849‐2015) and the count of polar faculae (PF; 1906‐2006). The SSA method finds 22, 11 and 5.5‐year components as the first eigenvectors of these solar activity proxies. We next apply SSA to the ten Madden‐Julian oscillation (MJO; 1978‐2016) indices.
The first, most intense component SSA finds in all MJO indices has either a period of 5.5 or 11 years. The longer‐term modulation of amplitude is on the order of one third of the total variation. The 5.5‐year SSA component 1 of most MJO indices moreover follows the decreasing amplitude of solar cycles. We then apply SSA to climate indices PDO, ENSO, WPO, AAO, AMO, TSA, WHWP, and Brazil and Sahel rainfalls. We find that the first SSA eigenvectors are all combinations of rather pure 11, 5.5 and 3.6‐year pseudo‐cycles.
The 5.5‐year component is frequently observed and is particularly important and sharp in the series in which it appears. All these periods have long been attributed to solar activity, and this by itself argues for the existence of a strong link between solar activity and climate. The mechanisms of coupling must be complex and probably non‐linear but they remain to be fully understood (UV radiation, solar wind and galactic cosmic rays being the most promising candidates).
We propose as a first step a Kuramoto model of non‐linear coupling that generates phase variations compatible with the observed ones.
The paper is, unfortunately, paywalled.
https://agupubs.onlinelibrary.wiley.com/doi/pdf/10.1029/2018JD028939
Ok, I think I get it but would will wait to see what others say.
Mac
It is ALL based on the NCEP/NCAR reanalysis “data”, which is not data at all but is the output of a climate model that is constantly “nudged” back to the right path by inputting actual observations. And if it is such a dang good model … why does it need to be constantly nudged back to reality?
An additional problem is that in many places there are very few observations. In this case the computer model outputs laughingly called “reanalysis data” are for 200 and 500 hPa levels, which are five and twelve kilometres up in the atmosphere. I’m not buying that we have much data for mid-Pacific winds 5 km up in the sky …
And what’s up with the use of “five day means”? Why not use daily model output?
Sorry, not impressed in the slightest. Come back when there are real observations to base things on rather than crappy climate models. All that they have shown is that MODEL solar energy from a MODEL sun affects MODELED winds … BZZZT! Next contestant, please!
w.
How TF is a paper by 3 different authors related to this paper by 2 French sounding names.
Color me un-impressed with Willis’s comment.
J
J
Yes. Apparently Willis didn’t read the whole article because he is asking for real observations and the authors clearly state:
That’s real data.
I am so biased that without reading the article and without reading the whole abstract I can dismiss the work of these people just by pulling a pdf about the Madden-Julian oscillation index and saying I don’t like it.
And then he collects a round of applause. Grandiose.
” … We then apply SSA to climate indices PDO, ENSO, WPO, AAO, AMO, TSA, WHWP, and Brazil and Sahel rainfalls. … ”
—
Javier, did you stop and ask, “Are these actually CLIMATE INDICES?” or just weather cycles and weather data?”
It’s not the W was too dismissive, it’s that you’re much too willing to accept what’s plainly not so.
I did. Climate indices are made from real weather data, like sea-surface temperature data or atmospheric pressure data.
Javier: “Climate indices are made from real weather data, like sea-surface temperature data or atmospheric pressure data.”
—
RUBBISH!
“real weather data” is the Johnny-come-lately of the instrumental era of WX observation. And as we see every week now it’s ANYTHING but reliable, nor a constant with time (see BOM pseudo-data for instance, now claiming to be ‘Climate Signal!’ … what a circus!).
99.999% of what we ‘know’ about Earth’s climate did not come from observational weather instruments. OK?
Would you just admit that to yourself, for one time?
You’re so committed to playing with short-term climate NOISE that you’ve lost all sight of the fact its just the detritus of multiple over-printing weather cycles, at all scales and lengths.
Unambiguous climate change is the steady cooling phase of the past 15 million years due to geological working of the crust.
Climate change is the glacial to inter-glacial and back to glacial again transitions due to orbital variations.
Climate change is the humps and bumps in the Holocene’s climate trends including the LIA dip.
These did not come from modern weather instruments, or satellites, or computers, they came form, rock core, seds, ice, biological specimens, etc., they were all indirect, and prone to many error sources, and accrued over thousands of years to leave their mark. You don’t get this from a Met Bureau, a satellite archive, or a UN document.
Humanity doesn’t have CLIMATE data in resolutions shorter than a couple of hundred years. You need that sort of time-slice to see any unambiguous changes in trends, if any are even present or clearly discernible.
But because of the interminable slowness of actual climate change being much to slow for humans to study in one or even several life times, like a lot of other derailed people you’re just pretending that weather cycle noise is a ‘climate change’ signal, and doing inappropriate things with it anyway.
Meanwhile you’re so self-confused you don’t even know the difference between weather cycle noise and an actual climate-change signal.
That’s the opposite of credible, the opposite of observational based science – it’s complete RUBBISH!
Nothings pretending to be ‘somethings’.
What an outburst. OK, you have your views about climate indices. I gather you know they are not amply shared.
WX,
ENSO shows up in paleoclimatic proxy data, at least for the past millenium. It’s not just observed in modern instruments, as per this paper from last year:
file:///C:/Users/User/Downloads/atmosphere-09-00130.pdf
A Review of Paleo El Niño-Southern Oscillation
From 2006, on interactions between the PDO and ENSO for the past 400 years, from paleoclimate records:
https://agupubs.onlinelibrary.wiley.com/doi/full/10.1029/2005GL025052
Paleoclimatic records for the AMO:
https://www.esrl.noaa.gov/psd/people/michael.alexander/Kilbourne.etal.AMO-Paleo.preprint.pdf
Here’s a functional link to the first mentioned paper:
https://www.mdpi.com/2073-4433/9/4/130/htm
JT: “,,, ENSO shows up in paleoclimatic proxy data, at least for the past millenium. … PDO and ENSO for the past 400 years, from paleoclimate records: …”
—
i.e. almost but not quite nothing, confirming what I said: “… 99.999% of what we ‘know’ about Earth’s climate did not come from observational weather instruments. …”
Javier: ” … you have your views about climate indices. I gather you know they are not amply shared. …”
—
Your opinion about it is irrelevant, climate data does not come from weather instruments.
Willis does seem unnecessarily dismissive in view of the number of datasets which were apparently studied.
However, I’m wondering what “rather pure 11, 5.5 and 3.6‐year pseudo‐cycles” look like.
Shame we don’t get to see the paper.
Ah , the old phase variation trick. With a “variable phase” you can make anything match. When it goes down instead of up, you just explain it with a 180deg phase shift.
With a variable phase you can make a solar proxy match a 9y lunar effect, or match it nearby volcanic dips. IMO if you are invoking a ‘variable phase’ you probably have nothing except your preconceived expectations left.
So they find a mathematical model that moves the phase of a periodic signal enough to give them the value they need to validate another model they made. Is that a correct assumption?
Javier February 23, 2019 at 6:46 pm
Javier, you put the following forth in italics so you could pretend that I said it:
Just because YOU can’t figure out what I did, and you are too much of a fool to ASK what I did, does NOT mean you can put up fake quotes and pretend that they’re from me. Stick with the science, there’s a good fellow, and leave the fake quotes to the mainstream media … at least they’re good at it.
w.
No, it is not a fake quote but an example of how bias works, starting from a pre-determined conclusion and working back to reject the work.
If you read the work, or at least the abstract, why did you ignore the use of PDO, ENSO, WPO, AAO, AMO, TSA, WHWP, and Brazil and Sahel rainfalls, and focused only on the MJO? Looking for the weakest link?
Javier, nobody but YOU ever said the words in italics. So yes, it is a fake quote, or more accurately, it is an example, not of how bias works, but of how the brain of Javier works. Your words, your ideas, your bias, your brain. At least have the blanquillos to own your own words and don’t put them in italics as though they were someone else’s.
As to why I picked the MJO, it was the very first one they mentioned. Read the first paragraph of the head post. Your paranoia is overcoming your common sense. Mentioned first, picked first. No mystery.
w.
Representing a role doesn’t mean owning the words. Watch the Oscar ceremony to learn more about that.
He did not put it in quotes. He clearly intended it to be a parody of what you did. Can you not tell the difference?
FWIW, I don’t know who’s right here, and have no dog in this fight. But he did not put quotes around what he said. You did that. Italics do not necessarily imply quotes. They may do nothing but set something apart for emphasis. He was parodying you. Whether it was justified or not, I don’t know.
You are also inventing things, Basil.
“Javier, you put the following forth in italics so you could pretend that I said it:” in one of Willis’s comments.
“Javier, nobody but YOU ever said the words in italics”,in another response of Willis’s.
Javier used a strawman response.
I have not read the study so I cannot make a comment on it one way or the other. However, concerning observational data and reanalysis, I have extensively used 200-hPa and 500-hPa data as a forecaster for over 35 years, and I have also used reanalysis data. I have found the patterns using the reanalysis data to be very close to that using observational data. The reanalysis is generally a bit more smoothed and probably does not catch the smaller perturbations. But the general pattern is very good. And over five days I would suggest there is little difference in the means of the observational and reanalysis data. This is only from my long experience and I have no concrete studies to back up my assertions.
@max
“I have found the patterns using the reanalysis data to be very close to that using observational data.”
I think that is the crux of the issue. These two statements are similar, but not equivalent:
“The forecast temperature for 22 February is XY degrees.”
“The observed temperature for 22 February was XY degrees.”
” … the output of a climate model that is constantly “nudged” back to the right path by inputting actual observations. And if it is such a dang good model … why does it need to be constantly nudged back to reality? …”
—
More to the point W, why is anyone using weather-cycle observations to ‘nudge’ a CLIMATE model back on to the ‘troo-path’ bounded by mere NOISE as ‘signal’?
/emoticon=insufficientcontempt
anyways …
For those wondering, I read the paper. It uses “10 MJO Indices”. So I went and found the ten MJO indices in question, and the paper I quoted is the paper that is referred to by the folks who made the indices. So YES, the paper absolutely IS built on NCEP/NCAR Reanalysis models. Nice try, though.
Next time, y’all might profitably ASK what I’m talking about before jumping to foolish conclusions and proving that you are more motivated by dislike of me than by a spirit of scientific inquiry … or you could just continue exposing yourselves as ignorant jerkwagons who want to do me wrong more than you want to be right …
Your choice,
w.
I don’t like or dislike you Willis. That is not the issue for me.
Your original comment here appears to me as an Appeal to Incredulity, which is not a logical rebuttal.
https://yourlogicalfallacyis.com/personal-incredulity
That is the same kind of incredulity that blocked
That’s why I was unimpressed with your cryptic comment, and your dismiss-out-of-hand attitude because of the authors use of reanalysis-derived indices. That approach probably has its limitations, but it also offers ways of getting insights to weather processes that do not have raw observational data, especially going back decades.
In systems control theory, observability of an internal state of a system frequently cannot be directly measured and has to be estimated based on its outputs. Modern control theory and systems like Kalman Filters use this estimation quite well, and industrial processes estimate internal parameters frequently from calculable systems.
https://en.wikipedia.org/wiki/Data_validation_and_reconciliation#Example_of_calculable_and_non-calculable_systems
Similarly, reanalysis using historical temperature and rainfall measurements to estimate past (historical) weather indices is broadly consistent with this idea of estimating internal state parameters of a complex system. I am certainly no expert in any way on NOAA’s reanalysis methodology, but apparently there are enough expert reviewers who do understand the approach and these papers passed a peer review.
The Earth’s climate is certainly a complex system with emergent behaviors. Simplistic approaches to understand it, such as the CO2 Control Knob characterization, will always fail. Here I see the authors at least trying to incorporate the cyclical pacings of the dominant energy source in the system to understand complex, emergent phenomenon (indices). Time and (or) (non)replication by will tell if the are right, not dismissals out of hand.
“That is the same kind of incredulity that blocked ”
(What I meant to write here that I forgot to go back and fill in)
… that blocked acceptance by the mdiecal community of Dr Barry Marshall’s realization that ulcers almost universally had a bacterial infection etiology. The medical elite thought they knew what caused ulcers and stomach cancer. But they were wrong—and didn’t want to hear otherwise. Dr Marshall was an internist, not a gastroenterologist. But it was the gastroenterologists who were acting as gate-keepers on the field of the etiology of stomach ulcers.
http://discovermagazine.com/2010/mar/07-dr-drank-broth-gave-ulcer-solved-medical-mystery
That sort of gate-keeping is fundamentally the biggest problem today in continuance of the climate science junk GCM predictions that predominates the field.
I knew it was too good to be true, because (for one thing) Willis has looked quite thoroughly for a correlation in the data in the past.
The trouble is that even if it isn’t true, if you could prove that it is true, it would make your career. So people look really hard for the slightest sign of correlation. Even in made up data, like computer models which is what has happened here.
Not correct. He had tried very hard to dismiss any correlation in the data in the past.
Javier February 24, 2019 at 1:24 am
Not correct at all. Actually, Javier, I started out as a true believer in sunspots affecting climate. I figured it would be a piece of cake to find good evidence. I was totally surprised to find, time after time, that the claimed correlations simply did not hold up to scrutiny.
I’d still be more than happy to find a statistically significant correlation in the data. But all I find is something on the order of “Well, if you look at just these three months of the year, but not every year, only when some unrelated index is between five and fifteen, and not at ground level, but only at 30hPa, then you’ll see there’s a clear correlation with sunspots …”.
Heck, I even had people ragging on me because they thought it was important that they found a correlation between tree rings and sunspots … and they continued to do so even after I’d pointed out that it was based on ONE TREE. Didn’t matter, to them it was a correlation and I was an idiot to not appreciate their genius.
The folks claiming these kinds of correlations seem totally innocent of, inter alia, the Bonferroni Correction and the effects of autocorrelation on statistical significance.
How about you, Javier? Perhaps you could give us an analysis of the effect of the Bonferroni Correction on the original Labitzke paper? I mean, since Labitzke totally ignored the Bonferroni Correction, you could rectify that, better late than never …
Regards,
w.
Hey, I went the opposite way, starting as a true disbeliever in a solar variability effect on climate and being convinced little by little by the evidence.
I used to think the coincidence of low solar activity and cold during the LIA was meaningless as N=1. Then I studied paleoclimatology and found that nearly all instances of low solar activity where accompanied by a consistent climatic deviation.
Then I saw the evidence, now I’m a believer
Not a trace of doubt in my mind
(put some music into that)
” …but only at 30hPa, then you’ll see there’s a clear correlation with sunspots …”.”
Not really surprising to find some solar cycle correlation in the upper atmosphere (i.e. above the troposphere.
The correlation of sunspot activity with radio propagation in the Earth’s upper atmosphere (ionosphere) is well known and easily observed over the 11 year cycle. The temperature of the thermosphere also faithfully modulated by solar activity. Both effects due to enhanced EUV at solar max etc. But neither has any big, observable impact on our climate.
And, so far, no one has found any compelling demonstration of 11-year solar cycle activity in tropospheric climate and weather data, except for a very tiny (0.1%) modulation on TSI, which very likely modulates earthly temperatures. But the forcing is so tiny that the resulting thermometer changes appear to be unobservable in the presence of a much larger “noise” of natural variation.
It seems that very high expectations of “impending” climate temperature changes (up or down) tend to be “wishful thinking”, correlated to some external agenda (Climatism, etc).
Johanus,
EUV flux has indeed been observed to affect WX and climate:
https://climate.nasa.gov/news/849/solar-variability-and-terrestrial-climate/
@John Tillman
Perhaps I missed it, but after reading your link I did not see any mention of compelling evidence for an 11-year solar cycle in tropospheric climate/weather data. Mostly a discussion of this or that ‘could’ or ‘can’ have some effect etc. In fact, Greg Kopp echoed pretty much what I said above (the strong effects are in the upper atmosphere). Emphasis mine:
To cite but one instance:
“Isaac Held of NOAA took this one step further. He described how loss of ozone in the stratosphere could alter the dynamics of the atmosphere below it. “The cooling of the polar stratosphere associated with loss of ozone increases the horizontal temperature gradient near the tropopause,” he explains. “This alters the flux of angular momentum by mid-latitude eddies. [Angular momentum is important because] the angular momentum budget of the troposphere controls the surface westerlies.” In other words, solar activity felt in the upper atmosphere can, through a complicated series of influences, push surface storm tracks off course.”
As other links show, for over a century, the solar cycle has been found to affect rainfall, which of course occurs in the lower troposphere.
Ok, as I pointed out before, he’s saying this “could” have an effect.
This is not “compelling evidence” that solar activity has any effect on climate/weather. Evidence would be something like a showing a periodogram of some weather sensor showing an 11-year cycle, or equivalent observations.
Having a theory is not “evidence”.
If you want to believe that the recent polar vortex is somehow evidence of solar activity, how do you explain that solar activity is currently nil. Also it is well known (since 1939) that these Arctic intrusions are caused by Rossby waves generated by Coriolis instability and conservation of vorticity (“angular momentum”). No solar intervention is necessary for their existence.
@John Tillman
“…the solar cycle has been found to affect rainfall…”
But no hard evidence is cited, very likely because there is no evidence. Bradley is merely presenting his belief here. Otherwise why would he say “seems to be”can and “if there is a solar effect”?
In science skeptics do not accept mere belief as evidence of fact.
Well, that’s science. Whereas you…
If his is science, then he should try to get it published. I fail to see how science progresses by posting tirades in WUWT.
The solar cycle affects numerous WX and climatic phenomena.
Its effect on Asian monsoons, for instance, has been observed for at least a century. China plans to increase rainfall over its territory based upon regular, sun-driven monsoonal variations, by expanding its cloud-seeding program by silver iodide rocket to Tibet.
One of the numerous papers showing the correlation and causation:
https://www.researchgate.net/publication/248293739_Influence_of_the_solar_activity_on_the_Indian_Monsoon_rainfall
Will you muse : “if it is such a dang good model … why does it need to be constantly nudged back to reality”/.
You [i]do[/i] know of all the reasons NCEP/NCAR analytical modelling is actually being done and its many valid applications? And if you do, why would you judge its quality on the very known to be more or less its main [i]feature and purpose[/i]? That is providing a constantly updates model of the Earth’s atmosphere because it’s simply very handy to have one, with faults and warts included. Best effort.
Consider yourself nudged back to reality then. Bzzt!
Not that it’s a voting matter, but I gotta go with Willis. He has demonstrated lots of times why no one has established a reliable connection between the sun and climate change over the past couple hundred years, and he shows his math.
Note that I didn’t say he has disproved a connection. It still may be out there, but no one has effectively demonstrated it yet.
Plus 100+
Someone needs to test their SSA methods against a random rime series to see what spectral components their method generates.
How about this one?
One of my favorites. Lots of good weather stuff therein.
The history and writing of “The Rime” is also fascinating.
Willis hit it so square and hard, I realize this is a “mental self gratification” piece, paid for by the taxpayers, I imagine. DANG, why can’t I be corrupt and learn to do this game?
I don’t understand SSA at any deep level. However … People have been looking for a correlation between climate and sunspots since Herschel and the results have been disappointing. Just because you use a different analysis technique, that doesn’t mean a correlation should suddenly appear. I remain skeptical.
Whenever there is confrontation from two opposite views. Those supporting one will reject the arguments of the other no matter how good. Karin Labitzke cracked that nut. She was the first one to find a correlation between not one but two atmospheric parameters and solar activity. After almost 40 years her findings are still solid, and thanks to her we know that the strength of the polar vortex depends on solar activity modulated by the quasi-biennial oscillation.
Of course you will find her results disappointing.
Javier, please provide a couple of links, one to the Labitzke paper and one to the data she actually used, so we can all see if what she did is “solid”.
Thanks,
w.
We are scientifically grown-ups, Willis. If you are interested in Labitzke’s work I am sure you can find that on your own, and if you are not, I don’t know what good would that do.
Javier February 24, 2019 at 4:16 am
Javier, it was YOU who said you were interested in Labitzke’s work and pointed us all to it.
In any case, I knew you’d wimp out, so I did go find it myself. I also invited you to explain to us what effect Bonferroni’s Correction, which she neglected would have on her work … so far, you’ve given us nothing at all.
w.
Willis,
I have already reproduced and updated Labitzke’s finding. It is essentially correct although more data has shown that the biggest effect takes place during periods of low solar activity.
I doubt I will be publishing that on WUWT. As I said I don’t think it is worth the effort, so I will look for a more scientific venue.
Sincerely I couldn’t care less about your opinion. The Bonferroni correction only applies when separate tests are performed and a positive in one of them is considered to validate the hypothesis. Labitzke segregated the data. The relationship between 30 hPa tropical winter wind speed and 30 hPa North Pole winter temperature during low solar activity years and high solar activity years is completely different.
Anyone could see this figure and consider it evidence that solar activity has a profound effect on the winter polar vortex.

Since I know you, I know you won’t give a damn and rather die than accept that solar activity affects climate, so why bother.
Not really. I don’t have a horse in the race.
Obviously, there are effects. Radio propagation was the most important one when I was young and short wave was a big deal. We had something like a weather report for the ionosphere and we used it to predict the frequencies that we could use over a given path.
Trying to use sunspots to predict the gross behavior of the climate as a whole has been a big dud.
Actually not. Periods of several low activity solar cycles coincide quite well with periods without warming or with cooling. That includes the early 1800s, the early 1900s, and the early 2000s. I guess by now we should be able to predict that for the early 2100s.
Of course predicting is difficult when we don’t know how to predict solar activity.
In what way did the climate in the early 1800s, 1900s and 2000s differ from the late 1700s, 1800s and 1900s respectively. Also we can be pretty certain that the early 2000s despite the low solar activity were considerably warmer than the 1980s.
Solar activity affects the rate of warming obviously. Periods of lower than average solar activity differ from periods of higher than average solar activity in that the rate of warming is lower, and even negative.
The early 2000s show no warming, while the 1980s show high warming. That the early 2000s display higher temperature is the result of climate history, not of solar activity lack of effect on climate. The 2010s might end up being warmer than the 2020s due to persistently low solar activity.
That can’t be. Everybody knows that the sun has no influence on the climate.
The only source of energy on earth other than radioactive decay is insolation. Orbital mechanics only matter because of the effect on insolation. Albedo only matters because of the effective insolation. Even the greenhouse effect depends on insolation first warming the surface.
So I get your point. How could variability of solar output not affect the climate? Yet it does seem to be paradoxical that the expected cycles are not obvious and easy to detect. If solar output exhibits cycles, how could the climate not have cycles coupled to those solar cycles? I don’t understand it.
“The only source of energy on earth other than radioactive decay is insolation. ”
…
You forgot one.
…
https://en.wikipedia.org/wiki/List_of_tidal_power_stations
Yes, tidal forces do generate some heat. And tidal forces are not limited to the moon. There are many cycles associated with the various orbits involved. Maybe those effects help explain the difficulty in detecting anything beyond chaos.
It is not too difficult to understand. John Eddy explained it in 1976.
“If the prolonged maximum of the 12th and 13th centuries and the prolonged minima of the 16th and 17th century are extrema of a cycle of solar change, the cycle has a full period of roughly 1000 years. … These coincidences suggest a possible relationship between the overall envelope of the curve of solar activity and terrestrial climate in which the 11-year solar cycle may be effectively filtered out or simply unrelated to the problem.”
John A. Eddy. 1976. In “The Maunder Minimum.” Science, 192, 4245, pg. 1199.
The effect is cumulative from 11-yr cycle to 11-yr cycle. Too small to be detected in just one cycle. Only when you get two or more cycles with high activity or with low activity you start to see the cumulative effect towards warming or cooling.
Of course if you know what part of the climate system is being affected then you can detect the effect at every cycle. For example ENSO. An El Niño at the solar minimum is the product of solar activity.

Since I made that figure El Niño is already showing up. A successful prediction.
“… Since I made that figure El Niño is already showing up. A successful prediction.”
—
What? It looks positively doubtful at present.
http://www.bom.gov.au/archive/oceanography/ocean_anals/IDYOC007/IDYOC007.201902.gif
/psst … don’t mention 1956 …
WX I’m backing a strong El Nino this year because Ian Wilson is also forecasting it, with his lunar hypothesis. This will be followed by a strong La Nina in 2020 -21.
We should then have the empirical evidence to prove that CO2 doesn’t cause catastrophic global warming, but if temperatures remain flat we may have to concede that this beneficial gas causes a little warming.
Indexes of El Niño remain within the limits of 0.5 C anomaly.

They have been falling since January. ENSO will remain neutral. Pressure over Tahiti is growing again.
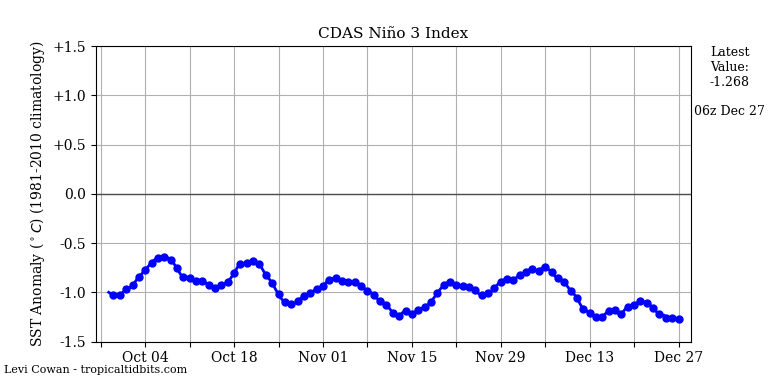
https://www.tropicaltidbits.com/analysis/ocean/
https://www.longpaddock.qld.gov.au/soi/
El Niño does not develop .
http://tropic.ssec.wisc.edu/real-time/mtpw2/product.php?color_type=tpw_nrl_colors&prod=epac×pan=24hrs&anim=html5
Current pressure in Tahiti.

The global temperature will gradually decrease.
Winter will be long in North America.

The ONI index has been:
ASO: 0.4
SON: 0.7
OND: 0.9
NDJ: 0.8
Two more three month periods above 0.5 and it is a Niño according to ONI.
“Warm (red) and cold (blue) periods based on a threshold of +/- 0.5°C for the Oceanic Niño Index (ONI) [3 month running mean of ERSST.v5 SST anomalies in the Niño 3.4 region (5°N-5°S, 120°-170°W)], based on centered 30-year base periods updated every 5 years.”
The sun doesn’t care how we define El Niño. The SST anomaly is clearly very positive.
The probabilities of that pattern being due to chance are tremendously small. If you demand perfection and don’t allow for other factors affecting, you are not talking science.
Is it really?

Look at the fall of the Nino 3 index from the beginning of February 2019.
Do you mean the product of the lack of solar activity? I would suggest that it shows a climate feedback acting to stabilise surface temperatures. El Niño is the transfer of stored solar energy from OHC to SST and hence atmospheric temperatures.
It seems to switch to La Niña or the rising phase of the new solar cycle as solar activity picks up.
Negative correlation is still correlation. Whether low solar activity causes El Niño at solar minima or allows it to happen, it would still be a causal relationship indicating control.
“The effect is cumulative from 11-yr cycle to 11-yr cycle. Too small to be detected in just one cycle. Only when you get two or more cycles with high activity or with low activity you start to see the cumulative effect towards warming or cooling.”
The regional atmospheric circulation effects of solar variability are week by week with a lagged inverse response from the oceanic phases of weeks to months. Proposed cumulative effects are an imaginary product of not accounting for the inverse oceanic responses to solar variability.
“Since I made that figure El Niño is already showing up. A successful prediction.”
Hardly, all the previous El Nino marked El Nino episodes were soon after sunspot minimum and not before it, so you have the wrong El Nino there.
Sorry I failed to proof read that, correction:
‘all the previous marked El Nino episodes’
Rich Davis
“Even the greenhouse effect depends on insolation first warming the surface.”
Very observant. Let’s look at what the IPCC says about that. They say the GHG’s work by trapping radiation emitted by the warm surface which is re-warmed by the back radiation. What is odd about that, is their claim that as the GHG tends to zero, the surface warming of the air tends to the temperature of the moon, which has no atmosphere (-18 C).
In essence they claim the “insolation warming the surface” which of course heats the atmosphere directly by contact (convective heat transfer) only works when there are GHGs, so sez the IPCC. Oddly, as the GHG concentration tends to zero, the surface heating in a real world approximately doubles, doubling the heat gained by the air. The IPCC says this doesn’t happen: absorbed insolation stops heating the air by contact if there are no intervening GHG’s.
Using logic like that, you can power an industrial civilisation using wind power. Isn’t climate science wonderful?
Crispin
My observation was just based on the common sense that GHGs can’t slow down radiative cooling until something warms the surface to initiate radiative cooling.
I’m not following you on what you say the IPCC claims about GHGs being necessary for convection.
The flow of heat from Earth’s interior to the surface is estimated at terawatts (TW) and comes from two main sources in roughly equal amounts:
The radiogenic heat produced by the radioactive decay of isotopes in the mantle and crust contributes only about half of the flow of heat from Earth’s interior to its surface. The other half is from the primordial heat left over from the planet’s formation.
“The only source of energy on earth other than radioactive decay is insolation.”
I would add that you also overlooked the following two not-insignificant sources of energy generation/input to Earth:
1) heat released from purely chemical reactions of earth’s land elements and minerals, aqueous-dissolved minerals and ions, and atmospheric gases; for example, exothermic oxidation of iron ore on land and exothermic formation of calcium carbonate in the oceans, and
2) heat released from exothermic chemical reactions employed by life (especially, bacteria) in earth’s biosphere.
sarcasm noted – I’d be VERY surprised if someone “discovered” there was no relationship between climate changes (or not!) and solar activity since virtually ALL the energy that comes to the earth is from the sun.
You people. You must understand that the only thing that is important is Carbon. The sun is just a little light in the sky of no importance in determining climate.
Yeah, I read that here a lot!
No impact at all…why the sun could wink out tomorrow and you’d never feel a difference.
Well Doll, we are talking about the very, very small CHANGES in solar output which have a very, very minor influence on Earth. This has been brought up here a lot but some people still don’t get it.
My most sincere apologies for being off thread but I don’t know where else to ask. Is this real?
“Navy files for patent on room-temperature superconductor”
https://phys.org/news/2019-02-navy-patent-room-temperature-superconductor.html
Thanks,
Craig Graham
Marathons, FL
Real – for certain values of “real.”
1) The website doesn’t publish fake news, but they don’t (and can’t) verify the accuracy of what they get from people that they receive information from. In this case, the Navy PIO and the Patent Office. So, what we have here is, at most, the release from the PIO (and we all know what PR people do to things), and maybe a verification that the Patent Office has the application out in public (for those who might want to challenge it as infringing or non-unique). Without going over the formal claims in the application, we can’t be sure that they are claiming a room temperature superconductor.
2) The patent has, apparently, not been granted yet. Other than the “newness” test, the PO doesn’t do all that much verification, beyond sufficient detail in the documentation to reproduce the invention. Particularly, they do NOT verify that the invention does what the claims represent, nor do they make any assessment as to whether it has any commercial viability. (I should have picked up a book I found in a used bookstore once – on just a skim, it had some truly hilarious examples of patents granted that were of absolutely no use to anyone in the real world.)
Summarizing, not a big excitement factor here. However, unlike fusion, room temperature superconductors have been getting closer and closer in reality – and there is no physical bar (known right now) to their eventual creation on a commercial scale. Something to watch, but with skepticism.
Related:
https://phys.org/news/2019-01-evidence-superconductivity-room-temperature.html#nRlv
Near room temp but not room pressure, . . .
below 260 K (minus 13 C, or 8 F) at 180-200 gigapascals of pressure,
. . . and I like my room a little warmer.
I suggest all forcings be quantified, then move into harmonics/perturbations and finally realize that the variables preclude a prediction not bounded by our limited experiences.
I got here when there were no comments, and was going to say I was just waiting to hear Willis’s comments on this before I commented. I was not disappointed…
Thanks Willis for you comment. I expect a few more,,,,,lol
I think Willis is right on, judging from his past articles and comments about the relationship between sunspots and climate/weather/global warming….these guys are just armatures compared to Willis’s analysis(s).
…amateurs…Damn, spell check didn’t help on this one at all.
OK, we’re here for Willi’s mechatronics and “armatures”:
https://goo.gl/images/pGQTKo
So solar cycles can be broken down into ‘thirds’.
The 1st is a ramp up blend of the prev. and current cycle, the 2nd is the central (including maximum) and is the only part that really matters where the 3rd is a blend of current and next? Is that what they’re saying?
Does that imply that a long weak minimum has no impact on climate?
But then again, I have read here many times that our sun has absolutely no impact on our climate at all…while I find that dubious, those that say it are very highly regarded here.
Barbee,
It’s clearly not the case that the sun has no impact on the climate and nobody I’m aware of would say that. There’s a big difference between saying that the sun has no impact on the climate and saying that variations in the climate are not primarily due to variation in the sun. The sun is the primary and virtually only source of energy for the climate system. Without the sun, the earth would be a dead, frozen rock. It’s just that the sun is also remarkably stable in its output.
Willis can speak for himself, but I think he is not attempting to present any hypothesis for the mechanisms that cause climate to change. In his many analyses on WUWT he just looks at the data to see if there are correlations between solar cycles and other climate metrics and has not been able to find any evidence of cycles driven by solar cycles.
Sunspot counts vary significantly during a solar cycle, but that should not be confused with total solar irradiance varying dramatically. It varies only about 0.1% over the course of a solar cycle. Svensmark’s theories about galactic cosmic rays affecting cloud cover and being modulated by solar wind variation are an attempt to show climate effects of solar cycles not related to TSI. Willis has not found any evidence to support that.
The UV part of the solar radiation spectrum varies by orders of magnitude more than TSI.
This high-energy EMR is qualitatively different from the visible and IR spectra, since it makes and breaks ozone, and that which reaches the surface penetrates deeply into seawater.
And the long term measures of millimeter wave frequencies need to mature.
OK, but do you have data to show a correlation between UV flux and any ocean cycle? Correlation is not causation, but causation requires correlation, no?
Like Willis, I would love to see this theory proven. It’s just that if there’s no data, I have to be intellectually honest about it.
UV flux affects not just the oceans, but the atmosphere, via ozone and other effects:
http://joannenova.com.au/2015/01/is-the-sun-driving-ozone-and-changing-the-climate/
Although the UV portion of the solar spectrum varies considerably over the course of a nominal 11-year solar cycle, it is not by “orders of magnitude.”
According to https://www.nasa.gov/mission_pages/sdo/science/Solar%20Irradiance.html :
— nominal average TSI is 1366 W/m^2, varying by a total of 0.1% (1.2 W/m^2) over a solar cycle (with most of the energy contained in the visible and IR bands)
— mid-UV (200-300 nm) solar irradiance is a nominal 15.4 W/m^2, varying by a total of 1% (0.17 W/m^2) over a solar cycle
— far-UV (126-200 nm) solar irradiance is a nominal 0.050 W/m^2, varying by a total of 30% (0.015 W/m^2) over a solar cycle, and
–extreme-UV (0-125 nm) solar irradiance is a nominal 0.010 W/m^2, varying by a total of 100% (0.010 W/m^2) over a solar cycle.
So, considering the three above-mentioned UV spectral bands combined, the total energy variation they have over a 11-year solar cycle is about 0.195 W/m^2, or just .014% of nominal TSI . . . and yes, that is 14 thousandths of one-percent.
Most of the solar irradiance energy variation over the course of solar cycle occurs in the visible and infrared part of the solar spectrum, despite 1 to 100% variations in the UV portions of that spectrum.
By the time it is “ramping up” there is very little of the last cycle left. There is not one solar peak but two, usually quite distinct. Some times they are nearly coincident and not resolved as two peaks.
Greg February 23, 2019 at 9:12 pm
Two peaks?? Not clear what you’re looking at. Here’s a typical cycle of the daily sunspot number … but where are the “two peaks”?
Regards,
w.
Well, it does show a bit of an indistinct “M” shape with the valley in 1990. That was a great cycle for us hams. Dx was wonderful: I remember being able to talk to several Japanese hams on ten meters after dinner every evening I got on all through that peak.
“Two peaks??”
The sunspot peak activity varies by solar hemisphere, and are usually not simultaneous:
http://wattsupwiththat.files.wordpress.com/2015/11/clip_image0104.jpg
Usually among the first to arrive to the comments of any article claiming a solar effect… to dismiss it.
Like the opinion of the WUWT readers mattered for the issue.
The understanding of the solar variability effect on climate has advanced tremendously in the past two decades. The number of papers published on the matter has been increasing greatly. It is a terribly complex issue, as a simple one would have been solved long ago. It is impossible for casual readers as most WUWT readers to get a nuanced view of the issue, and most have made up their mind one way or other based on partial superficial observations.
It is almost impossible to educate people on complex things that they have no interest. I have tried explaining in articles at WUWT how the paleoclimate record shows clear evidence of solar variability control on climate, and how for example the speed of rotation of the Earth is affected by solar activity, and how ENSO is controlled by solar activity. It is a wasted effort.
Science marches on, it is people who are left behind.
“The understanding of the solar variability effect on climate has advanced tremendously in the past two decades.”
—
Pity about that persnickety lack of any clear substantiation of your claims though.
The claims have been substantiated. That you prefer to ignore it is your choice.
If you do say so yourself. Hollow, like your other assertions. I’ve read your articles, you’ve got nothing, a bunch of imaginary noise patterns and a lot of time-wasting. More cloud-based white rabbit shapes.
It is not my articles that matter. It is the scientific bibliography they are based on. The articles by Indrani Roy, Joanna Haigh, Leslie Grey, Willie Soon, Kunihiko Kodera, Hedi Ma, Yuhji Kuroda, Karin Labitzke, Judith Lean, Sami Solanki, Natalie Krivova, Ilya Usoskin, among others.
Until you read their articles which present their findings on how the climate is affected by solar variation your assertion that the claims lack substance is based on ignorance.
We live a boom in solar-climate research. Some people here at WUWT are determined to ignore it. Those that refuse to learn are destined to ignorance.
You could just provide cohesive evidence instead of more hand-waving claims, noise analysis, imaginary cycles and blaming readers for your failure to perform. A bunch of papers does not mean anything, we see insubstantial papers all the time. Don’t let it go to your head, you only kid yourself that way.
As a mere WUWT reader, barely competent to Google the terms that you and Willis throw out as if they were common dinner table topics, I can say that I appreciate the efforts put into the pursuit of truth. The interplay is educational and the battles can be entertaining. Not that my praise is worth anything.
My observation is that you two both give and take offense too quickly. Not that my criticism is worth anything.
I assure you that I remain open to whatever theory data can support. Not that my opinion is worth anything.
ALL opinions count for something if they are given honestly. ALL people can learn something if they will spend a little time listening.
I agree, I do not understand the nature of people’s verbal bombs being lobed around on this site. I enjoy reading people’s analysis (or opinion) even if I do not agree with it.
Someone’s toe REALLY got stepped on, I am just not sure whose it was or what did the stepping.
>7) Figure 3 indicates a relationship that holds during the latter 20th>century, presumably somewhat specific to the mix of internal and forced
>variability that dominates over that period. This may not be
>representative of the situation in earlier centuries, where the primary
>pattern of forced variability is by volcanic and solar forcing which
>impart distinct regional and seasonal signatures in the temperature field
>(see Shindell et al, 2001;2003) that are likely to be quite different from
>those associated with anthropogenic forcing (GHG and aerosol) which
>dominate during the interval examined by the authors. Related to this,
>have the series been detrended before calculating the correlations shown
>in Figure 3? This has a bearing on the interpretation.
http://di2.nu/foia/foia2011/mail/0078.txt
Energy is a slippery thing. It is almost the modern aether. It slips between mass and the speed of light, with massless photons having energies according to the imponderable Planck, and the more sluggish and massive solar and galactic “winds” having energies of their masses times the speed of light squared.
There is a pittance of photons from the microwave background radiation.
While photons are electromagnetic radiation, the components of electricity and magnetism seem to behave differently when we are not looking. The satellite that ventured beyond the solar system has not seen the expected drop off in the sun’s magnetic field. The earth’s own fields likely force us to account for separate electrical and magnetic energies.
Regarding tides, we have Mr. Einsteins’s classical field equations that work, but we don’t really know what gravitational energy is.
Radioactive decay is not to be underestimated. With a bit of help from earth’s spin (gravity by equivalence), and tides (gravity), and electricity (?); this energy seems sufficient to move continents with roots far below the supposed “plastic” layer proposed to make this easier.
Our units we would use to evaluate all this are a mucking fess. Provincial by discipline and not intended for cross reference.
Just in case you were wondering why figuring this stuff out is hard…
Space contains [or rather is] all of the potential ‘mass’ and ‘energy’.
Particles and photons merely express it within space.
” mucking fess”?
Wash your mouth/keyboard out with soap, you pheasant plucker.
“pheasant plucker.”
Very good. To be added to my resume.
no relation to “climate change” in
“Study: A Solar Signature in Many Climate Indices”.
– Climate Indices –
what’s the fuss!
Willis, https://www.google.com/search?q=stop+hyperventilating&oq=stop+hyp&aqs=chrome.
Johann, if that’s supposed to be humor … don’t quit your day job …
w.
Willis, you didn’t understand.
It’s not about a “day time job”.
It’s about 8-12 hours shifts / 5-12 days.
3 shifts / monthly- with “workfree” shifts it’s 4 shifts year long.
_______________________________________________
And I’d be glad to get such “work” again.
_______________________________________________
You ever in your lifetime “worked, Willis?
Willis, unter 7 Mrd. Menschen gibt es
2 Johann Wundersamer.
Nach mir wird mein Familienzweig aussterben.
Ich möchte wenigstens mein Leben in Würde abwickeln.
Nach 48 Jahren eingezahlten Versicherungsjahren bin ich jetzt in “Korridorrente” und brauche mir nichts vorwerfen zu lassen.
Von dir schon gar nicht.
For those who wonder why I don’t believe everything I read, compare the following:
And here’s the periodogram of the Atlantic Multidecadal Oscillation (AMO), 1856 – 2018:
Several things of note. There is a 3.6-year cycle. However, there is no 5.5-year cycle, just a 5.3-year cycle, and it is far from “sharp” as they claim. Next, there’s NO 11-year cycle. The nearest thing is a 10-year cycle.
In addition, the largest cycle is at 9 years … and it is only 2.5% of the peak-peak swings. In other words, all of the cycles are lost in the noise.
So no, I don’t believe their claims about how everything lines up neatly with a 3.6, 5.5, and 11-year cycle. Not happening. I’ve looked at all of these indices, MEI, PDO, SOI, ENSO, NINO34. They do NOT line up all neatly as this paper claims. Tell you what. Here’s another one:
It has a 3.3-year cycle, a 5.75-year cycle, and no 11-year cycle.
You can see why I’m not buying their story about a whole bunch of very neat 3.6, 5.5, and 11-year cycles …
Which is why I say, and I can’t say this strongly enough or often enough—DO YOUR OWN ANALYSES!!! You can NOT trust scientific papers, whether or not they are peer-reviewed.
w.
Thanks for that reminder. I often say that you can find academic research to support whatever claims you want to make. And peer reviewed or not, it makes no difference. Especially in the field of nutrition, you discover more about the biases of the research than the real world.
“Biases of the researcher“. Sorry, stiff keyboard.
I wrote in 2018:
“The reason the lag of CO2 trends (changes) after temperature trends is approx. 9 months is explained here – 9 months is one-quarter of an approx 36 month natural cycle, it is basic calculus.”
And above is the plot of the PDO Periodogram with a sharp peak at 3.3 years.
My work is done here. 🙂
Best, Allan
Background information:
https://wattsupwiththat.com/2018/09/09/empirical-evidence-shows-temperature-increases-before-co2-increase-in-all-records/#comment-2452579
Sorry, Alan, but I don’t follow your logic.
A change in the phase relationship of temporal oscillations in one parameter versus the temporal oscillations in a second parameter does not cause a change in the FREQUENCY of either parameter.
And a phase change will not cause a change in the “beat frequency” of two constant-frequency oscillators—with different frequencies between the two—when combined.
So they find a mathematical model that moves the phase of a periodic signal enough to give them the value they need to validate another model they made. Is that a correct assumption?
“You can NOT trust scientific papers, whether or not they are peer-reviewed.”
That is a core issue, and your excellent point could be rephrased like: “You can NOT trust settled authorities on their opinions, whether or not they are part of a like minded group”. Science coupled with authority is an unholy alliance.
Here is a rather general presentation in which Vincent Courtillot discusses most of this article (not yet published at the time) :
https://www.climato-realistes.fr/intervention-courtillot-conference-19-octobre-2018/
Totally off topic but one of the other posts on that link appears to be about the frequency of “disasters” , up to 2018.
https://www.climato-realistes.fr/desastres-naturels-rapport-2018-aon/
It seems to confirm what people here say about there being no recent change in the frequency of disasters, contrary to the assertions of OAC and others. But some of the charts , eg that of accumulated cyclonic energy ,seem to show a cyclical trend – but probably any natural event must show some variation that could be misinterpreted by the intellectually challenged (like me) as cycles.
For background, Le Mouel and Courtillot are famous names with regard to seafloor spreading, propagating rifts in continental rifting, timing of extinction events in earth history, volcanism. Not saying that makes them right. Just saying these are people with a long history in geophysics.
Yes. They were the people that demonstrated that the semi-annual component of the length-of-day (Earth’s rotation speed) responds to solar activity.
Le Mouël, J. L., Blanter, E., Shnirman, M., & Courtillot, V. (2010). Solar forcing of the semi‐annual variation of length‐of‐day. Geophysical Research Letters, 37(15).
https://onlinelibrary.wiley.com/doi/pdf/10.1029/2010GL043185
In other words the Earth accelerates and decelerates twice a year according to solar activity. How is that for an effect from a 0.1% change in TSI?
Their research is largely ignored because it doesn’t fit climate preconceptions.
I read somewhere that the solar magnetical activity is influenced by planets orbits and especially by Jupiter (sort of magneto-gravitational coupling between planets and magnetical solar activity).
Jupiter cyclically passes above and under the ecliptic plan and this may gravitationaly interact with Earth length-of-day.
Perhaps the cause of the LOD variation is gravitational but correlated to solar activity through aforementionned magneto-gravitational coupling … Just an hypothesis.
Very nice paper – they link Solar activity, geophysics angular momentum, climate and GCR’s .
“Climate” is not a closed system, and they pose an open question.
That’s thinking outside of the statistics toolbox!
Major LOD variability is directly linked to the solar magnetic cycle
http://www.vukcevic.co.uk/H-Lspec.htm
Thank you Javier for this useful reference.
“A and WN are anticorrelated, WN leading A by 1‐yr.”
The authors state that WN (sunspot number) leads A (length-of-day) by one year. If the reverse were true, then Earth’s rotation length-of-day would lead sunspot number, and that would be a logical conundrum.
A major logical conundrum does exist in climate science, where temperature changes lead changes in atmospheric CO2 by approx. nine months, and yet trillions of dollars and millions of lives have been wasted on the mere assumption that the reverse is not only true, but that increasing CO2 will cause catastrophic warming. Really! I’m not making this up.
Details: The velocity atmospheric dCO2/dt changes almost contemporaneously with global temperature and therefore temperature changes lead changes in atmospheric CO2 by approx. nine months. Quality CO2 data is available since 1958, and I also proved in 2008 that this relationship holds true in times of global cooling (pre-1977), and in times of global warming (1977 to the early 1990’s), and thereafter during “The Pause”.
Here is the dCO2/dt vs Global Temperature relationship, which I first published in January 2008 on icecap.us.
http://www.woodfortrees.org/plot/esrl-co2/from:1979/mean:12/derivative/plot/uah5/from:1979/scale:0.22/offset:0.14
Here is Humlum’s 2013 plot of the lag of CO2 after Temperature, which is prettier than my 2008 version.
 ?dl=0
?dl=0
I hypothesized in 2018 that the approx. 9-month lead-lag relationship was primarily due to an approx. 36-month cycle in the tropical Pacific Ocean, and recent evidence supports this hypo.
A huge amount of effort and cost has been wasted on the hypothesis that increasing atmospheric CO2 will cause dangerous global warming. I suggest that the above evidence concludes, in layman’s terms, that climate is relatively INsensitive to increasing atmospheric CO2, and global warming will not be a problem.
Best, Allan
Allan,
From analysis on changes in the rate of warming, solar activity, volcanic activity, changes in the rate of increase in CO2, and the 65-yr oscillation I estimate anthropogenic CO2 increase has contributed to 20th century warming by 10-20%, and to warming since 1975 by ~30%. Important but not enough to become worried.
Else we’d have cooled, eh?
======================
Thank you Javier. Christy and McNider 2017 and Lewis and Curry 2018 have estimated the UPPER BOUND of climate sensitivity to increasing CO2 at about 1C to 1.5.C /doubling.
Are you saying that CO2 is responsible for 10-20% of 20th Century warming and ~30% of warming since 1975? If so, I think that would estimate climate sensitivity at about 0.15 to 0.30C/doubling, which is consistent with my estimates – that is, too low to matter.
Kim wrote:
“Else we’d have cooled, eh?”
Not sure Kim, but I think Earth should start cooling about now.
I wrote in an article published 1Sept2002 in the Calgary Herald:
“If [as we believe] solar activity is the main driver of surface temperature rather than CO2, we should begin the next cooling period by 2020 to 2030.”
My (our) now-imminent global cooling prediction predates Theodor Landscheidt’s 2003 paper. I’d be happy to be wrong about that cooling prediction, but it’s looking pretty good, based on the crash in solar activity in Solar Cycle 24 – the lowest since the Dalton Minimum (circa 1800).
NEW LITTLE ICE AGE INSTEAD OF GLOBAL WARMING?
Theodor Landscheidt, First Published May 1, 2003
https://doi.org/10.1260/095830503765184646
I will stand with this prediction – for moderate, natural cooling, similar to that which occurred from ~1940 to the Great Pacific Climate Shift of 1977, despite increasing atmospheric CO2. As stated previously, I hope to be wrong, because humanity and the environment suffer during cold periods.
Allan,
All cooling predictions will eventually fail except for short periods of no more than 30 years. All warming predictions will eventually fail too.
The main climatic cycle right now is a 1000 year cycle and we are near its peak in a warm period similar to the Medieval Warm Period of a 1000 years ago that lasted several centuries. CO2 is providing a little extra push. Climate should be stable with ups and downs for at least a couple of centuries.
People don’t want climate to be uninteresting for centuries. They want drama.
Thank you Javier.
I am assuming moderate cooling for perhaps 30 years, possibly more, similar to the cooling that occurred from ~1945 to 1977. After that, I have no opinion because I have not adequately studied the question. I think there is a natural irregular cycle of about 60-100 years, along with longer natural cycles, dominated by the Pacific Ocean. Prediction of this short cycle is low-certainty, but I have some confidence in the work of certain paleoclimatologists. When I made this cooling prediction in 2002, it was climate heresy. Now even NASA is predicting imminent cooling.
Hope to be wrong – I’m getting old and hate the cold. 🙂
My outlook is that the current cool trend will last into the mid 2030s before temps rise back up into the next 30+ year warm trend. The exception to that would be if a second cool trend follows which would lead to a deeper cold trend.
A large coronal hole on the solar equator in two days can cause a strong geomagnetic storm.
http://www.solen.info/solar/images/AR_CH_20190223_hres.png
Reanalyses and Observations: What’s the Difference?
Wendy S. Parker
https://journals.ametsoc.org/doi/10.1175/BAMS-D-14-00226.1
The key Hans is that every different data item in the reanalysis is coded ( A,B,C,D) depending
on its reliance on observations or physics modelling.
arbitrarily trashing them as willis SEEMS to do is just lazy
@Mosh
“… every different data item in the reanalysis is coded ( A,B,C,D) depending
on its reliance on observations or physics modelling.”
Which does not change the fact that “reanalysis” is essentially a “forecast”, using past data as data assimilation inputs. A forecast is not equivalent to an actual observation (even though the forecast may use actual observations).
Kalnay et al., “The NCEP/NCAR 40-Year Reanalysis Project”, https://journals.ametsoc.org/doi/pdf/10.1175/1520-0477%281996%29077%3C0437%3ATNYRP%3E2.0.CO%3B2 , [1996]
😐
well Duh!
First. All you have are point observations. Points in space time. to do any kind of spatio temporal analysis you have to create a continous field from the point observations.
There are two basic approaches to doing this.
A) Statistical interpolation.
B) Physics based interpolation.
each have their pluses and minus.
Pointing out that a physics based interpolation is just a forecast isnt really a cogent point.
But, given that you dont like re analysis go have a go at Judith Curry who considers them to be the gold standard. good luck with that.
Also, count the number of times sleptics point to DMI temperatures at the Pole without noting that its re analysis.
Bottom line: there are varying levels of accuracy in Reanalysis hindcasts. baby bathwater applies, for professionals at least.
@Mosh
Wrong! :-]
We are looking for solar activity signatures in observed terrestrial weather data. You _don’t_ have to extrapolate the data over space and time. [Unless you building one of those weather “models”].
A time series of observations from one reliable instrument could suffice. [If the signal is really there].
No need to introduce myself, as most of you might be aware I happen to think (based on more than 15 years of casual on-off research with bit of knowledge acquired in the process) that the solar activity influence on the planet’s climate in the medium and long term is undeniable.
I’m sure there are many who think or even strongly believe otherwise.
– There is no point at looking at misleading 11 year (visually observed) cycles or the minuscule variability in the TSI. Neither of two represents the true totality physical reality of the solar activity but it is frequently used as the argument that “it’s not the sun … “, but it is a misleading argument.
– Meaningful analysis needs to be concentrated on the instrumentally observed and measured true physical magnetic process of solar events which have fundamental periodicities of about 22 and just over 100 years, both instrumentally identified (magnetometer was invented in 1830s )
– Since our planet defies solar electric and magnetic intrusions with its own magnetic field, no true account of any solar climate effects can be obtained by ignoring geomagnetic variable status ( the best available correlation but still lacking a solid hypothesis)
– Finally, the Earth is permanently wrapped up with electro and magnetic time variable structures of the inner heliosphere, which is dominated by sun and the two major magnetic gas giants, in which our planet is only a very minor player.
Interestingly, the geomagnetic field fades faster in the Western Hemisphere.
http://www.geomag.bgs.ac.uk/images/dFcolourful.jpg
http://www.geomag.bgs.ac.uk/research/modelling/IGRF.html
It is due to the inner earth core being asymmetric and rotates at slightly different rate to the rest (differential rotation)
Sun is the most important climate changer and the least understood. (by certain “researchers”)
In so far, the work of Landscheidt is most honourable.
http://www.vukcevic.co.uk/CT4-GMF.htm
Thank you for this Vuk.
Best, Allan
“Willis Eschenbach February 23, 2019 at 9:02 pm
Johann, if that’s supposed to be humor … don’t quit your day job …
w.”
W.E. giving advice. — listen <
No doubt it is the Sun that drive the climate. Fascinating as astronomy progress, we have evidences of other stars comparable to our Sun exhibiting not so friendly behavior like megaflares.
What if our Sun was no as stable as we think?
The Elliot wave is complex non-linear coupling that generates all combinations of 11, 5.5, 3.6-year, etc., etc. pseudo-cycles. It’s fractals that repeat patterns endlessly at all time scales. Stockbrokers have been studying fractals long before Mandelbrot discovered fractals. Climatologists should get a tutorial from stockbrokers. Solar cycles, climate change, stock market. They can fit them all in the Elliot wave :-0
Well, others apparently got more out of reading this article than I did… I am still stuck on “pure 11, 5.5 and 3.6‐year pseudo‐cycles”. So I started looking up definitions to make sense of it: Pseudo – Sham, so pseudo-cycle is a sham-cycle? So a pure pseudo-cycle is a pure sham-cycle? ??
And how do you “apply singular spectrum analysis (SSA) to the international sunspot number and the count of polar faculae” There is a spectrum to be analyzed in the sunspot number? (Head is now twitching)
OK…So trying to piece this together…They built a representative signal using data points (from sunspot numbers and count of faculae) by using a series of of sin waves (what I would call a Fourier Transformation) that have an 11, 5,5, and 3.6 year periodicity.
They then applied this…signal…to a series of weather data and found correlations between the peaks and troughs , but they kept morphing the signal around (distorting it using its Eigenvector components, so its a pseudo-cycle?) to better match the signal to the weather data?
And this suggests to them that sunspot data and weather are indeed linked but its hard to see without this SSA analysis?
Is that what this says?
OK, if I am even near on track, how the heck does this help us make a prediction? You would have to know how to morph the signal in advance to make an accurate prediction – so it would seem to only show something after the fact, not before, and therefore not very useful – other than saying “The great big ball of fire in the sky affects weather on Earth”.
If there is more to this, I love someone to explain it.
Newcomer
Robert of Texas February 24, 2019 at 8:15 am
“And this suggests to them that sunspot data and weather are indeed linked but its hard to see?”
_____________________________________________________
Here’s your link, Robert of Texas:
https://www.google.com/search?q=sunspot+data+and+weather+are+indeed+linked&oq=sunspot+data+and+weather+are+indeed+linked&aqs=chrome.
_____________________________________________________
MACH WAS D’RAUS.
Robert of Texas, the post is what I would call “fancy (and confusing) curve-fitting”.
First of all, thank you Johann and beng135 for trying to assist me.
Johann, I have tried to follow several of your links and just end up at a Google search result that points to a lot of random stuff. The top result was about horoscopes… (LOL) I was pretty sure this was not what you wanted to share. I dutifully tried to sort out anything useful and eventually came upon this PDF which WAS helpful:
https://www.researchgate.net/publication/301231958_Impact_Due_To_Sunspot_Activity_on_Climate_Change_Some_Salient_Results
From this article, I see that solar peaks are associated with 4% to 8% increases in UV wavelength energy (is this right?) from the sun, and that this is suspected to cause increased warming in the upper air over the tropics, and this leads to a general warming as air masses move about. I then found this:
https://journals.ametsoc.org/doi/pdf/10.1175/JAS-D-12-0214.1
This paper seems to confirm warming over the tropics is correlated with solar maximums of the 11-year cycle. OK, so far so good, I can understand that extra energy from the sun equals warming (from some baseline), and therefore missing this extra energy equals cooling (from the same baseline).
So I can see where a 11 and 5.5 year cycle could originate… Where the heck does a 3.6 year cycle come from?
Wow, so all these fancy terms were in fact saying “We have found another way to show that the sun’s energy output is linked to a general warming and cooling over a 5.5 year cycle (max to min).” Except of course they have this weird 3.6 component that sill makes no sense to me.
Then I followed a link provided by John Tillman:
https://climate.nasa.gov/news/849/solar-variability-and-terrestrial-climate/
Eureka…now this is interesting and understandable. But…the full report is $37 /cry
Robert write: “the full report is $37”- Ebook $30 – saved you $7 – buy a burger.
I recall Nir Shaviv wrote some good stuff on solar-climate – I like Nir’s work, as well as Jan Veizer’s.
In June 2015 Nir Shaviv gave a talk in Calgary – his slides are posted here:
http://friendsofscience.org/assets/documents/Calgary-Solar-Climate_Cp.pdf
Veizer (2005) used to be at
http://www.gac.ca/publications/geoscience/TOC/GACgcV32No1Web.pdf
Veizer and Shaviv (2003) used to be at
http://cfa.atmos.washington.edu/2003Q4/211/articles_optional/CelestialDriver.pdf