Reposted from the Cliff Mass Weather and Climate Blog
Thursday, July 18, 2019
The Strongest Summer Jet Stream to Hit the Pacific Northwest EVER!
An extraordinary weather event has been occurring above our heads during the past 24-hour. A record that was not only broken, but shattered to little pieces.
The strongest summer jet stream ever observed over the Pacific Northwest.
The jet stream is a narrow current of strong winds in the upper troposphere (roughly 25,000 ft to 35,000 ft above sea level). It is often the conduit for storms and is associated with a large temperature gradient (change in temperature with horizontal distance) in the middle and lower troposphere. Winds in the jet stream are westerly (from the west) and aircraft like to fly in the jet stream going east, while avoiding it going west. You are now Jet Steam certified!
The ECMWF 12-h forecast for 5 AM this morning for the wind speed at the 250 hPa pressure level (about 35,000 ft) clearly shows the jet stream, with the orange/red colors being the strongest winds.

This is a HUGE and very zonal (east-west oriented) jet stream…as shown by the next map at the same time. This looks like January, not July.

But now I will really impress you.
The wind this morning at the radiosonde site at Quillayute (UIL) was 140 knots (161 mph) at the 250 hPa level (again around 35,000 ft). This is amazingly fast for this time of the year.
The plot below shows the climatology of the winds at this level throughout the year at this location, with the red lines being the all-time record for each date (the black lines are average winds for the date, blue lines, the record low winds). Vertical soundings at Quillayute go back to the late 1960s…so we are talking about a half-century of observations. The previous record was around 110 knots…so the 140 knots observed today absolutely shattered the record. In fact, the wind over us right now is greater then the records for any date from April 1 to mid-October.

Record, but lesser winds, are being observed at the next upper air station to the south: Salem, Oregon (see below)

A truly unusual event. And one that should not be pinned on global warming. In fact, several of the global warming jet stream papers (e.g., by Jennifer Francis and others) suggest that global warming will bring a weak and wavy jet stream. This is just the opposite.
Toto’s link is cool. Forecast shows jet breaking up & a piece goes deep south into TX & even Mexico. Big cool-down in the US….
It’s gotta be gorebull weirding!
Meanwhile, with the current heatwave affecting a good part of the east, the narrative is that heatwaves are getting “more extreme” and that we can expect them to become even worse going forward due to (of course) “climate change”. I have reached the point where now, I would welcome a significant cooling of perhaps as much as 1C, just to shut the friggin’ Climate Cabal up! Of course, that could take a decade or more. Sigh.
Bruce, I’m walking around in the “extreme heat” yesterday (in an urban area!), and found it remarkably pleasant.
That’s because it’s still dry. Just wait til the humidity creeps in, and it will.
Nope — standard MD high humidity.
Anyone care to explain to me why they express altitude in terms of pressure (hPa)?
They don’t, he’s just translating o something understood by laymen.
Many of the instruments operate on pressure measurements, which are easy to take for many devices, while altitude is harder, requiring a laser rangefinder of similar. But pressure correlates with altitude pretty well, and absent weather, perfectly, so he can adjust the actual measurement in hPA and report it as approximate altitude for people for whom an hPA metric is meaningless (I am in that camp too, just because I know how it works doesn’t mean my gut has any baseline for these figures).
Ocean depth usually works this way too, for that matter.
It is a way to have consistency. “Altitude” is better measured with air pressure – aircraft (for example) operating in reference to a pressure level will be referencing the same thing and have consistency among and between each other. Height above ground, on the other hand, is largely irrelevant unless conducting low visibility operations at low altitudes or needing to reference height above ground for other reasons such as regulatory restrictions on low altitude over populated areas and so forth.
When height above ground is a concern, the altimeter (pressure sensor) needs to be frequently reset to the local sea level pressure reference as pressure systems are traversed. At higher altitudes, (18,000′ in US) Aircraft will all be utilizing the same “standard” sea level reference and height above ground will vary across pressure systems.
In meteorology, I would surmise that the use of various pressure levels is a convention to obtain consistency and uniformity.
The contours are constant isobars which can vary somewhat in altitude. This program has predictive value also. https://earth.nullschool.net/ One of the neat things is that when you go to a time other than “now” the date appears in the URL, so you can go to any past date by simply changing the date in the URL and hit enter. (Useful for looking at past hurricanes.)
Surface zero
1000 mb ~100 m, near sea level conditions
850 mb ~1,500 m, planetary boundary, low
700 mb ~3,500 m, planetary boundary, high
500 mb ~5,000 m, vorticity
250 mb ~10,500 m, jet stream
70 mb ~17,500 m, stratosphere
10 mb ~26,500 m, even more stratosphere
note: 1 hectopascal (hPa) = 1 millibar (mb), 1000 mb = 1 atmosphere
Keyboard Shortcuts
e show menu (toggle on/off)
esc close dialog/menu
k forward one hour
K forward one day
j backward one hour
J backward one day
n go to now
i go up one pressure level
I go to 70mb (stratosphere)
m go down one pressure level
M go to the surface
g toggle grid on/off
p toggle animation on/off
H enable/disable high definition mode
The NCEP GDAS and CPC temperature and height analyses are used to monitor processes in the Stratosphere and Troposphere.
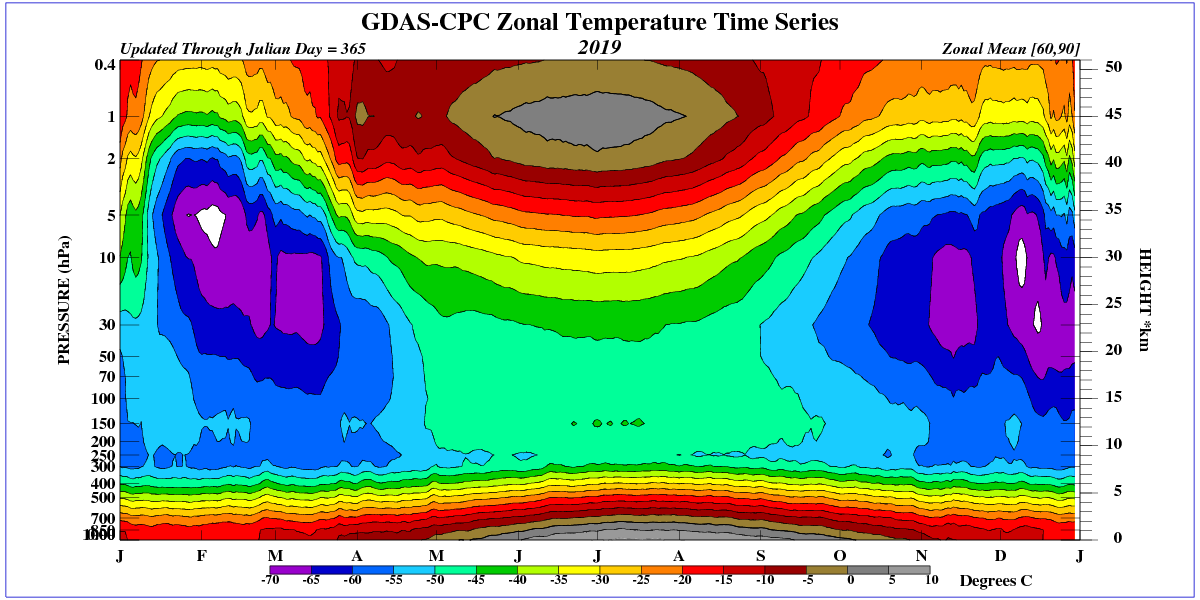
The Tropopause begins when the temperature gradient drops sharply.
Having spent time doing upper air observations I can tel you. Radiosondes cannot measure altitude, they can only measure temperature, pressure, and humidity. Wind speed is determined by bouncing radar off a reflector attached to the radiosonde. The height of the balloon at mandatory reporting levels (1000mb, 850mb, 700mb, 500mb, etc) is computed from the ideal gas laws using the average temperature and humidity between the mandatory levels. It is much easier to plot heights at a mandatory level then to try to figure out what the actual pressure is at 18kft or whatever and plot that. Since the computations for the mandatory levels are already done you don’t have to do the additional computation of trying to figure out what the pressure is at your chosen altitude, which won’t be at the same level as reported for the mandatory level.
another record, wow. and we have been recording this stuff for how long?????
Circulation over eastern North Pacific has been stable for many months.
http://tropic.ssec.wisc.edu/real-time/mtpw2/webAnims/tpw_nrl_colors/namer/mimictpw_namer_latest.gif
Circulation over the eastern North Atlantic is similarly stable.
That is why there are no hurricanes in the eastern Atlantic.
https://www.tropicaltidbits.com/sat/satlooper.php?region=eatl&product=wv-mid
“And one that should not be pinned on global warming. In fact, several of the global warming jet stream papers (e.g., by Jennifer Francis and others) suggest that global warming will bring a weak and wavy jet stream. ————— This is just the opposite.”
The atmosphere and its albedo reflect away 30% of the incoming solar energy making the earth cooler. Remove the atmosphere and the earth gets hotter.
Radiative GreenHouse Effect theory claims ——– exactly the opposite.
That the earth without an atmosphere would be similar to the moon, blazing hot lit side, deep cold dark, is not just intuitively obvious, but that scenario is supported by UCLA Diviner lunar mission data and studies by Nikolov and Kramm (U of AK).
This actual and indisputable fact negates, refutes, guts and tosses RGHE theory straight onto the long established rubbish heap of failed scientific theories together with Vulcan, phlogiston, Martian canals, luminiferous aether, spontaneous generation, tabula rasa, phrenology and cold fusion.
No RGHE, no CO2 warming, no man caused climate change or global warming.
Jet stream forecast.
http://squall.sfsu.edu/scripts/namjetstream_model_fcst.html
Better get ready for more records in 2020 as solar minimum-like conditions continue and look back for comparison to solar minimum 2009 in Northern Hem.
How long time is “EVER”?
While a record strong over the Pacific Northwest is it at its weakest somewhere else? Just thinking about conservation of angular momentum.
I am afraid it is not a solid body.
It’s the sum of solid bodies ie molecules and atoms. Coriolis force is used in the fluid mechanical analysis of the jet stream. The reason why it has such high speeds is because of the ballerina behaviour which relies on conservation of angular momentum as air moves further from the equator and closer to the axis of rotation.
Yep. 140 knots is a strong summer jet stream. I note that it was located at a fairly high latitude and associated with a strong cold spell.
Fastest jet I ever encountered was around 225 knots, but that was in January 1964 (https://overedicated.blogspot.com/2019/03/fighter-drags.html). That one ran from about New Mexico, sweeping northeast toward Maine, and then swept southward toward Spain.
I experienced a redux of that in the winter of 1970 flying from Puerto Rico to Madrid, Spain
The author’s use of the term “winds” implies that there are more than one…wonder where one wind ends and another begins. I submit that there is one wind which is connected throughout the planet’s atmosphere and whilst the wind may vary in speed and direction at various points on the earth, it remains one wind.
I think that flat and fast jet streams keep cold air closer to the poles and warm air closer to the tropics. My uneducated guess is that the northern ice minimum will be higher this year. It already looks like the DMI high arctic temperatures are starting to go down.
Anomalies in the height of the sea surface on the equatorial Atlantic.
Your jet streams are non events. About thirty years ago I dawdled westwards for about five hours with 170 kts on the nose. Next night, coming home, the wind had dropped away to 160 kts but we whistled back at about 520 kts groundspeed in our sedate sub sonic airliner. The control towers at each end were kind enough to log the overhead times and the FAI people gave us a world record uncontested to this day. (No: 1766 for the sceptics). Sorry, I meant to make the point that this was not a jet stream with associated entry and exit agro. It was a simple pressure pattern. I still have the met chart somewhere if anyone is interested.
They will soon be telling us that it is all caused by CO2, our SUVs and Climate Change…..Yawn!
Waiting for Hollywood to declare jet travel pollution as the cause and that they are all planning a mass protest in Washington DC as soon as they can confirm airline tickets.
They all have private jets
If you are flying from Seattle to say Chicago, you should make really good time – (depending on if they have a gate open). . .
As reported by the BBC, due to climate change we can expect more extreme weather https://www.bbc.co.uk/news/world-us-canada-49049378
What I find interesting is jet streams this strong are usually accompanied by strong surface low pressure systems. Not so much this summer. In fact this summer has been unusually “normal.” No heat waves no extended days of rain. Just morning clouds and afternoon sunshine. Summer weather in the Pacific Northwest is the best. Even when it hits 100ºF (every couple of years or so) it cools off at night into at least the 60’s. (Don’t ask me about the S.A.D. inducing winters)
“The North side of the Jet Stream is always “sucking” the cold air down from the Artic, whereas the South side of the Jet Stream is always “sucking” the hot air up from the Equator”
I agree. Here on the Canadian Prairies whenever the jet stream moves away from its ‘normal’ summer location usually drifting too far north, summer rains become fewer in number and intensity.
I always remember the dry summers of 1988/1989. During the evening weather reports, there were quite a few discussions about the jet stream, back when CAGW was not the cause of every sparrow that falls from the sky.
Has anyone looked in that Jet Stream for Flight 33?
For those not of a certain age, I am referencing The Twilight Zone episode: Odyssey of Flight 33!
“It is often the conduit for storms and is associated with a large temperature gradient (change in temperature with horizontal distance) in the middle and lower troposphere. ”
Should that read “vertical” distance, or am I misunderstanding something?