Guest essay by Rich Enthoven
Recently, NASA released its annual report on global temperatures and reported that 2018 was the fourth hottest year on record, surpassed only by three recent years. This claim was accompanied by dire predictions of climate change and for immediate action to dramatically curtail CO2 emissions around the globe. Like every concerned citizen read this report with interest. I also read it as an informed and trained climate analyst – and I can tell that there are some serious problems with the report and its conclusions.
For starters, I can assure my readers that I am not a climate change “denier.” No one doubts the climate changed when it experienced the Ice Age that ended 12,000 years ago. I have read enough scientific literature to believe the well documented view that the planet experienced the Medieval Warm Period (950 – 1250 AD) and Little Ice Age (1550 – 1850 AD) when global temperatures changed materially. I have also read enough scientific literature to understand that solar and ocean cycles affect global climate.
NASA is now reporting significant changes to the global temperature. According to NASA (and others) the entire globe experienced a persistent warming trend in the early part of the 20th century (1911 – 1940). Then, this trend reversed, and the globe cooled until the 1970’s.[1] Now, NASA is reporting that the global temperature increased .31° C in the last 10 years and that this trend is different than the .31° C increase NASA reports for the 1930’s[2]. But, a closer look at the data and methods used by NASA should make any reader skeptical of their results.

Land Temperatures
It turns out, that over long periods of time it is actually quite difficult to measure temperature changes from climate consistently. The problems arise from changes in measurement technology (mercury bulbs then, semiconductors now) and changes in the sites surrounding the measurement locations. A good way to think about this problem is to consider Dallas Love Field Airport where average temperatures have been reported monthly since 1940. During that time Love Field transformed from a tiny airport near a small city[3] – to large urban airport with 200 daily flights. These changes have generated massive heat at the airport. It is no wonder that the reported temperatures at Love Field have trended up by approximately 2.9 ° F since 1940. [4]

But, when we look at the temperatures in Centerville, TX – much less affected by land use changes – we see the opposite trend. The average reported temperature in Centerville has been on a declining trend and now averages (on trend) .3 °F less than it was in 1940.[5]
As a result of this urban heat effect, scientists around the world have been identifying (or constructing) ‘pristine’ weather monitoring stations to get a clearer look at temperature changes. These stations are located in areas where urban development has not occurred and is not expected. These locations do not show any meaningful change in reported land temperatures. The best data comes from the National Oceanic and Atmospheric Administration (NOAA) which set up 114 rural temperature monitoring stations in the US in 2002 (USCRN). When we look at these, we see no persistent increase in US temperatures.[6] In fact, 2018 was .3°F colder than the first two years measured. February and March 2019 combined to be the coldest two-month period (temperature anomaly) ever recorded by the USCRN.
MONTHLY TEMPERATURE CHANGES AT USCRN STATIONS

And it is not just the US rural temperatures that are stable – all around the globe, temperature growth is eliminated once land use changes are eliminated. Shown below are temperature graphs from rural areas in Netherlands, Ireland, Chile, Antarctica, Japan[7], and China[8].


Further calling into question the global land temperature data used by NASA are climate scientists themselves. Seventeen leading climate scientists (including scientists at NOAA) recently co-authored a paper calling for a new network of global weather stations in which they lamented the “imperfect measurements and ubiquitous changes in measurement networks and techniques.”[9]
Even these efforts to measure temperature change may not be enough – even the ‘pristine’ USCRN temperature measurement locations continue to biased towards warmer temperatures from land use changes. For example, a parking area and road was built next to the USCRN weather station[10] at the University of Rhode Island leading to a .34 ° C increase in measured temperatures at that location.[11][12]

Ocean and Satellite Temperature Measurement
The NASA global temperature estimate also relies heavily on estimates of temperatures in the ocean and air above it. Ocean temperatures have been measured over the years with highly inconsistent methods (buckets off ships; water flowing through ship engine rooms; buoys; and lately, satellites). In addition to technology changes, there are short term annual ocean cycles such as the well-publicized El Nino/La Nina and long term (multi decade) cycles such as the Pacific (and Atlantic) Decadal Oscillations which affect ocean temperatures at many depths over decades. A recent report out of UC San Diego described the problem “Determining changes in the average temperature of the entire world’s ocean has proven to be a nearly impossible task due to the distribution of different water masses.”[13]
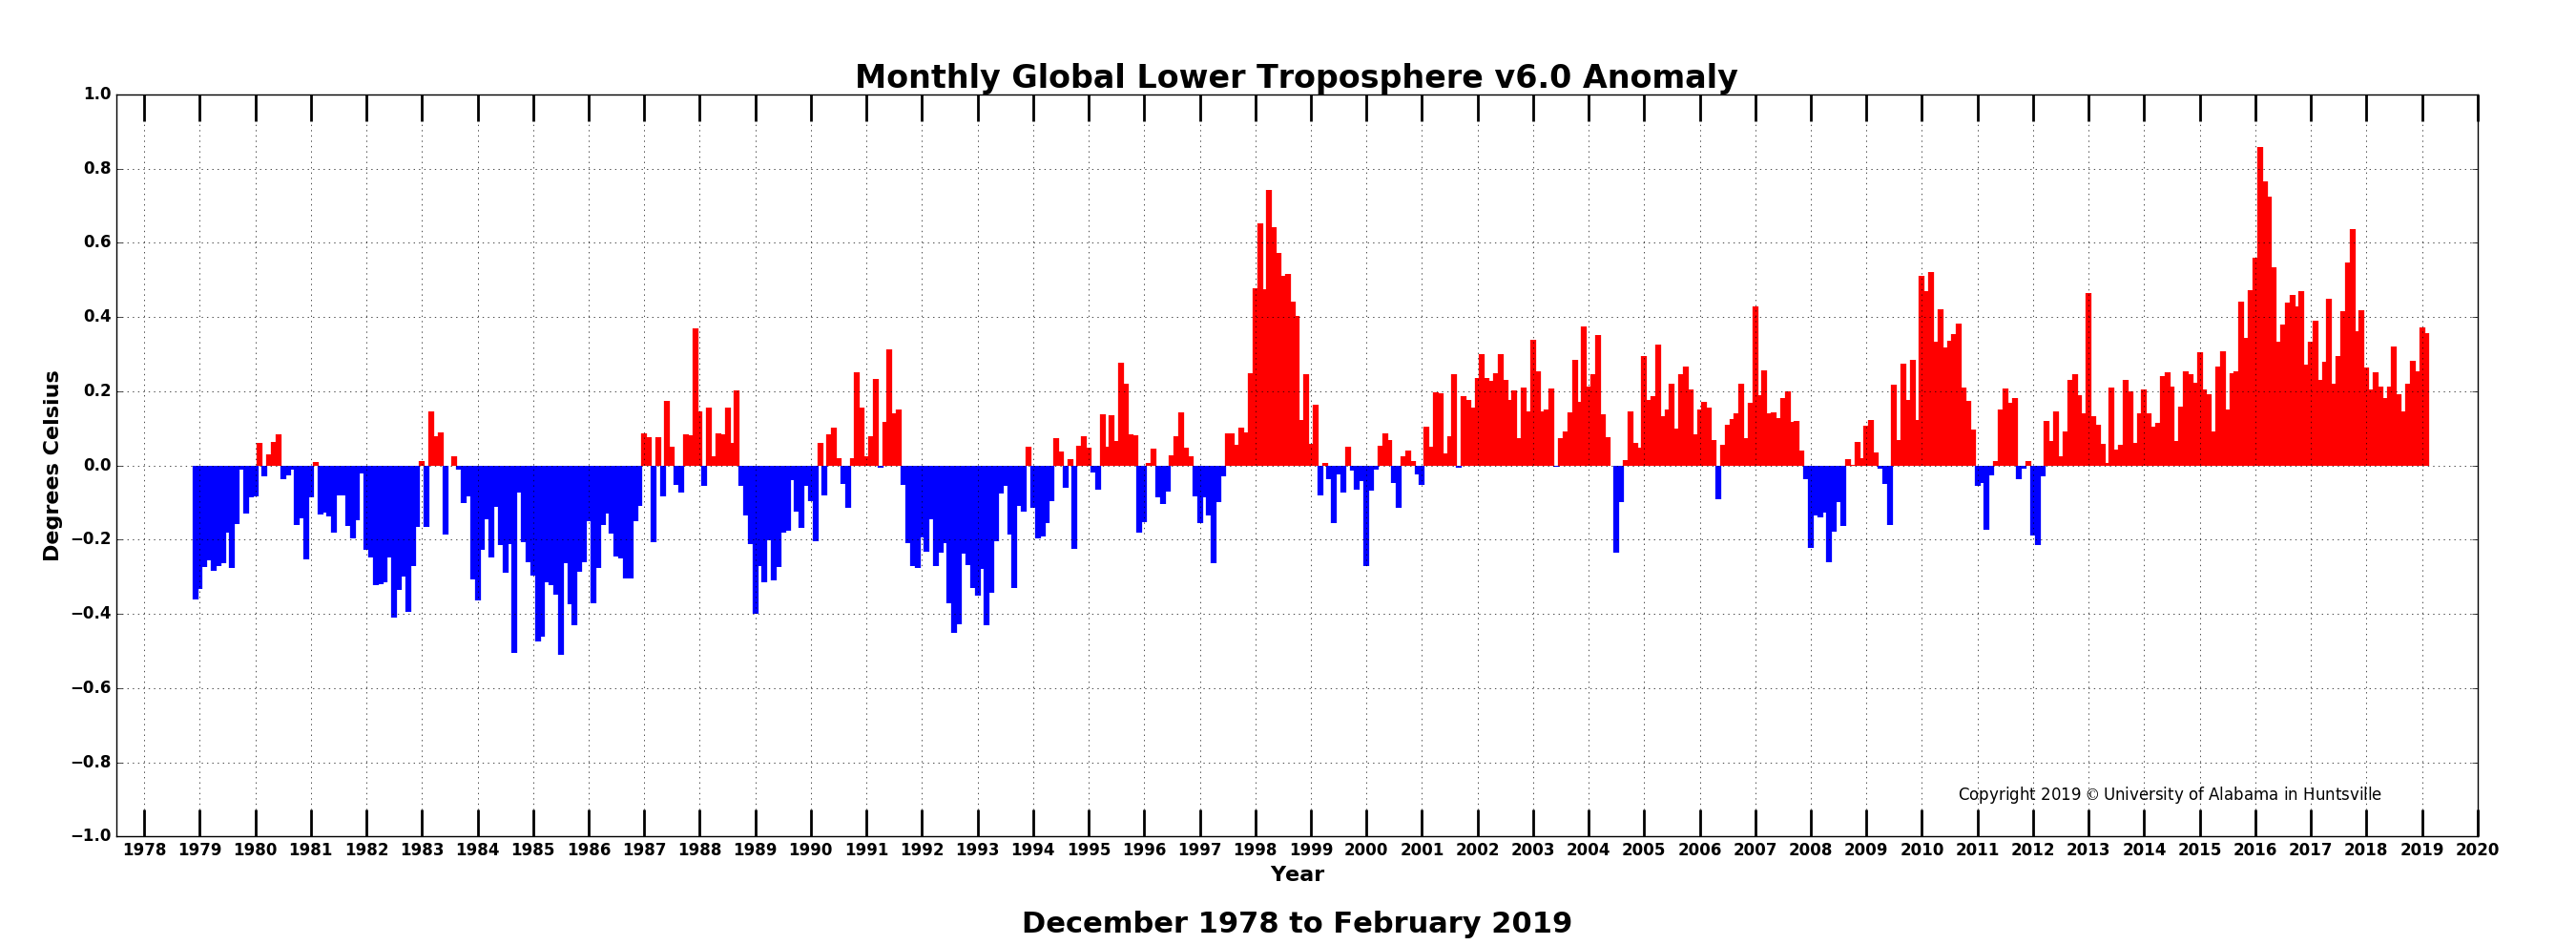
Respected climate scientists are tackling the ocean measurement challenge and come up with results very different than the NASA report. Satellite measurements from University of Alabama show atmosphere temperatures over the ocean increasing since 1980 (end of the last cooling period per NASA) but only at .13 ° C per decade.[14] Both major satellite measurement groups report temperatures are lower now than they were in 1998, although by different amounts.[15] Harvard University oceanographer Carl Wunsch estimated the average temperature of the ocean grew by .02 degrees during 1994 – 2013.[16] Scripps Institute of Oceanography recently estimated the ocean temperature growth at .1 ° C total over the last 50 years. The science and history of measuring ocean temperatures is far from ‘settled’ and there are plenty of credible estimates that ocean temperatures are not changing rapidly or at anywhere near the rate that NASA is estimating.
Back to the NASA Temperature Estimate
To come up with their global temperature assessments, NASA faces all these problems and more. For starters, there is very little reliable global scale land data before 1940, and there are still shortages of reliable data in many parts of the world. (Africa, Middle East). Most of the historical data has been affected by land use changes and measurement technology changes. As they have tried to deal with these problems, NASA has dramatically changed the locations and methods that they use to assess temperatures over the last several decades.[17] Some observers question whether the new locations and technologies have the same pattern as the old ones would have had.
Not only have they adjusted the locations they take land measurements from, NASA adjusts the data that goes into their estimates[18]. Here are examples from the NASA website for Darwin Airport, Australia and Reykjavik, Iceland that show the liberal data changes adopted by NASA.[19]


Readers should note several problematic elements of these graphs:
1) The unadjusted data does not indicate warming at these locations over the last 80 years.
2) The unadjusted data is shown in such a faint outline that its hard to see. Why would NASA present it this way?
3) As NASA changed each data set, they made the past appear cooler – the “adjusted, cleaned” data is cooler than the “unadjusted” data – and the “homogenized” data is cooler still. A cooler past allows NASA to claim current temperatures are dramatically higher.
The NASA has “adjusted, cleaned, and homogenized” the data from these locations along with thousands of others to make up the data set that NASA uses. They then add data from satellites and use data grid methodology to come up with a final temperature change result.
Needless to say, the NASA changes have been the subject of considerable debate – within the climate scientist community, the climate “skeptic” community, and even NASA itself.[20] The “unadjusted” raw data has been adjusted meaningfully over the years as NASA recalculates.[21] The satellite measurements are very controversial according Zeke Hausfather, climate researcher at Berkley Earth – “If you don’t like adjustments, you really shouldn’t use the satellite record.”[22] A major problem is that the average adjustments between raw and final data average strongly in one direction – the adjustments tend to cool the past – which makes the present temperatures seem warmer by comparison.[23] NASA itself is apparently unhappy with their current formulas and plans to release version four of their “adjustments” soon.[24]
Other Indicators of Global Temperatures
The debate about the temperatures adjustments and estimates used by NASA can quickly get in to mathematical manipulations that are well beyond the level of this article. Scientists are arguing about changes in the global temperature that are on the order of one percent of one degree centigrade. Fortunately, we can look at a variety of other climate indicators in an effort to verify whether temperatures are changing. According to the theory endorsed by NASA, humans have been increasing carbon dioxide (CO2) in the atmosphere for more than 70 years[25] – and this increased CO2 has led to demonstrably higher global temperatures which affect major aspects of global climate.
Fortunately for the planet, there is no evidence of change in large scale climate indicators that should be changing with the temperature. Here are some notable examples:
· US Land Temperatures: In 1986, James Hansen testified to congress that rising CO2 levels would cause US temperatures to rise by three to four degrees by 2020. [26] This prediction was spectacularly wrong – US land temperatures have moved at most a fraction of that amount since 1986.[27]

· Sea Level Rise: NASA (and later Al Gore) have made it clear that a warmer planet would cause ice to melt and the seas to expand – rising by up to four feet in 2050[28]. An accelerating trend in sea levels would potentially inundate lower elevation cities. But, NOAA data makes it clear that there is no change in the rate of sea level increase since measurements began.[29] If the warming globe would accelerate sea level changes, and we don’t see acceleration – it seems reasonable to suggest the globe isn’t warming.


· Hurricanes and Other Adverse Weather Events: By the early 2000s climate scientists told us to expect an increase in hurricanes due to higher temperatures in the ocean. Instead, the US experienced a major hurricane drought from 2006 – 2016.[30] In fact, global hurricanes/typhoon activity have shown no up trend in frequency or severity for the last fifty years.[31] The IPCC also reported in 2013 that there was no change in frequency of other adverse events such as droughts, floods, and tornados.

· Glaciers: Observers often become concerned as they see glaciers melting and blame it on global warming. It is certainly true that on average glaciers in the northern hemisphere have been retreating lately. But, glaciers have been retreating since the end of the Little Ice Age (1850) and numerous studies point out that many glaciers were actually melting faster during early 1900’s than they are today.[32] Glacier Bay in Alaska is a good example of the long term melting trend.

· Snowfall: In 2001, the scientists at IPCC (worlds global authority on climate change) said that rising global temperatures would result in a reduction in snowfall and even the end of skiing industry.[33] However, according to both NOAA and Rutgers University, snowfall has been trending up across the northern hemisphere since 1970. If less snow is expected from higher temperatures – is more snow an indicator of lower temperatures?[34]

These are large scale indicators that should not be subject to much measurement debate. They are not subject to “adjustments.” They all tell me that the NASA report is hopelessly biased in favor of reporting a temperature increase that is not happening.
Motivation for NASA to Report Higher Temperatures
Why would NASA come up with results so different from those of other climate observations? Consider the history of the NASA global temperature estimates. In 1986, James Hansen broadly publicized his global warming theory in testimony before the US Senate. For the next 27 years, Mr. Hansen was the chief scientist at NASA in charge of preparing and presenting those estimates. Is it unreasonable to suggest that the “adjustments” and formulas he used after his Senate testimony were biased with an effort to make his predictions turn out to be correct? How much of the NASA estimate is a simple self-fulfilling prophesy?
It’s not just NASA that is subject to significant pressure which likely introduces bias into their results. Climate scientists may be in the same position as those in other fields (i.e. nutrition, pharmaceuticals, psychology) where the desire to produce a pre-selected result influences the inputs, methods, and findings of their science. Alarming results (“hottest ever!” “disaster predicted” “urgent action needed”) all generate headlines; speaking engagements; trips to climate conferences (IPCC); and additional funding for more research. When scientists find opposite results (“nothing is really changing” “it’s just weather” “random events as usual”) they get no publicity; no funding; and instead are attacked (“pro big oil” “anti-environment” or worst of all, a “climate change denier.”)[35] There are indeed thousands of scientific papers that are at odds with NASA, but they don’t get nearly the media coverage and they are not included in NASA’s estimates.
Summary
It is time for a much more open and fair reporting and debate about global temperatures and climate change. Every time an adverse weather event occurs, we have news media blaming it on climate change that isn’t happening. We now have people marching in the streets over a non-existent crisis. All around the globe, trillions of dollars are being spent to avert a perceived global temperature crisis that is not happening. These energies and funds could be spent on far better uses to protect our environment, educate our people, and actually help the planet. We could be spending money on keeping toxins out of our ecosystems; keeping our oceans clean and healthy; improving sustainable farming techniques; expanding and protecting our natural habitats. Its time to take real action to protect and improve our planet – and stop the misplaced worry about climate change.
References
[1] https://climate.nasa.gov/vital-signs/global-temperature/
[2] Temp anomalies per NASA site: 2018 +.82 ° C less 2008 +.51 ° C =+.31 ° C. 1939 -.03 ° C – 1929 -.34 ° C =+.31 ° C
[3] Dallas population 400,000. Love Field had three daily flights. Wikipedia
[4] Data per iweathernet.com. Authors trend analysis – least squares regression.
[5] Iweathernet.com Authors trend analysis – least squares regression.
[6] https://www.ncdc.noaa.gov/temp-and-precip/national-temperature-index/time-series?datasets%5B%5D=uscrn¶meter=anom-tavg&time_scale=p12&begyear=2004&endyear=2019&month=3 See also https://agupubs.onlinelibrary.wiley.com/doi/10.1002/2015GL067640 for discussion of this data series. Trend is not significant at any reasonable level of certainty. Measurements themselves are subject to +/-.3°C at source.
[7] Temperatures from Japanese Meteorological Association.
[8] https://www.sciencedirect.com/science/article/pii/S0048969718331978
[9] Journal of Climatology 3/1/18 – https://rmets.onlinelibrary.wiley.com/doi/10.1002/joc.5458
[10] Data available at: https://www1.ncdc.noaa.gov/pub/data/uscrn/products/monthly01/CRNM0102-RI_Kingston_1_W.txt
[11] https://iowaclimate.org/2018/04/09/infrastructure
[12] Moose, Wy in Grand Teton National Park is experiencing record park visitors. Are they affecting measured temperatures at the USCRN site there?
[13] https://www.sciencedaily.com/releases/2018/01/180103160129.htm)
[14] https://www.nsstc.uah.edu/climate/2019/february2019/tlt_201902_bar.png Note this is closer to one third of the NASA estimated increase.
[15] http://www.drroyspencer.com/2014/10/why-2014-wont-be-the-warmest-year-on-record/
[16] https://www.tandfonline.com/doi/full/10.1080/16000870.2018.1471911)
[17] https://data.giss.nasa.gov/gistemp/history/
[18] https://data.giss.nasa.gov/gistemp/history/
[19] https://data.giss.nasa.gov/cgi-bin/gistemp/stdata_show.cgi?id=501941200000&dt=1&ds=5
[20] Sample paper on the debate from Journal of Geophysical Research – “There remain important inconsistencies between surface and satellite records.” https://pielkeclimatesci.files.wordpress.com/2009/11/r-345.pdf
[21] https://realclimatescience.com/2019/03/nasa-tampering-with-reykjavik-raw-temperature-data/
[22] https://www.carbonbrief.org/explainer-how-surface-and-satellite-temperature-records-compare
[23] https://data.giss.nasa.gov/gistemp/history/
[24] https://data.giss.nasa.gov/gistemp/
[25] CO2 has risen from 315 ppm to 380 ppm per Mauna Loa Observation 1960 – 2018.
[26] https://reason.com/archives/2016/06/17/climate-change-prediction-fail/print).
[28] https://www.nytimes.com/1988/06/24/us/global-warming-has-begun-expert-tells-senate.html?/pagewanted=all
[29] NOAA Tides & Currents – https://tidesandcurrents.noaa.gov/sltrends/sltrends_station.shtml?id=9414750
[30] US Hurricanes: https://journals.ametsoc.org/doi/pdf/10.1175/BAMS-D-17-0184.1
[31]Global Cyclone activity: https://agupubs.onlinelibrary.wiley.com/doi/10.1029/2011GL047711
[32] http://appinsys.com/globalwarming/gw_4ce_glaciers.htm
https://www.the-cryosphere-discuss.net/tc-2018-22/tc-2018-22.pdf https://www.researchgate.net/publication/312185500_High_sensitivity_of_North_Iceland_Trollaskagi_debris-free_glaciers_to_climatic_change_from_the_%27Little_Ice_Age%27_to_the_present
[33] https://www.theguardian.com/environment/2001/jan/23/globalwarming.climatechange)
[34] In 2019, Mother Nature is making this point emphatically with at or near record snowfall and cold temperatures across North America and Europe.
[35] Prof. Ross McKitrick http://www.rossmckitrick.com/uploads/4/8/0/8/4808045/gatekeeping_chapter.pdf and Judith Curry are well known commentators on this phenomenon.
Mosher advocates that the US set an example for the rest of the world. Does he really think that the Chinese (!) are going to say, “well, hey, the US reduced its emissions dramatically, so why don’t we do the same!” That’s Kumbaya land.
What they’re really going to say is, “hey, those American morons have made themselves globally uncompetitive. We’ll take over more key industries and become the dominant global power. The Americans will bend the knee to us!”
Will the Indians say, “hey, those self-sacrificing Americans have reduced emissions so dramatically, we must do the same.” Kumbaya, folks. What they’ll actually say is, “Holy crap. Those nasty Chinese on our border and off our coasts are growing ever more powerful, and our American friends have ceded the field. We had better increase our pace of our industrialization to match the Chinese, or we’re going to be swamped!”
“”· Snowfall: In 2001, the scientists at IPCC (worlds global authority on climate change) said that rising global temperatures would result in a reduction in snowfall and even the end of skiing industry.[33] However, according to both NOAA and Rutgers University, snowfall has been trending up across the northern hemisphere since 1970. If less snow is expected from higher temperatures – is more snow an indicator of lower temperatures?[34]” – Article
Should I ask these “scientists at IPCC” to come and shovel the snow off my front steps when it snows 6 inches of white, cold stuff in mid-April? It was April 15, 2019 to be precise. I have photos. I always take them. Always. I also have the February snow and the January snow and the November 2018 snow, and I’m tired of shoveling this stuff. I think they should do it, instead of sitting in comfy offices, completely unimpaired by
reality.
If these smug desk jockeys plan to use the Bay of Fundy to prove that the oceans are rising, because the Fundy tidal bore can frequently be fierce, then they should have their funding removed for reporting baloney.
All those weather stations posted at airports, instead of away from anything that compromises real resulsts? ALL of them should be moved to non-urban areas as well as mid-city parks.
Frankly, everything I’ve found on the length of time for cooling periods and warming periods consistently shows that the warming periods are shorter than the cooling periods. And I think this one is getting ready to thump us but good.
Everyone who has lived in the Sierras for any period of time knows that snow totals are going up, not down. I don’t have temperature data, but it’s definitely not getting warmer.
Squaw Valley intends to close on the unusually early date of JULY 7th!
No, not getting warmer here in the upper Midwest, either. We had a warm day today and will again tomorrow, and the buds are breaking on the trees and bushes, but it goes back to cold at night. Birds are still coming to my feeder because NO BUGS for the grackles, cowbirds and redwings are showing up just yet.
We’re at 7500 feet, and I could still step out of the 2nd floor window onto the snow. When this stuff melts, Lake Tahoe levels will continue to rise because there’s only so much which can exit via Truckee river.
The heat Island effect was effectively dismissed after aqua time series were released recently
The research design using plots with a sensor that measures that plot relies on the integrity of those plots staying in the same conditions in terms of number, location, and exacting control of disruptive influence from outside each plot. Any such disruption should result in that plot being eliminated from the study. So any plot that has been adjusted should go. Period. Else the study is lipstick on a pig.
I liked this article for its simplicity and general overview of issues even as it has been criticized for cherry picking. The one thing the article will not do is convince the general public to “cool down the hysteria”.
My kids are well educated as are my siblings yet none I contend can digest plots quickly and easily. They are smart enough to know they can be gamed by plots and also uncomfortable in digesting their meaning. My point is people’s concerns about climate change will not be challenged by scientific arguments, even as simplified as in this article. As an example, the IPCC says there is little confidence in increased severe weather events due to global warming. Yet, politicians in particular, tout this red herring as reason to reduce CO2 emissions by commanding we pay for more renewable energy infrastructure.
Like “Medicare for All”, people like it until they find out what they lose and how much it costs to make it happen. Renewable energy is great but renewable energy to replace most or all fossil fuels is very expensive and destructive. I suspect that until the pain of going green becomes unbearable there will be no change in direction. I am hopeful that in the US, the states that are going 100% green (electric grid only, not transportation), most by 2045 (CA,NY,HI,WA,OR) will expose the high costs of their efforts and people that vote will take action. Until then, scientific debates are fun but will have zero impact on our future. I am reminded of the quote that goes something like “you can depend on nations to do the right thing when they have exhausted every other possibility”.
Excellent and very illuminating analysis, Rich Enthoven!
Thank you.
“Don’t use fossil fuels” is no different than telling people “don’t eat fat”, it causes heart disease. Quie unforseen we ended up with an epidemic of diabetes and obesity that is killing large numbers of people.
“Don’t use fossil fuels” will also unexpectedly kill large numbers of people. We don’t know how it will happen. But we can be sure it will happen.
Actually fat doesn’t cause heart disease according to Dr. Malcolm Kendrick, although he too has been criticised as a sceptic for his hypothesis.
Someone has informed me that AGW is 5 sigma science and is beyond reproach, if I understand 5 sigma correctly.
It’s a joke…. https://wattsupwiththat.com/2019/02/26/evidence-that-humans-are-responsible-for-global-warming-hits-gold-standard-certainty-level/
Heck, every experimental result has a 5 sigma level. It might be hugely wide, but it’s there.
I wonder if the average person repeating the talking point that something about climate science has a 95% certainty. or a 6 sigma whatever even knows to what those values refer.
This article and perhaps others like it should, in my opinion, be the first and stationary page when a newcomer first opens WUWT. I have linked to good articles for friends but when they first open the site it is not clear that this is a serious scientifically based site. Sometimes the leading article is a sort of spoof and we regulars all know it but an newby will not understand.
Perhaps better “marketing” will reassure the curious. Few will take the time to look through the reference pages for reassurance unless their first glimpse does the trick.
A well written presentation. Anthony, why not ask Nick Stokes to provide a similar presentation. We need informed debate, not alarmist nonsense.
I came across an article by Vikram Mansharamani in the Harvard Business Review titled “All Hail the Generalist”. I was looking for things on this topic because I am in a job hunt and very bothered by employers’ current emphasis on what I call hyper-specialization. We are forced into such narrow fields at work that when we lose our jobs, we can’t do anything else. Education is learning more and more about less and less until you know everything about nothing and nothing about everything. This topic has immediate bearing on the AGW debate. Modern climate scientists are highly specialized. Climate modeling is a refined art. Is it possible they are so specialized they fail to see anything beyond their models, and hence don’t even realize how far they depart from the real data, or even the desirability of model calibration (history matching)? Would they benefit from a more generalized background in meteorology, oceanography, geology, solar science to understand variables other than CO2? Climate scientists appear to be displaying the inflexibility and narrow-mindedness warned about by advocates of generalism. Their models don’t match the real world and they don’t seem to care. Is it a matter of not seeing the forest through the trees?
+10 …fully agree with that thought. It is easy to end up not being able to see the forest for the trees, as that old saying goes.
Get a fire hose for this one from USA Today: https://www.msn.com/en-us/weather/topstories/earth-day-2019-high-temperatures-rising-waters-wild-weather-–-who-is-to-blame-we-are/ar-BBW9lhG?ocid=spartandhp
It’s been cooling down since the end of the big El Nino. And people are surprised about that?
I believe the Global Politicians encourage catastrophic climate change to justify the application of Carbon Taxes on the populace. Governments are collecting large sums of money from taxing carbon and little is spent on actually fighting climate change. Since the money is going into general revenues and not into a separate Carbon Account, transparent to the public, I can only suggest the money is being used to advance their political status.
Most people are easily led by catastrophic climate policies because most people read or listen to the headlines only. They will not take the time to read the facts. Climate alarmists know this and use it to further their cause.
Too bad as the real facts are easily and readily available. The pendulum will swing back to reality. Unfortunately by then the world economy will have been ravaged by the self serving politicians.
I find it amazing that meteorologists would not know that temperatures and humidities vary on very small scales. I used to run in the early mornings and soon discovered that small hollows were often noticeably cooler than their immediate surrounds. I also lived in the country for some 12 years and observed on several occasions rain storms in adjacent fields that did not come into mine or went across only part of my fields. It is much easier to see this in country where vistas are long compared to cities where they are much more limited.
So I cannot see how one can accurately interpolate the average temperature of large areas from isolated weather stations, particularly given that measuring methods have changed as well the circumstances of the stations themselves.
I also wonder how it is possible to measure even average day or night temperatures in a particular location as it seems to me that any average will depend on the sampling frequency and on time of day or night when the temperatures are read. I also assume that it would be necessary to ensure that measurement are made at similar times in adjoining stations to determine regional averages. I do not know how these measurements are taken but assuming that these factors can be resolved we also should be aware that we are talking about changes in temperature of about 0.3% of the actual temperature (1K in about 300K) where daily variations may be 10% or more (30K in 300K).
Tony: With the advent of electronic temperature measuring devices, you can collect data every 5 minutes (which is what I do) or even down to every one minute if necessary. With on-board memory that data can be stored for 24 hours or longer and then dumped via wifi to a distant location with connection to the internet using a high-gain antenna.
I participate in an amateur radio weather net for the state of Kansas. High and low temperatures across a county let alone a state can vary quite a bit every day. Taking an average at a station and then creating an average of those averages is pretty much meaningless in describing the actual environment across a wide geographical area. Doing it on a global basis is even more meaningless if that is possible, at least in my opinion. An average totally obscures what is actually happening in any case but I suppose that is the point for many of the AGW alarmists.
With due respect I think some of your conclusions from the USCRN data are erroneous. Yes the Feb/March 2019 conclusions are correct but the following “When we look at these, we see no persistent increase in US temperatures.[6]” I do question the no persistent increase conclusion. If one linear trends this data and extrapolates 81 years to 2100 the trend produces a temperature of 4.2 degC. That is quite some increase that would raise the hysterical mobs temperatures! (By comparison, plotting UAH USA48 LT data over the same period and extrapolating to 2100 produces a temperature of 2.8 degC.). Im yet to analyse the rest of your comments and data charts.
Since when has the climate moved solely in a linear trend? Can you point to any linear trend in the existing temperature data over the last 10k, 100K, or longer period?
A trend is a trend. Of course there are massive swings around a trend but every single scientist still uses trends and trend extrapolations to infer something about the future, or indeed the past. Re trends over past 10k or > periods, we dont have the same temperature measuring data sets in order to compare. But clearly there are proven cycles of temperature increases and decreases over glacial-interglacial periods. For sure, based on temp proxies, clearly not the same as real temps, none of these glacial-interglacial cycles would show temp increases of 4.5C over 100 years (2000-2019 and then extrapolated to 2100). Whatever may or may not be driving this UCSRN data, it aint CO2. (nor CH4)
Linear regressions have a difficult time discerning when a trend changes from negative to positive or vice versa. Trying to use linear regression to forecast the future in a chaotic system like Earth is basically like saying things never change. “If the temperature is going up now then it will always go up!” True scientists do not operate that way. As they say in finance, “past results are not a guarantee of future performance”. Yet that is how the climate models all work.
I think the greatest irrefutable evidence for global warming are the now over 7.7 billion people on the earth, nearly all industrialized and all wanting to burn fossil fuels. This is unprecedented. Our world has never experienced anything like this in the past. That is the elephant in the room climate change deniers refuse to see. Also, our economy is now a global economy, so any measures to curb fossil fuel consumption continues to be met with opposition. Corporations obligations are to shareholders, not the health of the planet. Sure we have new, alternative energy technologies developed and developing, but my guess is that it’s a day late and a dollar short.
Walt: You don’t think that when dinosaurs roamed much of the globe that they didn’t put out tons of CO2 in the atmosphere? Huge forests burned producing CO2. Volcanoes spewed CO2. Yet the Earth didn’t turn into a cinder then. It won’t turn into a cinder today either.
The . National Tidal and Sea Level Facility (NTSLF) is the UK centre of excellence for sea level monitoring, coastal flood forecasting and the analysis of sea level extremes.