Guest sciencey schist by David Middleton
Yes… I know it’s Pisa, not Pizza… But I’m trying a low-carb diet and I really miss pizza,
Among the 1,000+ UNESCO World Heritage sites that are about to be eroded away by a RCP8.5-fabricated Noachian Anthropocene* Deluge is the Piazza del Duomo of Pisa, Italy. This is the site of one of the world’s longest-surviving civil engineering failures: The Leaning Tower of Pisa.
*Anthropocene: Fake word.


Construction of the Leaning Tower of Pisa began in 1173 AD and it was completed in 1372 AD… 199 years. I wonder if it was behind schedule and over budget?
Funny thing, this is a hypothetical map of Pisa in the 5th Century AD (the 600’s)…

Pisa was surrounded by water in the 5th Century. It was a coastal city during Neolithic times and a key port during Greek and Roman times.
The origins of Pisa and Etruscan Pisa
Neolithic remains indicate that the mouth of the Arno was settled in very early times and most likely Ligurian colonists of Celtic origin settled here. We know that Pisa was a port of call for the Greeks and the legend of Pelops, who left the banks of the Alpheo, a river in the Peloponnese, for those of the Arno to found a new Pisa is possibly supported by Virgil in the 10th book of the Aeneid.In the Etruscan period between the 6th and 3rd centuries B.C., Pisa, situated near the extreme northern border of Etruria, was influenced by Volterra but never became more than a modest village of fishermen and boat builders, probably limited by the instability of the coastline and the periodic floods of the Arno.
Roman Pisa
As Etruria was romanised, Pisa grew in importance and was an ally of Rome in the long wars against the Ligurians and the Carthaginians. The port (Portus Pisanus), situated between the mouth of the river (at that time near where San Piero a Grado stands today) and that portion of the coast now occupied by Livorno, constituted an ideal naval base for the Roman fleet in its expeditions against the Ligurians and the Gauls, and in the operations aimed at subjugating Corsica, Sardinia and various coastal zones of Spain. Pisa, as an ally of Rome, then became a colonia, a municipium and in the time of Octavianus Augustus (1st cent. B.C.) was known as Colonia Julia Pisana Obsequens. In the meanwhile the growth in population, the development of shipbuilding and trade – fostered by the establishment of the Via Aurelia and the Via Aemilia Scaurii as well as by the harbour – resulted in an expansion of the inhabited area which was soon surrounded by walls.[…]
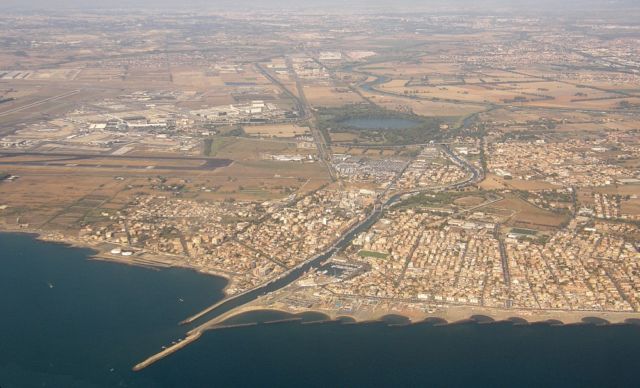
Today, the Leaning Tower of Pisa is about 10 km inland.
The Pisa coastal plain provides some excellent geological evidence for the Holocene Highstand (Sarti et al., 2015).

The regression of the Tuscany coast line since Roman times fits in very nicely with a falling sea level…

The Leaning Tower of Pisa is “only” about 3 m above sea level… Which is probably higher above sea level than when it was constructed. The nearest long-record tide gauge station in the PSMSL data set is for Genova (~150 Km). The Livorno station is closer (~25 km), but only goes back to 2001.

At 1 mm/yr, the Leaning Tower of Pisa should remain safe from climate change for at least 2,000 years… By which time, it will have already fallen over.
Live Science Culture
When Will the Leaning Tower of Pisa Fall Over?
By Live Science Staff | July 5, 2011
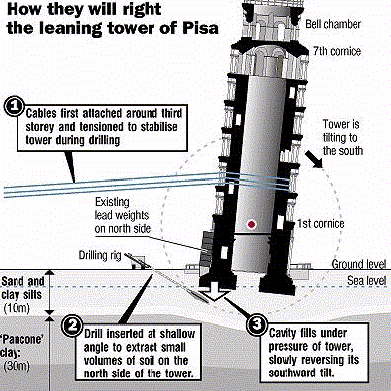
Experts say the famous tower at Pisa will lean for at least another 200 years. It may even stay upright well, almost upright forever. That’s all thanks to a restoration project, which brought the tower back from the brink of collapse a decade ago.
From the first moment of its construction on unstable subsurface soils in 1173, Pisa’s bell tower tilted farther and farther to the south. Its early-onset lean even influenced the way it was built, as its architects tried to compensate by angling the structure northward, resulting in its being banana-shaped.
A few ill-advised construction projects accelerated the Leaning Tower’s invisibly slow fall during the past couple of centuries; it tilted 5.5 degrees, its acutest angle ever, in 1990. By all calculations, the tower should have toppled at just 5.44 degrees, but fortunately it defied the predictions of computer models just long enough for engineers to come up with a fix.
[…]
Who would have guessed that the Leaning Tower of Pisa “defied the predictions of computer models”? I suppose anyone not involved in computer modeling would have guessed that it would defy the predictions of computer models… It seems that nearly everything defies the predictions of computer models, particularly the climate.
A final thought… If the Leaning Tower of Pisa was built today with the same civil engineering failures… It would probably be condemned and torn down. Since it’s older than schist, it’s an “archaeological resource” that must be preserved at all costs… Go figure.
References
Jameson, J., C. Strohmenger. Late Pleistocene to Holocene Sea-Level History of Qatar: Implications for Eustasy and Tectonics. AAPG Search and Discovery Article #90142 © 2012 AAPG Annual Convention and Exhibition, April 22-25, 2012, Long Beach, California.
Reimann, Lena, Athanasios T. Vafeidis, Sally Brown, Jochen Hinkel, Richard S. J. Tol. Mediterranean UNESCO World Heritage at risk from coastal flooding and erosion due to sea-level rise. Nature Communications, 2018; 9 (1) DOI: 10.1038/s41467-018-06645-9
Sarti, G., Rossi, V., Amorosi, A., Bini, M., Giacomelli, S., Pappalardo, M., … Sammartino, I. (2015). Climatic signature of two mid–late Holocene fluvial incisions formed under sea-level highstand conditions (Pisa coastal plain, NW Tuscany, Italy). Palaeogeography, Palaeoclimatology, Palaeoecology, 424, 183–195. https://doi.org/10.1016/J.PALAEO.2015.02.020
The leaning tower of Pisa is scheduled for conversion to a wind turbine before 2023. It will correct the lean and help Italy meet its emissions targets.
…. ma non per buttarmi in Arno!
According to them, she won’t have to long to swim in the Mediterranean.
She was fibbing anyway, don’t believe a word of it, she was only after the money,… hmm, sounds familiar, not much has changed.
I said this under the previous “world heritage” post.
“So …… sacrifice our Today to preserve monuments of a long dead yesterday?
What will our monuments be?
Broken pinwheels in a third-world world?”
I’d like to amend that last line line for this post to:
“Broken AND LEANING pinwheels in a third-world world?” 😎
More learning foisted upon me, is there any way to make it stop ?
Reminds me of my daughter when she was 5 or 6.
We were trying to decide where to go what to watch on TV.
I don’t remember the choices but I do remember her objection to one of the of the options.
“But that’s ‘learning'”.
(I’m proud to say that she’s learned a lot since then.8-)
Good fracking schist, David. You keep doing all of this scientificy stuff and not worrying about feelings. Strand lines? Someone should rescue them if they are stranded, don’t you think?
The crazy thing is that I have yet to find a sea level reconstruction of the Holocene, for which there are data available, that honors the Holocene High Stand.
Every single data set I have been able to find just shows a steady slow rise over the past 7,000 years. I guess raised beaches and strand lines aren’t sufficiently quantifiable to put into a spreadsheet.
It seems to me that eustatic sea level has been rising over the holocene and that the “holocene highstand” is caused by effect of hydro-isostasy. It is very noticeable in Australia which hasn’t been effected by glacial-isostasy or plate boundary movements. Look up “glacio-hydro-isostatic sea-level equation” etc.
Geomorphic evidence for mid–late Holocene higher sea level from southeastern Australia
https://www.researchgate.net/publication/222684036_Geomorphic_evidence_for_mid-late_Holocene_higher_sea_level_from_southeastern_Australia
Evidence for the Holocene Highstand is actually most evident in low latitudes, where there has been little or no isostatic adjustment to deglaciation.
Neoglaciation from the Holocene Climatic Optimum to the Little Ice Age pretty well necessitates a general fall in sea level from about 4,000 years ago to the mid 19th Century.
Could someone refer me to something that mentions neoglaciation causing relative sea level fall of a meter or so (or anything) and therefore causing the “highstand”.
This book on page 570 explains that the highstand is caused by hydro-isostasy.
https://www.springer.com/la/book/9781402019036
This paper appears to state that the sea level change from neoglaciation is small.
http://www.pnas.org/content/111/43/15296.short
I don’t know of any papers that link neoglaciation to sea level. However, the warmest, most ice-free part of the Holocene was from ~7000-4000 years BP and the coldest, iciest part of the Holocene was the Little Ice Age. It’s difficult to picture sea level not falling in response to that, ableit on a much smaller scale than glacial-interglacial cycles.
If the Holocene Highstand was purely the result of post glacoal rebound, it wouldn’t have been so prominent in areas where there has been very little, if any, isostatic rebound.
This one is very interesting:
The Late glacial highstand was clearly isostatic. However, the Holocene Highstand of +1 m from 7000-3000 yrs BP is pretty similar to that observed in lower latitudes, where there was little post glacial rebound.
While far from uniform, evidence for a a Mid-Holocene Highstand is all over the world…
Recent efforts to erase the Holocene Highstand are reminiscent of Mannian efforts to erase the Medieval Warm Period and Little Ice Age.
David, thanks for the reply above re neoglaciation, holocene highstand and hydro-isostasy. Some of the graphs I hadn’t seen. I live in South East Australia where the highstand is very obvious. (Incidentally we have some nice Eemian deposits here.)
What do think of hydro-isostasy (not glacial-isostasy) as a concept?
The Mid-Holocene Highstand was unassailable until it became inconvenient. SkepSci has one of the most contorted explanations for why it didn’t occur that I have ever read.
Glacial isostacy is a very real phenomenon. During and after deglaciation, depressed crustal areas rise and forebulge areas subside.
Hydro-isostacy is sometimes used interchangeably with glacial isostacy and sometimes refers to deformation of the seafloor/ocean basins due to the mass of meltwater. While there are some observations of seafloor deformation, I think it’s mostly a fabrication to explain why sea level isn’t rising fast enough to match assumptions about the rate of glacial melting.
Thanks. I find hard to get my head around it.
Some of these concepts could be fabrications.
Perhaps Dr Ball could explain neoglaciation, holocene highstand and hydro-isostasy.
He wrote about sea level below but did not touch on the above concepts.
https://wattsupwiththat.com/2018/07/21/sea-level-rise-a-major-non-existent-threat-exploited-by-alarmists-and-politicians/
If you see this reply you could search this very good page for highstand, neoglaciation and isostatic.
Take into account that it from is a “skeptic” site.
http://notrickszone.com/2m-higher-holocene-sea-levels/
A lot of info here.
David Middleton,
This comment is late so you may not see it, and it may be addressed below, but:
not to be nitpicky, but the 5th Century AD would have been the 400’s. The 600’s would be the 7th Century.
It took 10 years to stabilise the Pisa tower, and it ‘righted’ itself slowly to a safe angle under it’s own weight.
So they straightened it by making it sink further.
So that is some relative sea level “rise.”
Prof. John Burland of Imperial College, London supervised the work from his desk. The hardest part was overcoming Italian bureaucracy.
https://soc-geotech.eng.cam.ac.uk/events/2016-01-20-Burland
Maybe he was inspired by the back garden (in my early twenties I spent many hours there) Imperial college its own tower , built for a Q. V’s jubilee. It is 87.5 m high while the Pisa tower is only around 56-57m depends which side you measure.
Ah, yes, we do have knowledge of the substrates beneath that tower! Can one of our civil engineer type lurkers tell us what a proper foundation that would have held up that tower might have looked like?
Piles most likely. Transcona Grain Elevator is the famous one used in lectures. It tilted dramatically when filled. It was reinforced concrete so didn’t collapse. It was emptied, straightened up and put back into service.
Piles !!!
You dont want piles…nasty itchy .
Sounds reasonable. I’m from Houston so I have seen a lot of floating-mat foundations used under buildings, especially in downtown Houston, since bedrock is about 700 feet below grade. I see piles or piers during road construction. Amazingly enough, I think I have seen pier drillings under portions of road that will end up with the appearance of slab-on-grade. Possible in soil with poor compaction characteristics?
David,
Just a note about low carb diet. Years ago a friend and I tested two different diets. He went on a low carb and I a pasta diet. After 90 days we had both lost about the same amount of per cent of body weight. I actually lost more pounds because I was bigger to start with. The common denominator was that we both had worked our way up to jogging 3 miles per day. So, exercise well, eat what yo want and enjoy life.
Back in 2001, I did a fairly strict Atkins-type diet and dropped 30 lbs in 6 weeks. I also stopped drinking beer, limited my self to 2 glasses of wine per day, walked 2 miles/day during the week and 5-7 miles/day on the weekends.
David Middleton
I took a job as an Ambulance Care Assistant (basically transporting mobility impaired patients between home and hospital) in January 2018. I still drank beer, ate a lot less because I didn’t have time, and lost around 40lbs in 3 months because of the intense exercise necessary.
Nothing wrong with drinking beer. Lack of hard physical work, even at our age (I’m 61) is the problem.
Indeed.
I mean just look at this….
http://www.peruvian-tours.com/hummingbird-greenpeace-nazca-lines.jpg
During a port call in Naples in May of 1980, I went on a guided tour of parts of the coast of Italy. We stopped in Pisa and climbed the tower. It is a very odd sensation to feel like you are climbing down the spiral stairs as you go up. The marble steps were worn and slippery. But the from the top was worth it. They closed it not to long after.
I was inside the tower in 1988 and it was closed not long after.
I went up it in 81. According to what I have read it wasn’t closed for stabilization work until 1990. It was worth the time for sure. I was disappointed in the poor preservation of the Cathedral though. However apparently some people still worship there since there were several rows of wooden pews.
When the Romans were here they could take a short cut from Sandwich to Reculver through the Wantsum Channel. All dry land now. Another few miles along the coast took them to the Swale and hence across the mouth of the Medway and into the Thames to their new settlement of Londinium. This meant a trip from Gaul to Londinium with very little exposure to the perils of the open sea for their frail galleys. In ‘Heart of Darkness’ Conrad imagines the skipper of a galley glancing nervously at the camp fires of us savages as he passes up stream.
https://canterburymuseums.co.uk/the-wantsum-channel-part-1/
Of course the leaning tower is famous for the experiement with the two balls which proved that gravety affects all objects evenly regardless of weight. A experiement which was repeated on the Moon much later.
MJE
Does the leaning tower of Pisa hold a political position?
Does it lean to the left or to the right?
Like many politicians, it depends on the audience. For those viewing it from the east, it leans left. For those viewing from the west, it leans right. So it just needs to make sure the audience always views it from the side that agrees with their position and it will win every time.
Yes.
David, you are a productive devil and I would suspect from this an excellent petroleum geologist. This regression of the sea at Pisa is a study crying out to be done and a geologist is the only scientist to be doing it. The Holocene High Stand certainly isnt something the Global Inundation Warriors would encourage anyone to study.
Evidence is all over the world. In the Caribbean, coast line cliffs are deeply notched where higher seas pounded and on shore, stranded coral reefs suggest seas were 10m higher, although perhaps these are from the previous interglacial that was hotter than this one. Also Danish geologists studied a well developed beach on the north coast of Greenland that had required a considerable expanse of open sea to develop. It had driftwood that dsted some 6000ybp(?). Today, it is thoroughly ice bound and has been for centuries. Greenland beach link and Jamaican cliff notced by higher seas.The latter is an alarmist paper but this is how they poison the science to turn you away from evidence that shows the opposite to their view.
https://m.phys.org/news/2008-10-ice-arctic-ocean-years.html
https://www.mona.uwi.edu/cardin/virtual_library/docs/1155/1155.pdf
Anyway, I think we could crowd source a paper casting light on an inconvenient truth about sea level.
This would be a shock!
Lowrie, A., S. J. Moffett, T. C. Klekamp and R. Hamiter. 1998. Eustatically-driven, Mississippi River Holocene delta-switching as part of global highstand process. Transactions Gulf Coast Association Geological Societies. 48:193-201.
David, I am a computer modeler, however unlike climate modelers I am an actual scientist. I am also doing climate model studies. Unfortunately I have about 6,000 pages of technical information I want to study before I really get into a deep dive into the software coding.
I just like to poke fun at computer modelers… I use fluid replacement models all the time… And they aren’t always wrong.
All models are wrong. Some however, are useful.
All models are approximations… When they’re right, it’s a coincidence.
A model is a symbolic device built to simulate and predict aspects of behavior of a system.
The accuracy of a model depends on the number of variables accounted for and the relationships of those variables. Simplifying massively complex systems to a few “ forcing” inputs will provide massively inaccurate predictions. See: all climate models from the 1980s to present, CO2.
The ancient port of Rome built by Claudius, the hexagon shaped water on the photo below, is now about three kms inland supposedly — solely — the result of the silting up of an arm of the Tiber.
That seems an improbable proposition to me:
“That seems an improbable proposition to me:”
If you are questioning the silting of river mouths, consider the map here:
Büyük Menderes River near Miletus
Lat/Long of 37°31′49″N, 27°16′42″E [ or 37.531, 27.2764 ] will take you to Miletus; say on Google Earth.
Compare to the map in the link.
Further reading;
https://www.sciencedirect.com/science/article/pii/S2352409X16307416
A glance at Google Earth shows that the situation at the Meander River is quite different to the Tiber.
Anyway my point was that there seems to be a reluctance in the general sources I’ve looked at to acknowledge that the relative sea level may have been higher when Portus was built conforming to the doctrine that any future warming and resultant sea level would be unprecedented at least during the Holocene.
I did not say that silting was not a factor in the ancient port being about three kms from the current coast, I was suggesting it could be due to a combination of silting and relative sea level.
That’s a small example of the false dichotomy fallacy prevailing in CC™ discourse IMO.
Rising sea levels create space for new deposition, areas near delta fronts prograde outward. Warmists never took freshman geology.
Classe, on the other side of Italy was the main port on the adriatic, and Ravenna was in coastal swamps. Now Classe is around 6 miles from the coast, and Ravenna is high and dry. A good marker for what was the sea level back in the 5th century are the buildings built then, and the churches in town are 3-4′ below current ground level. Theodoric’s tomb is 6′ below ground level.. that would be 8″ per century sea level rise.
As noted before, accretion can turn to erosion. Recently deposited sediments are particularly susceptible.
This is largely a function of sediment supply.
It is. This paper applies the Bruun rule, however.
https://www.sciencedirect.com/science/article/pii/S0921818104001195
There are no data to run anything more sophisticated at this scale.
David,
Very interesting post. I was trained as a geologist but ended up as a meteorologist in the US Air Force. In the fall of 1959 Geology majors at Rutgers took Physical Geology from Dr Pete Wolfe; we were schooled with a heavy dose of geomorphology, Dr Wolfe’s passion, and the stages of river development was one of his recurrent themes.
Looking at the map in Figure 1 of your post, there are two meanders in the Arno upstream of Pisa. An interpretation of this would be that the coastal plain was “at grade” for a considerable period and the sluggish stream flow at that time allowed development of the meanders. At that time, the meanders would have emptied at the mouth of the Arno, right on the Tyrrhennian Sea, allowing the City State of Pisa to easily engage in commerce, a validation of the map of Pisa in the 5th Century, also in your post.
When I visited Pisa in 2003, arriving by train, I walked across the Arno bridge and encountered a sign that described some of Pisa’s history. IIRC, that sign seemed to wax eloquently of the days of Pisa, the mighty city-state, up to ~1309, when it became difficult to get sailing ships to the docks, shipping fell off dramatically, the ability of Pisa to tax commerce similarly fell off, and the military prowess of Pisa fell into further difficulty.
Some histories of Pisa speak of “river silting” as the reason for this decline, but I doubt this. As your Figure 1 demonstrates, the Arno now makes a pretty straight run to the Tyrrhennian 10 km downstream of Pisa, and straight rivers don’t silt up the way meandering rivers do.
I attribute the difficulty of getting sailing ships to the docks of 14th Century Pisa to sea level fall, as the Medieval Warm Period came to a sudden end, the Little Ice Age came on dramatically, and sea level fell significantly, for perhaps 500 years. This accounts for the distance from Pisa to the Tyrrhennian, and similar present distances to the open sea at Ostia Antica, the port of Rome, Ephesus, Turkey, and the others, included in my earlier post.
There are numerous references to this sudden onset of the LIA; here are a couple: Hubert Lamb is clear that he thought the MWP ended abruptly around 1300 AD: “The change which broke the medieval warm regime must have been devastatingly sudden.” (P177. Climate, History and the Modern World.) Proxy data from the Makapansgat Valley of South Africa show this sudden and dramatic onset.
ROBERT W. ENDLICH
You didn’t happen to know John Drobnyk did you? He was our department chairman. I think he went to Rutgers… Not sure if it was the same time frame.
Funny thing… I switched majors from physics to Earth science because I was interested in meteorology and I planned on joining the Air Force after I graduated. After taking my first semester of physical geology, taught by Dr. Drobnyk, I was hooked… and wound up in the oil patch.
John Drobnyk was a graduate student and teaching assistant in the laboratory section of that very physical geology class. When I graduated in 1962 gasoline was 29 cents a gallon, we supposedly had a 30-year supply of crude oil, and there were no jobs in Geology. I was physically qualified for the military, the draft was on, and so I entered a 21 year career in the Air Force–then another eighteen in Army civil service–and ten more as a university contractor for the Army.
The Earth Sciences are a perfect forum for examining the claims of CAGW–if you engage in critical thought. A year ago I taught a class at OLLI UTEP, “Weather, Climate, and Climate Change–What the Data Say.” We have a climate study group in Las Cruces, our web site is https://casf.me/
and my class graphics are all on-line under the UTEP CLASS tab at the top of the site.
“Yes… I know it’s Pisa, not Pizza… But I’m trying a low-carb diet and I really miss pizza,”
because you believe in decarbonization.
Geschichte widerholt sich doch –
https://www.google.at/url?sa=t&source=web&rct=j&url=https://www.thelocal.de/20170601/the-never-ending-story-how-ber-airport-became-the-laughing-stock-of-berlin/amp&ved=2ahUKEwjj-IOGgpveAhXMqIsKHUGFDYMQFjAAegQIBRAB&usg=AOvVaw2Bfdn2zhCgHpAF3tb_rN7H&cf=1