Guest Essay by Kip Hansen
 I have often been asked “Why do you deny climate change?” I am always stumped by the question. It is rather like being asked “Why do you torture innocent animals?” The questioner is not merely asking for information, they are always making an accusation — an accusation that they consider very serious and a threat to themselves and others.
The reason it stumps me is that, as you have guessed already, I do not deny climate change (and I do not torture innocent animals — nor even guilty ones). And there is nothing about me or my behavior, present or past, that I am aware of, that would lead any reasonable person to think such a thing of me.
I am thoroughly guilty though of being very skeptical of what is generally referred to as the Climate Consensus — usually said to be represented by the latest reports and policy recommendations put out by the Intergovernmental Panel on Climate Change (IPCC) and its supporters; political, ideological and scientific. I suppose it is this that leads to the false accusation of “denying climate change”.
And there is the crux of the matter — it is something in the mind of the accuser, not any action of the accused, which leads to the false accusation.
MY DENIAL:
I deny that I am a Climate Denier, a Global Warming denier or any other kind of a “denialist”.
WHY I DON’T DENY:
I do not deny either of the two primary claims of the Global Warming Movement:
1. Global Warming is happening
2. Human activity causes [some of] it.
Here’s why I don’t deny #1: Global Warming is happening.
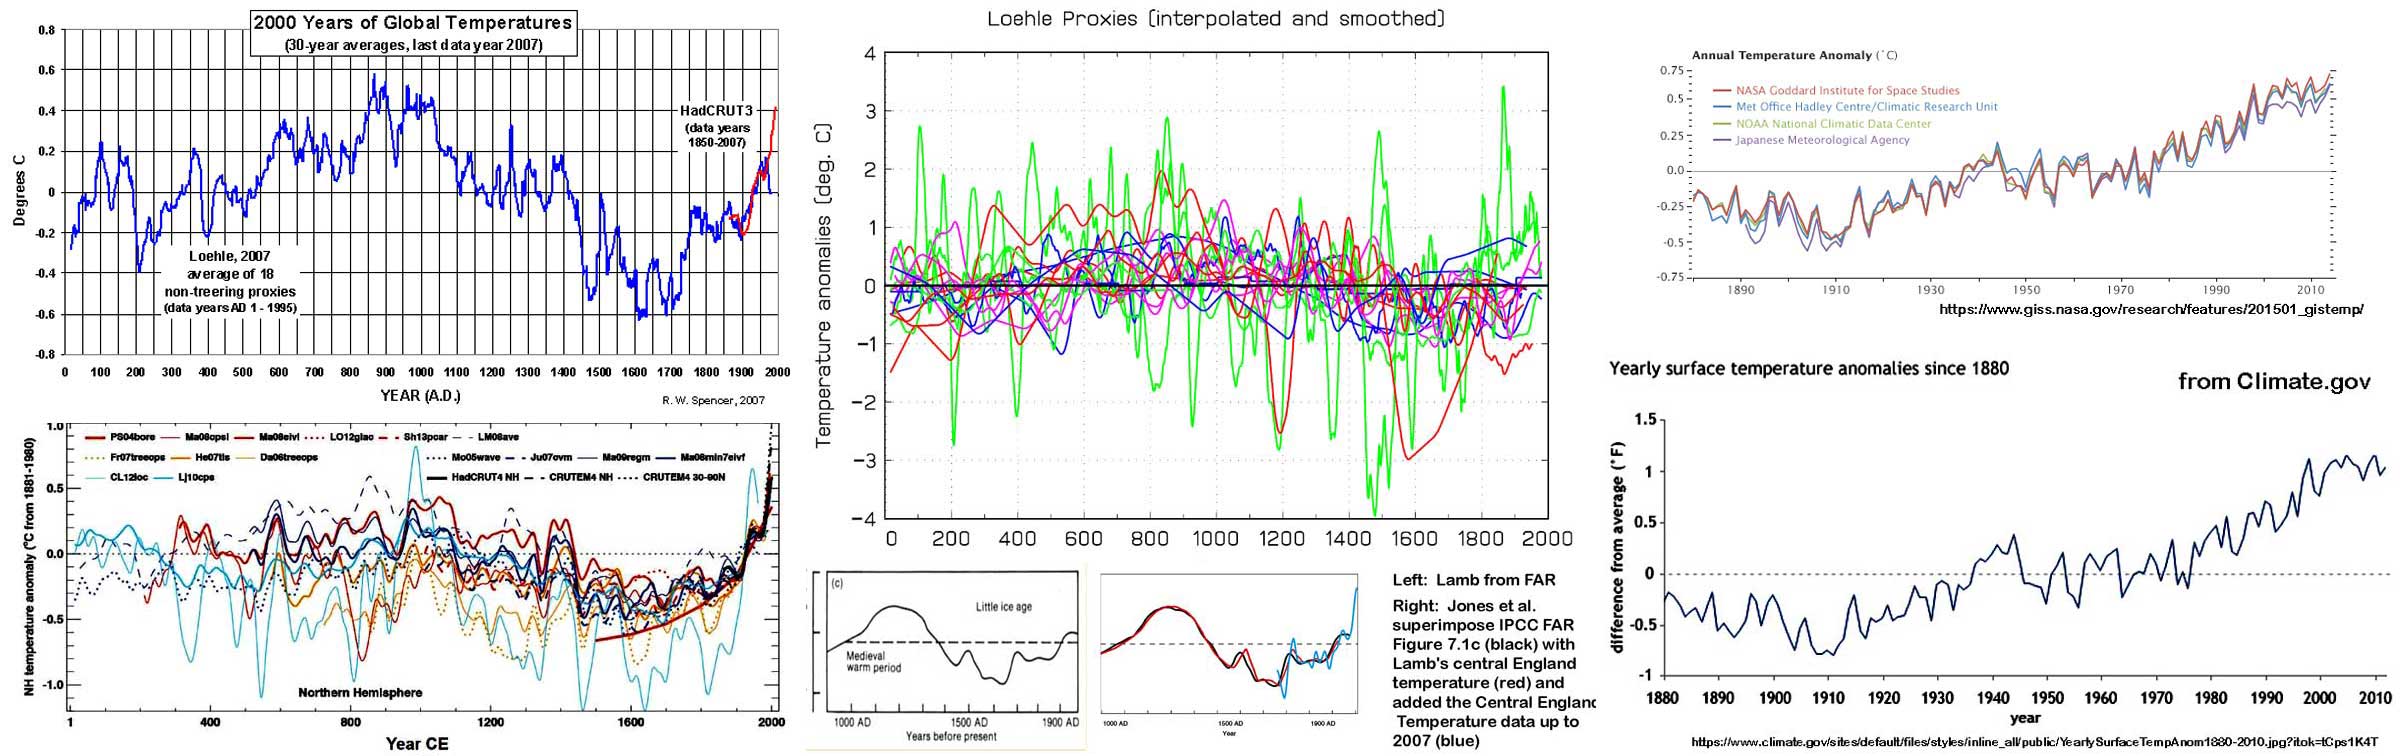
I am perfectly happy to accept that the “world” (the “global climate”) has warmed since the late 1800s. We know that the date of 1880/1890 is picked for the starting point of most of the contemporary consensus view plots — purportedly because it represents “the start of the modern industrial era”, this despite the fact that even the IPCC does not claim that “CO2 induced global warming” started at that date. Let’s take a closer look at Lamb and Lamb_modified_by_Jones:


We all know that Lamb was showing a stylized “schematic” view of Central England temperatures — and Jones 2007 re-does the analysis with very slightly different results, then overlays (in blue) the measured Central England through 2007. This graph contains the seed of my certainty that “global warming is happening” — which, in un-politicized language would be something like: “The Earth’s general climate has warmed since a bit before 1700 CE — i.e., for the last 300+ years.” Here’s Spencer 2007:

And if you prefer, here’s the NOAA version with comparisons of various reconstructions :

They all show cooling to approximately 1650 – 1700 and general warming since then.
From where does my skepticism arise then? Well, there is no more — general warming started about 1650-1700, maybe a little earlier, and has been ongoing. When warming doesn’t start is 1880/1890 — it starts a hundred and fifty to two hundred years earlier — earlier than the start of the increased CO2 output of the modern Industrial Era. This makes me very skeptical indeed of the claim that the industrial revolution and modern warming are intrinsically entwined.
And I think that it is a good thing that it has warmed since 1700. The Little Ice Age years, up thru the 16 and 17 hundreds, were hard times for farmers (and thus whole populations) in North America and Europe, as attested to by contemporary accounts of crop failures and hard winters.

To my knowledge, this point is not controversial or even contested. In the Consensus Worldview, it is simply over-looked and not mentioned. Truthfully, since the facts don’t match the narrative — the narrative that global warming was caused by the start of the Industrial Revolution and its subsequent CO2 emissions — this fact seems to have been down played or ignored.
What does the IPCC say? “Warming of the climate system is unequivocal.” — IPCC AR5 SPM 1.1
Well, I couldn’t agree more — moreover, it has been warming since about 1650-1700, two hundred years before the Industrial Revolution starts pouring out CO2.
What else does the IPCC say? “ … recent anthropogenic emissions of green-house gases are the highest in history.” — IPCC AR5 SPM 1
Again, I don’t disagree:

Without arguing about when “history” began, we can stipulate that the graph the European Geophysical Union gives us is an “accurate enough” picture of CO2 concentrations over the last thousand years. CO2 remains a shaky 275-290 ppm for 800 years and then begins to show a rise around 1850, finally breaking into new territory circa 1880-1890 — the start of the modern Industrial Era. The Wiki offers us the following, again confirming that CO2 does not begin to rise until 1890-1900, long after temperatures begin to rise.

It is simply a fact that atmospheric CO2 concentration has been rising since 1880-1890-1900 (close enough for my purpose today) and that it is now higher than it has been in a long time. Some think that this is a good thing, as it has brought about a resurgence in plant life on Earth’s surface and some think it is a bad thing.
Atmospheric CO2 has been rising — but is there doubt about this? — “ … recent anthropogenic emissions of green-house gases are the highest in history.” ?
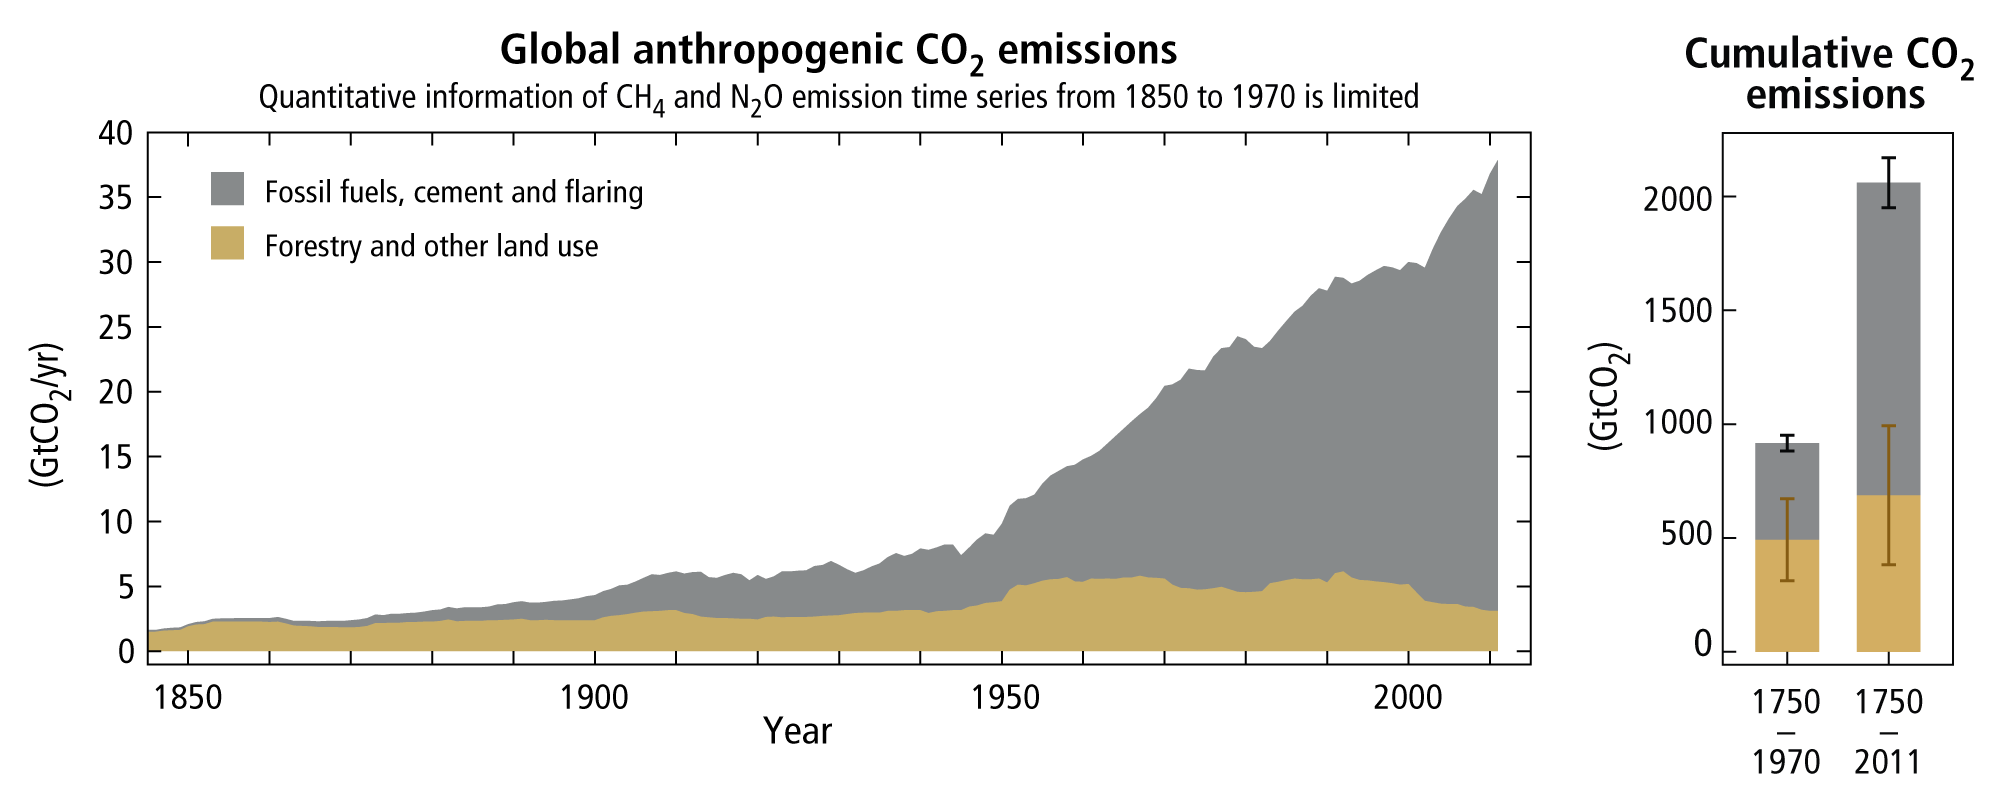
While it is not easy to measure atmospheric CO2 concentrations, it has been being done for quite some time….and we have been able to guess about human greenhouse-gas emissions and their sources. [These are naturally abject guesses, but we needn’t argue with them on that account — they are our “best guesses”).
The IPCC’s AR5 includes this graphic:

We see that recent emissions are highest, at least in this history, but notice that cumulatively up to 1970 (see the right hand inset bar graph), Forestry and other land use accounts for more than 50% of all CO2 emissions. This surprised even me — I was expecting a pretty big contribution from the clear-cutting and conversion into pasture and farmland of much of Europe and North America east of the Mississippi River — but I had no idea that Forestry and Land Use accounts for >50% all the way to 1970 –and that’s nineteen seventy, not eighteen seventy. By some proxies, global surface temperature had been rising for 300 years by 1970.
Keeping that fact in mind, let’s see what else the IPCC has to say about causes:
“Anthropogenic greenhouse gas emissions have increased since the pre-industrial era, driven largely by economic and population growth, and are now higher than ever. This has led to atmospheric concentrations of carbon dioxide, methane and nitrous oxide that are unprecedented in at least the last 800,000 years. Their effects, together with those of other anthropogenic drivers, have been detected throughout the climate system and are extremely likely to have been the dominant cause of the observed warming since the mid-20th century.”
The IPCC in their synthesis report for policy makers says that human emissions of greenhouse gases and “other anthropogenic drivers,” are “extremely likely to have been the dominant cause of the observed warming since the mid-20th century.”
Well, OK. This is where my Climate Skepticism begins to gain some traction. Dr. Judith Curry, president and founder of Climate Forecast Applications Network, recently offered the following graphic in an essay entitled “Fundamental disagreement about climate change”:

I would have used slightly different points and alternate wordings — but the essence would be the same.
The IPCC Consensus general position is shown on the left — CO2 (and other greenhouse gases) are the primary “forcing” of climate — with changes in CO2 causing changing climate (basically warming) — this warming amplified by feedbacks, like increased water vapor and clouds.
On the right is Dr. Curry’s general view — I share much the same viewpoint. I would have placed place more emphasis this:
Climate is Chaotic: It is composed of highly complex, globally coupled, spatio-temporal chaotic, resonant systems.
So far, I agree with all the facts, but don’t agree that recent CO2 (and other) emissions are “the dominant cause of the observed warming since the mid-20th century.” I agree neither with the attribution of CO2 as dominate or the effect size.
# # # # #
If you aren’t yet bored to tears, you can find out more on my reasons for that in Part 2, to be published in the next day or so.
# # # # #
Author’s Comment Policy:
I have tried to use examples, graphs, that would be generally acceptable to both sides of the Climate Divide, and to avoid controversial minor or fringe sources. I didn’t need to — I am happy with the data presented and that’s Why I Don’t Deny.
I suppose that many readers will disagree with my lack of denial or agree but have different reasons. That is how it should be in a new young field of science like Climate. Feel free to tell all in your comments. I may reply to rational, collegial remarks, questions and requests for clarification.
I am, however, too old to argue.
Address comments to “Kip…” if you expect a response.
# # # # #
Kip – wrt Judith Curry’s chart above:
The Paleoclimatologists I know belong on the right-hand side of the chart, not the left.
– Because atmospheric CO2 LAGS temperature by hundreds of years in the ice core record.
– Because climate tends to follow solar activity, not CO2.
Allan ==> Yes — maybe so… the “whose is on which side” issue is sticky as it is obviously a very personal understanding — and in CliSci, if one is a professional (whose job and reputation are on the line), then one keeps contrary understandings to oneself or disguised as “interesting findings”.
The mainstream debate between global warming alarmists and skeptics is about ONE parameter – the sensitivity of climate to increasing atmospheric CO2.
Global warming alarmists have consistently used highly inflated values of climate sensitivity to push their very-scary and very-false story – that we’re all gonna burn.
There is NO evidence that climate sensitivity is high enough to cause catastrophic global warming, and ample evidence that any CO2-driven warming will be mild and net-beneficial to humanity and the environment.
Allan ==> Read a bunch at Dr. Curry’s blog, Climate Etc. , and you’ll see that it disagreements far exceed on parameter.
Kip,
“Climate Consensus — usually said to be represented by the latest reports and policy recommendations put out by the Intergovernmental Panel on Climate Change (IPCC) and its supporters; political, ideological and scientific.” This is not the “consensus” as I understand it. The consensus is among climate scientists. Big difference. And it’s based on several studies. In these studies, it is not based on agreement with the IPCC, but rather with anthropogenic climate change. It has nothing to do with policy. There is far too much in the IPCC that is worthy of debate for most educated, thoughtful people (and especially scientists) to agree with it in its totality.
The Lamb graph was originally from his 1965 paper. I don’t know what you mean by the Jones et al. reanalysis – is the graph not based on a thermometer reading? Needs explaining, as does the very different results of the measured Central England through 2007.
“This graph contains the seed of my certainty that “global warming is happening”
This is odd, since it doesn’t represent global warming at all. And it’s very odd that you say “The Earth’s general climate has warmed since a bit before 1700 CE — i.e., for the last 300+ years” when after a peak at around 1720 the temperature drops and remains fairly stable for about 175 years – up until around 1900. Is that just a “hiatus”?
Your NOAA graph with all the squiggly lines is for the northern hemisphere, it’s not global.
Spencer’s 2007 graph (couldn’t find the source) is based on Loehle’s 2007 paper (corrected in 2008), published by Energy & Environment. At the time, it was edited by Sonia Boehmer-Christiansen.
“Energy & Environment has been accused of abusing the peer-review process, and has drawn sharp criticism for its publication of sub-standard articles. …
“According to Boehmer-Christiansen, she publishes papers counter to widely acknowledge climate science because, she contends, the skeptic position is often stifled in other outlets: ‘I’m following my political agenda — a bit, anyway,’ she said. ‘But isn’t that the right of the editor?’”
(https://www.desmogblog.com/energy-and-environment) (E&E has since been sold, and now has a better peer review process.)
This doesn’t say much for adherence to unbiased scientific standards when the editor admits to following a political agenda.
But quite apart from that, what makes you choose to show this graph over another? This article lists many problems with the Loehle paper, and it is not evidence from the corrected paper that the problems were completely solved. http://www.realclimate.org/index.php/archives/2007/12/past-reconstructions/
I find it peculiar that tree ring data was called into question, when it is only the data since 1960 that doesn’t track other measurements.
“While it is not easy to measure atmospheric CO2 concentrations, it has been being done for quite some time….and we have been able to guess about human greenhouse-gas emissions and their sources. ”
These are not “guesses.” They are based on measured isotopes.
Interesting that you would place more emphasis on chaos. While there is an element of chaos to climate, there is much known about the processes that come into play – and much to be learned still, but that doesn’t at all imply that what we don’t know is chaotic. Most of the system can be described by physical, chemical and biological processes, and if we were able to model them at high resolution with an extremely large dataset, the models would improve. The main problem is lack of knowledge (and computing capacity), particularly of oceanic, biological and cloud parameters. Each of those has elements of chaos, but if climate were truly so chaotic we would not see the patterns we do in the paleo record. Complexity does not equal chaos.
Thanks for posting the cumulative CO2 emissions info. That’s something I’ve long suspected. I think it’s worth noting that it reflects not only output of CO2, but reduced sink due to forest clearing.
I look forward to your next post.
Regards, Kristi
Dang, there was stuff I wanted to edit, but didn’t do it quickly enough!
Do we see patterns in the paleo record because they are there or because we want them to be there?
“I love humans. Always seeing patterns in things that aren’t there”- Paul McGann as the Doctor, Doctor Who 1996
The guess has to do with the relationship between the measured isotope and temperature.
Kristi ==> Again, your comment above is “shotgunning” — going on about lots of different points without really making an effort to “make” any of the points at all.
I find it odd that you seem to want to argue about the points I already concede…
You seem ill-informed about “chaos” — both Dr. Curry and I refer to “chaos” in the sense used in Chaos Theory — see my Chaos Series here and my essay Lorenz Validated @ur momisugly Climate Etc. Complexity does not equal Chaos — Chaos is a very special thing.
Kristi Silber,
The only discussion about CO2 should be how it can heat the atmosphere. CO2 absorbs outgoing Long Wave Infrared Radiation, from atmospheric molecules radiating at -80C, plus or minus. The fraction of LWIR from the Earth’s surface at the 15 micron wavelength is small, and is 100% absorbed within a few meters of the surface and immediately converted to kinetic energy of the other atmospheric molecules, also known as “Heat.” This effect has been saturated for millenia, and any changes close to the surface are minimal.
At the Top of Atmosphere, where there is very little water vapor, CO2 is opaque to this LWIR radiating from molecules around -80 C. More CO2 raises the altitude at which CO2 remains opaque to this outgoing radiation, thus lowering the temperature at which the atmosphere radiates to space, retaining more of this energy in the atmosphere.
This is rock-solid physics, but I bet no one ever told you this before. Tell your friend Chris too.
The thing is, no one can calculate the magnitude of this effect. So-called Climate Sensitivity calculations are all based on the assumption that natural variability, responsible for the Medieval Warm Period, the Roman Warm Period, the Minoan Climate Optimum, and lots of other warm periods just like this one, simply ceased around 1880 and now it is all because of CO2.
If this Climate Sensitivity is plausible to you then there is no point in further discussion.
Ever since Racial Carsons book “Silent Spring”, we have had people who a a bit like the film “The raqzers edge”are always looking for a reason to justify “The Cause”.
We now have a whole industry out there, for and against this cause, plus of course the politicians who are always looking for something to scare us with, so they can then offer to Save us from. Just as long as we then vote for them of course.
But just as with Joseph Stalin long ago said’Useful idiots”those who thought that Communism was a good idea, we still have people who believe in some form of world government, a which the United Nations, dominated by the so called “Third World”countries.
That term came from the premier of India Neru, who wished to remain neutral during the Cold War between the USA & the USSR. Today it means the difference between the “Have & the Have Not”countries, the later blaming the former for all of their problems & demanding via the UN IPCC and Paris to be paid l lots of money
Behind all the properganda beware of the man or persons hiding behind the Green Curtain. They want to destroy our way of life, so that just like 1917 Russia we the population will finally accept their version of how the World should be governed.
MJE
I too am frequently accused of denying climate change, something which I have never done. As far as I can surmise, the reason for such accusations is that my accusers are unable to refute the actual points that I make.
They are hoping thet calling you a denier will shut you down before you embarrass them.
Kip,
I respond to the question as follows:
“My position has nothing to do with DENIAL and everything to do with REJECTION.”
R E J E C T I O N
I REJECT the climate Alarmism Narrative. Denial suggests there is truth that one cannot or will not accept. REJECTION asserts that I have the qualifications to review the narrative and the outcome of that review is that the narrative fails completely. I REJECT the climate Alarmism Narrative.
I’m aware of all of the data you presented so well. However, there are many assumptions that even “skeptics” take for granted. I challenge these assumptions as there is no scientific evidence to support making the assumptions. I’ll try to summarize without writing a novel.
1. The instrument temperature record is not adequate for scientific endeavor. There are over a dozen scientific reasons as to why the instrument record is a dumpster fire. At best we know the average temperature to +/- 1C, and in that range of uncertainty who knows what is happening? No one knows.
2. The Earth does not have a singular climate. Why does this not get nailed to the wall immediately by everyone with a scientific background? The Earth has MANY climates. Attempting to understand the overall situation on Earth by averaging is not scientifically sound. 0 and 40 average to 20, just as 19 and 21 average to 20. The 2 sets of numbers obviously represent 2 very different scenarios. The averaging of temperatures (badly sampled spatially and temporally) does not tell us what is happening with the various climate regions of Earth.
3. Temperature is not adequate to capture the energy stored in the atmosphere, land, earth and ice. It’s all about the energy – not temperature. Talking about temperature is not sound from a thermodynamic perspective. Even in an adiabatic situation where the incoming and outgoing energy are in balance, we can experience an average temperature increase or decrease. Melting ice cools the atmosphere and increasing ice warms the atmosphere (that heat goes from the ice to the air). There is a massive amount of energy that is hidden in state change as water transitions from liquid to solid ice or vice versa. Ocean and lake water evaporating also occupies a massive amount of energy. Vast amounts of energy can be stored in or removed from the ice and oceans – just through the movement of energy – without any net increase or decrease of energy entering or leaving the system from the sun or space. We do not have a good measure of these things and therefore average global temperature is not very meaningful.
4. This bad temperature data is fed into climate models. There are over 100 models I’m aware of. The exact number that work (back test) is ZERO.
5. The instrument climate record is completely unremarkable when laid against the backdrop of the paleoclimate proxy record. The absolute temperatures are not noteworthy nor are the slopes of the signal. Look at the Greenland record over the past 10k years and try to find anything alarming about the past 100 years – especially as it relates to warming.
6. What exactly is “climate change”? What is the definition that everyone agrees to exactly? Where does climate variability end and “climate change” begin? Why do we say that a small change in the average temperature means that climate has or is changing? Glacial periods and interglacial periods are clearly distinct average climate states to my mind. A rain forest becoming a desert is clearly a change to my mind. Everyone talks about “climate change”, but I’m not aware of a universally accepted definition. The discussion goes on to great extend without even a basic agreement about what the subject means.
7. There appears to be absolutely no ancient historical record showing CO2 even being correlated to temperature. The 800k yr. ice record shows CO2 as the lagging effect of temperature – not the cause. I have links to over 75 peer reviewed scientific papers all showing low or no climate sensitivity to additional CO2. About 20 of those papers say essentially zero sensitivity. The rest show a very low number: 0.02C, 0.1, 0.2, 0.3, etc. If you compare that to the worst IPCC figure of 8C for doubling of CO2, then (if you ignore the papers claiming zero sensitivity) you get a 400:1 ratio. It is clear that science does not understand what the effect of additional CO2 is to “average global temperature”.
8. Storms, floods and wildfires are not more frequent or more severe.
9. The polar ice appears to be unchanged over the past 100 years. The eustatic sea level rise is likely 0.9mm/yr and is likely fed by ground water (over 30% of liquid fresh water on Earth).
10. The 97% consensus claim is ridiculous. What is the numerator and denominator driving this percentage? And again, what is the statement that the 97% agree to? Consensus is not a scientific concept – it is a political concept. Consensus is needed in a democratic republic but not in science. What are your top 5 favorite scientific breakthroughs that have come about as a result of scientists reaching consensus? F=ma, V=IR, PV=nRT, the mass of a proton, the charge of an electron? Nope. Doesn’t matter what the vote is. Not one breakthrough can be attributed to consensus. Is there such a thing as “settled” science? The word “settled” is a legal term. Law might be “settled” – but science is never “settled”. Do you “believe” in global warming? What does belief have to do with science? Like “faith”, “belief” is a religious term – not a scientific term. So, when someone says “The science is settled, 97% of scientists believe in climate change and a consensus has been reached” – you know you are not talking with a scientist. You are talking to a politician, lawyer or a priest.
I REJECT the climate alarmism narrative. Those who accuse me of being a “denier” just show me they have a weak mind.
William
William,
Well said.
Can you share the list of those 75 papers with us? Thanks.
Thanks Jim,
Here you go: http://notrickszone.com/50-papers-low-sensitivity/#sthash.VcuWbQua.R8NoeIWA.dpbs
Section (a) (at the top of the page) show 31 papers, published starting 1974 through 2018, that claim “extremely low climate sensitivity to CO2”.
Section (b) (at the middle of the page) shows the papers claiming “close to zero” sensitivity to additional CO2. There are ~43 papers in this section. The papers were published between the years of 1961 and 2018.
Section (c) (at the bottom of the page) shows papers claiming a “net surface cooling effect” of increasing CO2. 5 papers in total.
This is just a small collection of papers. How many papers have been published on the subject of “climate sensitivity”? Hundreds? Thousands? How many billions of dollars spent globally?
How many papers did it take to prove Maxwell’s equations? The Shockley Diode equation? Atomic masses? Charge of an electron? These things are reproducible as mathematical derivatives and empirically confirmable in the lab – at any place in the world to a high degree of agreement – meaning to a few hundredths of a percent. But hundreds or thousands of papers later, we still get a ~400:1 ratio of results regarding “climate sensitivity”. That ratio goes to infinity if you include the zero sensitivity results.
It’s fun to dig into and discuss all of this cool stuff about climate because most here love to understand how things work. And most people love our world and don’t want to be a part of damaging it. But we need to slam on the brakes when we come up to an assumption that does not deserve to be assumed. Even “skeptics” dutifully genuflect to the “green house” theory; for being skeptical of that is just a bridge too far and is an instant request for a free neon “denier” shirt. The truth is that despite all of the money spent and great minds applied, we don’t know the relationship between CO2 and climate. Politicians and activists have hijacked science and have come to us asking for and demanding out vote to their narrative. I REJECT their request and I proudly wear my REJECTOR shirt.
People working in the “climate science” field have the unenviable disadvantage that they have no laboratory with which to prove out their theories. The “climate” is just too big – too complex – too chaotic and too non-linear. The result is (sadly) a lot of “science” that is never grounded in reality or proof. We are more likely to lose Manhattan under a flood of climate papers than the oceans. In the world of engineering, the math and science always ground in reality. Either the plane gets you safely to your destination or you end up in a pile of burning metal and jet fuel.
William
William, point no 1 is all that is needed. Though thanks for the rest.
To be able to “use” the temperature dataset and to be able to use CLT, the sample temperature distributions are assumed to be identically distributed. For example, this is how the SST temperatures are derived. It’s a scientific assumption but not fit for real life use.
In reality the measurement tools were not designed to give such low uncertainty.
This is the fundamental problem to many people in the climate science community and many on thsi site.
If you accept the assumption you are now talking in hypotheticals and cannot apply conclusions beyond the hypothetical. If you don’t accept the assumptions then there isn’t much to talk about.
Micky, I agree. It is very tempting to get drawn into the debate. Accepting the bad assumptions makes it very difficult to argue against the massive case that rests upon the foundation of the assumptions. Whether the debate is truly scientific in nature or sadly political, I think it is important to call out the assumptions that can not be supported.
If there is Climate DENIAL, then my retort to the Alarmists is that they are the ones performing it. They deny the truth that we don’t have the global instrument network or high quality historical data necessary to make scientific advancements. They are in denial because their theories are not supported by any repeatable science.
Personally, I’m fed up with the fact that there aren’t any strong and capable voices of alarmism rejection making it to center stage. There are plenty of knowledgeable people with the right information, but if they are in the field of climate science they tend to 1) argue timidly for fear of being destroyed as a blasphemer and 2) tend to be too dignified to fight back in a way that puts the alarmists on their heels. Most “skeptics” that make it to the microphone tend to be embarrassments, making all “skeptics” appear to be uninformed clowns. I’m thinking about one US Senator who tossed a snowball around the Senate chamber in April and claimed this showed there is no global warming.
William, great comments, thanks.
“Personally, I’m fed up with the fact that there aren’t any strong and capable voices of alarmism rejection making it to center stage.”
One reason there aren’t any strong voices heard supporting ‘our’ side of the argument (Climate Change scepticism) is that they are not allowed on the airwaves, generally. There are a few – Lord Monckton and Marc Morano for two but you will never hear or see them on the BBC. Another reason is that ‘scientists’ and well-known supporters of Climate Change refuse to debate with them, because they know they would be shown up as the charlatans they are.
But I too despair at the lack of balanced debate and to hear the sceptics side being argued for. Having to constantly hear the same drivel being parroted without rebuttal is not good for my blood pressure.
William ==> Thanks for contributing to the conversation. I reject the Climate Alarmism Narrative too.
Thank you Kip for putting together the great post to start the discussion.
I have, for the entire period I have been a ‘denier’, felt uncomfortable with justifying my stance – and label.
Denier is for all intents and purposes, a tag given someone with a clinical psychological condition, and ‘denying’ anything after that, merely reinforces the accusers label or aspersions of me – you – or anyone.
So, in that effort to feel non clinically in denial, I have chosen the word ‘rationalist’ to better describe my position or stance on AGW – for a rational analysis allows far better the chance/hope that a conversation with someone doesn’t disintegrate into the two parties becoming overly partisan….hopefully.
So, I’m a rationalist who feels just fine now, and will entertain ANY fair discussion of information either side may bring to the party….even dare I say it, I would argue against someone in my own camp, were they not ‘rational’ in their argument.
This is why I feel too, most comfortable attending this site, as I feel most everyone here is quite rational…with only a rare occasion when denial of the facts seems to be a fare label to tag someone with.
Yes, very reasonable. Look forward to the next installment. Of course there will be disagreement on some points – perhaps the instrumental record as recently reported is being taken a bit too much on faith – not enough consideration to all of the rewritings of the historical record, which is one of my own grounds of unease about the whole subject.
But the basic line of argument is sound, and it raises the real and fundamental question: what exactly is it that one is obliged to believe to merit the charge of denialism? If you read Real Climate, or the Guardian environment pages (which are really skepticalscience in print) or the Ars Technica postings and comments on climate, you’ll see that the number of the elect is really tiny. There is some sort of credo or Party Line which you are obliged to believe in exhaustive detail, or be a ‘denier’. But it is never laid your clearly and in detail.
In the end the accusation seems to come down to emotional tone. Various inexplicit tests are being done to see if this guy feels like one of us. Its a matter of identity for the alarmists, its not a matter of scientific propositions. In rather the same way, the proposed policy remedies have to be accepted as a matter of identity, and not because they actually have any effect on the supposed problem as defined.
Its a very interesting social phenomenon. We have a group which claims to believe that civilisation is under imminent threat of extinction from CO2 emissions, but which refuses to advocate measures which will lower then, and also insists on advocating measures which will not lower them.
Historians of great popular delusions and the madness of crowds will have a lot of fun with this in another 50 or so years. But its not much fun right now.
michel ==> Thank you, I’ll take “very reasonable.”
Who really denies that the climate hasn’t changed over the entire Earth’s history?
Natural variability of Earth”s climate is an order of magnitude greater than anything seen in the past century, from mere weather cycles, plus Urban-Heat-Island effect’s biasing of the pseudo global-temperature ‘data’ record.
There’s no dah-nile even involved.
I was speaking to an otherwise charming lady the other night who was very concerned about climate change and worried that the artic sea ice might melt and raise sea levels and flood coastal cities etc. She could not understand my comment that it would have no impact whatsoever on sea levels. Once people have selected their reality they don’t want to concern themselves with facts or logic. Keep trying Kip but an appeal to reason is unlikely to work. The fact you are called a denier is easier and more persausive (to the other side) than presenting you with reasoned arguments – which are unlikely in themselves to alter your views. It helps them with their self image.
I’ve often wondered what evidence it would take to convince me that there is a real climate problem. I can’t think of any off hand except for very obvious man made CO2 induced disasters are frequently occurring – by which time I guess it would be too late. However the breathless media reporting of every rain storm and squall as somehow being linked (may be , might be, could be) to CO2 leaves me unconvinced.
The deceptive over reporting of every weather event as *proof* tells me they are selling bs and know it.
The climate hype strategy of taking current weather extremes, heat or cold, wet or dry, and claiming there will be more of it due to “climate change” is obvious post hoc arm waving. But it is the go to reporting standard.
The inability of climate obsessed to debate openly.
And in fact that with few exceptions they flee debate is evidence tgey know they cannot make a rational case.
marcjf ==> My purpose for writing here is to help the readers see more clearly through the murky waters of modern science and science journalism. Occasionally I help some one individual….that’s all I can hope for.
Global Warming: How Long Do We Have Left?
Using the latest statistical techniques, we can now predict, to the minute, when global warming will kill you (accurate to +/- 17 minutes).
Recently, Mr Tamino wrote an article, called “Global Warming: How Long Do We Have Left?”.
As you all know, Mr Tamino is an overly optimistic, sort of person.
I can assure you, that he took no delight, in telling everybody that they would all be dead by the year 2045. This is when we will exceed the 1.5 degrees Celsius temperature limit.
He even tried to soften the blow, by saying that you might get a couple of years more.
The only way to avoid total disaster, apparently, is to do exactly what Mr Tamino tells you to do.
I don’t want to rain on Mr Tamino’s parade, but I noticed that he made a small mistake, in his calculations for the end of the world.
He forgot to take into account, the fact that different regions of the world, have different warming rates.
That is ok for some regions, but we have bad news for Region 1 (from 90N to 48N).
With Mr Tamino’s help, I have created a colour coded map of the world, which shows the outlook for the different regions of the world.
Region 1 (90N to 48N) – Red – Already dead
Region 2 (48N to 30N) – Orange- Not feeling very well
Region 3 (30N to 14N) – Yellow – Don’t take out a long term contract for Sky TV
Region 4 (14N to Equator) – Light green – Slightly under the weather
Region 5 (Equator to 14S) – Dark green – Have been better
Region 6 (14S to 30S) – Aqua – Not feeling too bad
Region 7 (30S to 48S) – Blue – Never been better
Region 8 (48S to 90S) – Purple – Feeling great, but it is very cold, and I can’t feel my feet
People who don’t want to know when they are going to die, should not read this article. You have been warned.
https://agree-to-disagree.com/global-warming-how-long-do-we-have-left
Nonsense. Everyone knows overpopulation, overconsumption of resources and global warming killed us all decades ago.
Yup, Malthus was correct after all.
/sarc
I can never see anything in those triangle “graphs” other than a triangle with lots of pretty colors. Am I the only one that finds this “new” method of graphing absolutely worthless?
Sheri
I rarely see anything in graphs. Perhaps we are graphical dyslexics.
Sheldon Walker
Fantastic, not laughed so much in ages…….But then I’m already dead. 🙂
Excellent review that needs more energy.
The outrage is that ckimate believers, by tacitly linking agreement with them as somehow magically influencing the weather are practicing a shamanist pseudo religion/political obsession.
According to Lord Monckton, the net anthropogenic forcing as of 2018 (according to the IPCC) = 2.85 W/m^2 (includes 2/3 of negative aerosol forcing added back in). Because this supposed excess of heat each year isnt really increasing the air temperatures very much, all the alarmist climate scientists are saying that the heat is going to the oceans and eventually will come back to bite us. I wanted to check the amount of actual heat flux that the alarmists scientists say is actually hiding in the oceans all this time. The time scale will be 1955 to 1998 because that is when the period of data that was analyzed ; ended for the important study done in 2004 and published in 2005.
https://www.scribd.com/document/24701910/Ocean-Warming
with Levitus et al on Warming of the World’s Ocean 1955-2003. That study was the 1st one to actually numerate the total amount of extra forced heat flux that the atmosphere dissipated(because of global warming) to either the oceans, melting of continental glaciers, heat permanently absorbed by the troposphere, Antarctic melting, melting of mountain glaciers, melting of northern hemisphere sea ice, and melting of Arctic sea ice.
They give a figure detailing each of the above categories. The total of all categories is 17.3 x10^22 joules. We will call this the OHC%. Ocean heat content % By far the most important one
is the ocean absorbed heat. The authors state that it is 83.8% of the total or 14.5 X 10^22 joules for the Zero to 3000 metre depth. This amount came from the studies of ocean plankton!!!!!! used as a proxy for ocean temperatures. This data is apparently stored in the WORLD OCEAN DATABASE (Conkright et al 2002). In the study they state that the period of 1957 -1990 is used as a reference period for their estimates. They have had to use estmates of the linear trend for 6 ocean areas covering the globe, presumably because even though their plancton datbases contain over 2 million data points, even that is not enough to cover all 6 parts of the oceans. of course they combine that with the old bucket and expendable bath thermograph measurements. These days all the researchers use the Argo buoy float data and the plancton based database seems to have been forgotten. It may be because of the following. I am not familiar with using plancton as a proxy for seawater temperatures as an after the fact historical measurement. However the following study says some very important things on the matter.
https://www.st.nmfs.noaa.gov/spo/FishBull/70-4/eppley.pdf
“Temperature does not seem to be very important in the production of phytoplankton in the sea.”
Nevertheless the author presses on to find a maximum temperature that sets an upper limit on plancton growth rates. In the study the limit on temperature seems close to 40C. It is not saying that the temperature of the water cannot exceed 40C; only that the plancton growth curve levels off after that. Using this kind of proxy to estimate sea temperatures is fraught with huge error bars, but the important point is that the supposed total of 17.3 x10^22 joules that was the result of 50 years of imaginary forcing has not gone away. Present day climate scientists are still using the OHC% figures today and the media are going along with this of course. However it is curious that over the years, the OHC% figure has crept up from 83.8% to 93% . However since the invention of the Argo float buoy data, no one talks about plancton heat studies anymore. My contention is that I will prove that the accumulated heat that was found from these studies was bogus anyway. The result will be that even though the alarmists will argue that that heat will eventually cause CAGW, they have no credible source for the amount of heat that was hidden away and they are increasingly desperate ( because of the ARGO float buoy data) to show that any modern day heat is being hidden away in the deep oceans.
The 1st study mentioned above was where the breadcrumbs ended up in my search for the now often quoted “93% OHC% of the heat radiative imbalance in the atmosphere ends up in the ocean”. This is important for the following reason. When the UHA satellite temperature data set finally nails down that there is no atmospheric warming or very little, the alarmists will fall back on their 2nd line of defense “The oceans are warming because of CO2 back radiation and we will all die from this heat when it gets released to the atmosphere from its very long cycle of deep ocean currents and heat capacity”.
So a study that can prove that the oceans are warming is important. Unfortunately for the alarmists, the ARGO ocean buoys are increasingly showing that the amount of heat increase in the oceans is so minimal as to be laughable with estimates of 400- 600 years for a 1C rise. The buoys came into existence after the top study was finished. However the 80% figure has persisted and even increased in time and every study on ocean temperatures now always quote the OHC% figure. Even though the ARGO buoys are hard to argue against for the alarmists, the oceans are so vast and deep; that they will say that the heat is hiding in the deep ocean and will some day come back to haunt us. Most ARGO floats are good for depths down to 2000 metres but the newer ones are now measuring down to 4000 metres. Every time the data comes back that there is no increase in heat for certain depths, the alarmists say that the heat has sunk even further down. That is why we skeptics will never be able to prove that the oceans are not hiding the heat because it is a perfect deep umeasurable sink for their heat global warming meme. The big problem for the alarmists is that it conflicts with the “Climate Change has already happened meme and is causing all our extreme weather events.” However my purpose here; is to show that mostly based on the top study above, the alarmists position of total heat flux hiding in the deep ocean doesn’t add up. As usual with one lie built on top of a 1000 lies, the whole meme breaks down when you really look at the data. We skeptics have 2 things on our side 1) the truth 2) there is no central body of alarmist central office coordinating all the lies so that they can fit together as 1 credible thesis of global warming. Michael Mann tries to do this but even he cant keep up with 1000’s of researchers and 100’s of organizations that every once in a while let the truth slip out or else present stats to counter the global warming groupthink.
So Let us start from the beginning of my quest for the origin of the “80-93% of missing heat is in the oceans” figure and follow the breadcrumbs back to the top study. My quest began with a 2016 NASA study that came out titled “Warming of the global Ocean : Spatial Structure and Water Mass trends”. I will dismiss that study by simply quoting from the study “To support the results from the observational datasets we analyze the Simple Ocean Data Assimilation reanalysis ……..SODA fills in the missing data by optimizing the model physics and forcing….”
Then I switched to a 2015 study by Roemmich that is titled “Unabated planetary warming and its ocean structure since 2006”. While the 2015 study is paywalled, reporters did mention a 93% OHC%. In the study the authors mention “Global mean SST has increased by about 0.1 [degrees Celsius per] decade since 1951 but has no significant trend for the period 1998-2013.” It is interesting to quote Trenberth on commenting on the 2015 study ” It is disappointing that they do not use our stuff (based on ocean reanalysis with a comprehensive model that inputs everything from SST, sea level, XBTs and Argo plus surface fluxes and winds) ” ……”It is a nice paper but sad that oceanographers are slow to utilize all of the available information to produce better estimates. They seem to take pride in… “exclusive use of Argo” data with no use of anything else, including sea level.”
So Trenberth believes that models will give a better estimate of sea water temperature than actual observations. Such is the sad state of climate alarmism today.
WUWT covered this topic in 2016 in an article criticizing another study called “15 years of ocean observations with the global Argo array”. In that 2016 study Riser claimed the 90% OHC% figure. I should also mention NASA’s contribution to this topic.
I ntracked down the report where the 93% OHC%(mentioned above) was used.
https://www.carbonbrief.org/beneath-the-waves-how-the-deep-oceans-have-continued-to-warm-over-the-past-decade
In the media article above; where Trenberth was quoted, it mentions his study in 2013. “Distinctive climate signals in reanalysis of global ocean heat content” Because of Trenberth’s penchant for using models I didnt bother reading much of his study. However he left an important breadcrumb. “Over the past 50 years, the oceans have absorbed about 90% of the total heat added to the climate system(Bindoff et al 2007).”
In Bindoff’s lead author contribution to the IPCC Assessment papers of 2007, Bindoff does not mention the OHC% content, but the other IPCC report by Lead authors Monika Rhein and Stephen Rintoul do. They say 93% again. and they left 3 more breadcrumbs 1) by Domingues 2008(for studies from 0 to 700 metres, 2) Levitus 2012 for depths from 700-2000 metres and 3) Purkey and Johnson 2010 for 2000 metres to the bottom.
Dominigues gives a total heat flux of 16+ or – 3 x 10^22 joules from 1961 to 2003 which is in the same ballpark of the 2004 Levitus study referenced in my 1st paragraph. But that figure only inculdes the top 700 metres.
Levitus 2012 was dealt with by Willis Eschenbach in a devastating critique on WUWT.
The Purkey and Johnson study left me another breadcrumb by saying ” Over the past few decades, roughly 80% of the energy resulting from this imbalance has gone into heating the oceans (Levitus et al. 2005)”
So now we have worked our way back to the study that I referenced in the 1st paragraph. The Levitus study was actually finished in 2004 but not published till January 2005.
So let us do the numbers . As you will recall in the 3rd paragraph above , the total heat content was 17.3 x10^22 joules. This a time period from 1955 to 1998. The total solar insolation assuming nearly constant of 340W/m^2 all during that time would be 2.35 x 10^26 joules based on a total earth surface of 5.1 x 10^14 m^2. This is 1358.38 times the amount of heat that got trapped ( according to the alarmists). or 3% per year. which works out to 10W/m^2 per year. Compare that to what Lord Monckton says is the present day alarmist figure of 2.85W/m^2 that is getting trapped , you can see that there is a big discrepancy. Since the total heat trapped figure was basically taken from plancton studies which are now all but forgotten because of their inaccuracies and modern day Argo buoys, it is no wonder that the alarmists do not tell you exactly how much heat is down in the Mariana trench (11000 metres deep) and elsewhere in the deep ocean hiding away. It is because they have no credible source for the amount.
As a skeptic, I dispute their present day figure of earth energy imbalance of 2.85 W/m^2. I would like somebody to prove the earth energy balance equation with the parts that have had exact measurements and the parts that are only estimates. NASA figures give 5 or 6 W/m^2 which are pure fantasy based on their diagram. I accept the solar input figure of 340 W/m^2 and the evapotranspiration figure of 86.4 W/m^2. All other figures are only estimates or are bogus. Any thoughts?
Kip,
“I am, however, too old to argue.”
Oh no you’re not (:-))
saveenergy ==> I’m saving my diminishing old age energy by not arguing the point…..
So now we recognize the fact of climate change. It is a very important step forward, but what is the reason for denial? There are three percent among scientists, such as the Holocaust and the travel to Moon. It is a pity that the government is also part of the three percent.
It really is amazing how tightly the alarmists cling to their myths.
1) Nobody denies that the climate has changed.
2) The claim that 97% of scientists agree that CO2 is a huge problem has always been a lie.
I would be the happiest person to find out that there is no problem with the climate. However, if there is a problem then everything must be done to resolve it and not deny it.
Sharknado’s will destroy the world unless you give me control of all the world’s governments so I can direct them in the only methods that will prevent Sharknados. Now that I’ve identified the problem are you really willing to do everything that must be done to resolve it (IE get the governments of the world to hand over their power to me, making me king of the world) or will you deny it? Or does your willingness to take action depend on me proving that 1) Sharknado’s are real, 2) that if they are real they will have the effect that I claim they do, and 3) that my proposed solution will have the results I claim it will?
The true “Climate Deniers” are those who cannot accept or will not accept that the Earth’s Climate changes fairly regularly from a geological viewpoint!
Too many graphs.
Ask of your accuser just one of these questions then jump to step 6 below
1. If Greenhouse Gas Theory does work as the ‘settled science’ says, how come we are here even talking about it?
2. Why is the temperature at solar noon on the Moon always over 50 degC hotter than at solar noon on Earth when GHG theory says Earth should be 33 degC hotter than the Moon? This is 80+ degrees Centigrade of difference to explain away – not trivial.
3. What happened in the Garden of Eden (the area between the 2 big rivers in modern-day Iraq) – so that it is now a huge sandy desert?
4. Which comes first in a Tropical Rainforest – the rain or the trees?
5. Supposing there was a Medieval Warm Period, = A Time of Plenty as witnessed by all the churches and cathedrals that were built, do we assume England was comprehensively forested at that time?
We actually *can* assume a large forest because Henry 8th and his daughter Elizabeth 1st cut huge numbers of trees in order to build warships and make charcoal for armament production. Plus huge amounts of wood went into fine & stately homes their friends & favoured courtiers liked to construct – *especially* the myriad folks who fancied themselves as suitors for the ‘Virgin Queen’
(The process of ‘Romance’ at work and hence become a large part of England’s modern-day tourism industry)
After the trees disappeared, the story has it that England went into a ‘Little Ice Age’
Charles Dickens anyone?
The England we’re talking about being *the* most intensively drained, water-managed and farmed patch of dirt on this planet *and* the very place where the Gold Standard of temperature records was/is collated & maintained (the CET)
Any Cause & Effect going on in there or is it all just pure coincidence?
6. You receive a coherent answer and progress to another question selected from the above.
If not, you change the subject or, make a trivial excuse (possibly crack a lame joke about the weather haha) and walk away to allow them time to think.
Think to yourself as you do walk that you have the perfect excuse; as they themselves are telling you that ‘Life is, or going to be, ‘too short’
#4—I have read that a few trees come first, then more rain, then more trees, then more rain…..It’s all intrisically tied together. The trees increase the rain as they increase in number.
Peta ==> Just think of them (the graphs) as pictures for the reading impaired — it is easier to “see” that six major groups of scientists have produced six major data sets that say the same thing, than it is to write it all out….many would get confused by all those words anyway.
Kip
I’d rather you explained it. Graphs don’t do it for me either.
Peta and Hot ==> I do try and say in words what the graphs mean to me — and make an effort to add annotations where it may not be obvious. I’ll try harder for the “not a graph learner-types”.
Kip
I didn’t mean it as a criticism. You know I’m neither bright nor educated and when I see a graph it is almost meaningless to me. Even well annotated ones are a struggle and I have no idea if it’s a kind of graphical dyslexia, but other than the most basic of graphs, they are a real struggle. Educated people are inclined to expect people like me understand what commonly accepted terms/phrases/scientific shorthand means, but often we don’t. Sorry.
It doesn’t help that it seems most are (necessarily) compressed to fit the width of a PC screen which distorts them so they just don’t make any sense to me. A graph plotting tenths of a degree over thousands of years represented as terrifying plot of an inch or so in height when it should be utterly indistinguishable just doesn’t make sense to me.
This, on the other hand, whilst compressed, makes entire sense:
As does this
Basic and simple, and I have to refer back to them constantly to get into perspective what the world is worrying about. Absolutely nothing.
Don’t stop doing what you’re doing though, there’s more important people on here than me who will understand what you’re presenting.
“Are you a climate change denier”
No, I am terrified about the next Ice Age.
mike
I’m even more terrified that had humans not started burning stuff, atmospheric CO2 might have dropped below 150 ppm.
I believe that in the not too distant past the planet was around 180 ppm. Now, I’m not a religious man but I reckon it’s quite some coincidence that naturally but unintentionally sequestered CO2 was discovered by man who also figured out how to start a fire.
Now we’re moving gradually, but steadily away from the CO2 starvation threshold, and people are complaining?
With some 7.5 billion people generating a conservative 2400watts and 2.3lbs of CO2 per day each, it is clear that humans are causing the climate to warm and adding to atmospheric CO2. We can all agree with the 97% of scientists who say humans are causing Global Warming… That is to say, the climate is warmer than it would be without humans.
So it’s really just a question of degree(s), something which has yet to be quantified with any level of meaningful accuracy.
We’re not deniers, we’re agree’rs.
I don’t agree. With 0.04% of our atmosphere composed of co2, geological time frames when co2 has been much higher and no subsequent increase in temperature, the variable most likely correlated with climate being energy input (ie sunshine ala the Milankovich cycles), co2 volumes sequestered in and released periodically from the oceans vastly out weighing any man made co2, I believe that any effect from man made co2 is immeasurably small and lost in the noise of the system. The concept of man materially effecting climate is ridiculous on its face. I’ll give you local heat island effects but with 70% of our planet covered by water, these are negligible.
Negligible being the key word here, along with immeasurable. I was being sarcastic, if accurate, in that the mere existence of humans and our radiant heat and CO2 exhaust does in fact cause warming, whether the overall climate is warming or not. I agree that it’s negligible, and was just offering a point that we could share, that we are causing warming, and so far, not just our bodies, but our actions, are immeasurable. I hold that we are not a primary forcing, and are in the noise.
JimG1
~0.0012% of the atmosphere is man made CO2. 0.0009% if the 25% or so plants consume is accounted for.
400ppm=0.04% for normal values of 0 and 4.
JimG1
0.04% represents the total amount of CO2 in our atmosphere i.e. ~400 ppm. Or ~4% of all greenhouse gases
Man’s portion of CO2 as a % of greenhouse gases is ~0.12%, so his portion of all atmospheric gases is therefore ~0.0012%.
Gotcha. And I wonder how accurate our estimate of man made co2 existant at any one time actually is as opposed to our estimate of how much we produce. Do all of the fires burning globally get added to our tab as “man made”? And if we didn’t have oil, gas and coal to carry our energy baggage, what about all the wood we would be burning and methane from the horse turds for which we would be responsible? I guess, as far as the leftists are concerned, we should just all go out and shoot ourselves to protect mother earth.
JimG1
I imagine estimates of atmospheric CO2 are just that, estimates, at a particular point.
It’s like everything else, one could average anything but it is a theoretical number that may never be present anywhere in the world at any given moment. A bit like earth’s ‘average’ temperature.
DJ ==> Nice to have someone see right to the very point of an essay….thank you.
Why do they deny that climate change is primarily natural, and certainly nothing man has control over?
It’s a psychological warfare … There is/has been no debate. If AGW had the means, they’d shut this site down 10 years ago. AGW has piggy backed on the holocaust usage of the term ‘ denier ‘ as if that didn’t happen. AGW has used that at the outset.
As critics of AGW, it’s difficult, but not impossible to separate the two issues.
1. Yes it has been warming
2. The cause isn’t co2
There is hope. AGW has been pushing this in American schools for the last 20 years. The people that have gone through this process can see it for what it is… a scam.
Here and elsewhere, it is easy when everybody around you thinks the same way to concluded that only a few people don’t think like you do and are holding up saving the planet. We moved around a lot when I was a kid. It was inconceivable that George Wallace wouldn’t be president in Alabama, some kid on the bus disagreed and said Johnson would be. The bus went silent.
Kip, you might want to re-work the paragraph that starts “On the right is Dr. Curry’s general view…” Just a typo/edit issue.
Ron ==> someone above corrected one error — I’ll take a second look, thanks for reading closely and paying attention….proofreading is the hardest part of an author’s work, and is usually dependent on a second set of very highly trained eyes.
Indeed. I’m a terrible proofreader of my own work, as my various and numerous typos in posts over the years can attest.
So Kip “the denier” [sarc], if I understood your position,
– You accept that the surface of the planet has been warming for centuries.
– You accept that the levels of atmospheric CO2 are extraordinarily high, according to what we know, for the past 800,000 years.
– You accept that humans are mainly responsible for the increase in CO2 levels.
– You accept that the increase in GHGs might have some (unquantified) effect on climate in the direction of warming.
– You are skeptical (reject?) that the increase in GHGs is the main cause for the recent (last 45 years) warming.
OK, so far so good because we agree on all that. You have said you don’t like arguing, but do you like discussing? Because to me the most important part is the discussion about the possible causes (could be more than one) for the observed warming, both centuries ago and these last decades. As you are quite knowledgeable I would like to know if you have an opinion in this important matter. If there is no reasonable alternative it will be difficult to reject the notion that the increase in GHGs is responsible for the great majority of the recent warming.
“If there is no reasonable alternative it will be difficult to reject the notion that the increase in GHGs is responsible for the great majority of the recent warming.”
If we can’t prove that GHG’s are responsible for recent warming and we have no reasonable alternatives to GHG’s causing recent warming, wouldn’t it be better science to simply accepting that we currently don’t know what caused recent warming and continue to study the problem in an unbiased way?
The human mind abhors the vacuum. If we don’t have an explanation we invent one. In science you can’t replace a theory by the absence of theory even if it doesn’t look correct.
” In science you can’t replace a theory by the absence of theory even if it doesn’t look correct.”
In science you can’t use an unproven theory as an explanation.
Of course you can. It is done all the time. It is what hypotheses are for. The claim to fame is choosing or inventing a hypothesis and becoming a champion for it in the hope that it is the right one.
Yes but a hypotheses is only a possible explanation. You need proof for it to be upgraded to a theory.
J ==> If only Fame were the objective…..
Javier ==> Perfectly right — I’m not sure that it is a “feature” — rather think it is a “bug”.
Just plugging in any old thing is not a solution to “we don’t know yet”. But it is often what “science” does….society too.
“I’m not sure that it is a ‘feature’ — rather think it is a ‘bug’.”
Kip:
That’s a very good observation, I had not thought of it that way before. I will defer to you and Javier on this discussion.
My 2 cents worth…
IMHO the 0.5 degree C. attribution of the late 20th century warming to Anthro CO2 is nowhere near affirmed. The academic emphasis on CO2 seems to have removed the importance of the scrutiny required for the dismissal of the other arguments…Cloud cover variance, ENSO (El Nino Southern Oscillation) in combination with the PDO (Pacific Decadal Oscillation) and the AMO (Atlantic Multi-decadal Oscillation), variances in solar activity and irradiance, libration’s impact on the magnetic fields and Earth’s orbital mechanics including the subtle changes of insolation in response to the Precession nutations…to name a few.
Furthermore, I don’t undertand the nonsense (hothouse, fire, ice cap melt, sea rise, extreme weather, acid ocean etc.). As Lindzen suggests these people really don’t have the right to infer large climate change from an effect measured in tenths of a degree.
Freemon Dyson says there may be some effect at night in the colder regions…no reason for alarm. IMHO for example, at night the temperature drops to 17.6 degrees C. instead of 17.7 and during the day the temperature peak reaches 27.7C instead of 27.6…no big deal, no cause for concern.
Love your work Javier…thanks.
I fully agree, and I also think Freeman Dyson’s opinion on the matter is worth listening to. He is one of the foremost intellects of the 20th century and he looked into the issue from the very beginning.
1) The warming started long before the rise in CO2.
2) CO2 levels have been dropping for the last 100 million years. Why is returning those levels to something closer to the historical norm a bad thing?
If CO2 didn’t cause most of the warming over the last 200 years, why should we assume that it caused most of the warming over the last 45 years?
Over the historical record, there is no correlation between CO2 and temperature. Why should we assume that just because there has been correlation over the last 45 years, that CO2 has suddenly acquired the ability to control temperature?
Citation for your claim that CO2 levels have been dropping for the last 100 million years.? Ice core data shows them to be at the highest level in the past 800,000 years.
Geocarb III, which is supposed to be the state of the art in paleo CO2 levels.
It is actually more like 180 million years.
To take the devil’s advocate role that does not belong to me:
It doesn’t demonstrate that the modern warming (last 45 years) cannot have a different cause than the older one.
It depends on the climatic consequences of the change. If they are small then it is not a bad thing. If they are large then it is a bad thing. Any abrupt climate change is bad by definition, as our complex, very extended society is adapted to the current situation.
Having said that I agree that there is no definite evidence that the increase in GHGs has importantly altered the climate so far or that it will do so in the near future. But the question should be further studied because we cannot discard important negative effects in the future either.
“It doesn’t demonstrate that the modern warming (last 45 years) cannot have a different cause than the older one.”
That all depends on whether you view your role as being a scientist or an advocate.
A scientist would say that since we don’t know what caused the previous warming, we can’t rule it out as a cause for the current one.
An advocate will claim that since we don’t know, we must assume that CO2 caused the current warming.
We can leave politics and advocacies outside and examine the question on pure scientific principles. Scientists support opposing hypotheses all the time in many subjects, and they do it based on the same available evidence, just by giving more weight to some evidence over other. And the only hypotheses that can be rejected are those that have been demonstrated to be false. The dual cause for the warming (one before anthropogenic CO2, and then CO2) has not been demonstrated to be false and is supported by many scientists. The single cause for the warming hypothesis (i.e. not CO2) has in principle a better case due to Occam’s principle.
Careful examination of the available evidence, in my opinion supports the single cause for the warming hypothesis, but clearly there is not enough evidence to demonstrate that the dual cause hypothesis is wrong.
I know this is probably not the place to say that skeptics have failed so far to demonstrate that the dominant hypothesis is wrong, and that is why we are reduced to wait until climate provides new evidence, a process that is taking decades.
Of course it doesn’t help that skeptics are bitterly divided between those that think the evidence supports an important role for solar variability, and those that think it doesn’t and don’t have a clear candidate cause for the warming. So in reality for the same evidence we have multiple hypotheses and the stronger one is the CO2-hypothesis.
Javier ==> “skeptics have failed so far to demonstrate that the dominant hypothesis is wrong”…..”THE DOMINATE HYPOTHESIS” is not a stand alone, single-factor hypothesis, it is more like a generalized scenario, thus CliSci is having a difficult time finding a definitive answer. I’m sure you realize that this is the problem.
Many of the parts of the overall scenario have taken serious hits — climate sensitivity to CO2 doubling for instance. Many parts of the scenario, necessary to support the whole, are still in the realm of “known unknowns”.
This speaks to the whole purpose of this two part essay…there are many bits of the Consensus Scenario that are simply true — supported by facts with which most reasonable educated people don’t disagree — yet the Consensus Scenario remains far from convincing — this is Science, so we say “at least ‘so far’.
Javier,
The CO2 hypothesis has repeatedly been shown false.
Callendar, following Arrhenius, thought that the early 20th century warming was due to man-made CO2, rather than the CO2 being due to natural warming. And of course, he, like Arrhenius, considered the warming effect beneficial.
But then came the global cooling after WWII, despite CO2 rising even more than in the 1920s. This showed Callendar’s hypothesis false, shortly before he died after the bitterly cold British winters of the early 1960s.
CO2 rose from 1945 to 1977, when the PDO flipped, yet Earth cooled dramatically, causing concern over a coming ice age. Then slight warming happened to coincide with continued increase in CO2 for about 20 years, capped off by the 1998 super El Nino. This brief interval of natural warming was followed by accelerated CO2 rise and global average temperature staying flat. Then came another super El Nino in 2016, which caused a brief spike in temperature, as in 1998.
No correlation means lack of causation.
MarkW – I agree with you for most part. The only problem I see with your view is, to wit: the .5Deg of warming since 1980, but only if that increase is unusual for a 50 year timeframe.
Can the agw “consensus” say with confidence and accuracy that this 50 years is unusual, given the short time we have had the modern temperature record? I would think not – that the temperarure record prior to 1900 (perhaps later) is not accurate enough to resolve such an increase.
In other words, Javier’s hypothesis about the most recent warming is flawed assuming the second paragraph is accepted.
Opinions on this please, Kip.
Javier ==> Thanks for weighing in here. You got all the “accept’s right.
Bring up the point again after reading Part 2, which should be out tomorrow or the next day….as I will have laid my logical path a bit further.
A comment I posted yesterday, 8-25-2018, is missing. Though, I certainly would not overrule a glitch on my end.
Anyway, here it is:
Excellent article Kip!
This article should be added to WUWT’s Reference pages!
ATheoK ==> Thank you — what a nice thing to say. Appreciate it.