Guest analysis by Alberto Zaragoza Comendador
Note: if the terms used in this article seem confusing, check out the previous one.
Introduction
It’s well known that climate models show increasing sensitivity over time: for a given forcing, the true long-term temperature increase (ECS) is higher than what you’d estimate if you simply extrapolated from the past (ECS_hist). In other words, the ECS-to-ECS_hist ratio is above 1. This article tries to work out why climate models behave like that; that is to say, the variable I’m trying to explain is the ECS-to-ECS_hist ratio.
Now, there’s probably too many hyphens and underscores in the text. So it will be more readable if I clarify that, every time I talk simply about ‘correlation’, I mean the correlation of thing X with the ECS-to-ECS_hist ratio. If other kind of correlation is mentioned, I’ll say so explicitly.
Possible reasons the ECS-to-ECS_hist ratio is above 1
The recent Lewis & Curry paper on sensitivity (from this point on LC18) mentioned that the difference between ECS and ECS_hist is related to ECS_hist itself: the higher it is, the higher the ratio between ECS and ECS_hist. What I reported in the previous article is that while this association is true, it’s also very weak; a much stronger explanation for the ECS-to-ECS_hist ratio is the difference between ECS_hist and TCR. In the previous article I explained why, physically, this second association makes sense: any difference between ECS and ECS_hist has to be driven by forcing that has gone into the ocean, i.e. that which hasn’t warmed the atmosphere yet. The ECS_hist-to-TCR ratio is simply another way of expressing how much forcing has gone into the ocean, versus how much has warmed the atmosphere.
If ocean heat uptake is a big share of the forcing experienced so far, then the simple sensitivity formula used in the energy budget papers involves a lot of extrapolation, meaning ECS_hist will be a less reliable measure (the true sensitivity value, ECS, may turn out to be very different from ECS_hist). By contrast, if ocean heat uptake is small as a proportion of forcing, there is not much room for ECS to deviate from ECS_hist.
The association between ECS_hist and the ECS-to-ECS_hist ratio was point was a minor one in LC18; mostly the authors were responding to a previous study by Kyle Amour (hereinafter A17). After checking out A17, I noticed it made the argument much more strongly. I thought this was strange, as going by the LC18 data the relationship didn’t seem worth writing much about, so I decided to work with A17’s numbers as well.
Just to be clear, my objective is not to discuss whether the values in one paper are more correct than those of the other. Rather, what I want to see is if the conclusions I drew apply to both papers.
Differences between LC18 and A17
A17 provides data from 21 climate models. It offers one measure of ECS_hist (called ECS_infer in the paper) as well as one of ECS.
LC18 uses data from 31 climate models, including all those featured in A17. It reports three measures of ECS_hist, one of which is meant to be equivalent to the measure featured in A17. It also includes TCR and ECS values.
Because A17 doesn’t provide TCR figures, in order to calculate the ECS_hist-to-TCR ratio for that study I take them from LC18. The discussion in the latter paper indicates that there is close agreement among different sources on the models’ TCR values, so I don’t think this will bias the analysis.
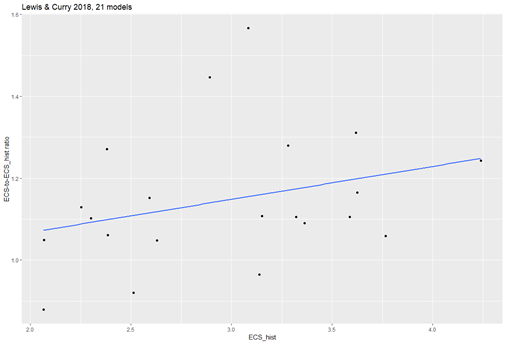
Here we go. If you take all models in LC18 and plot the ECS-to-ECS_hist ratio vs ECS_hist, well, yes, there’s an association. But not much: the correlation (r) is only 0.135.

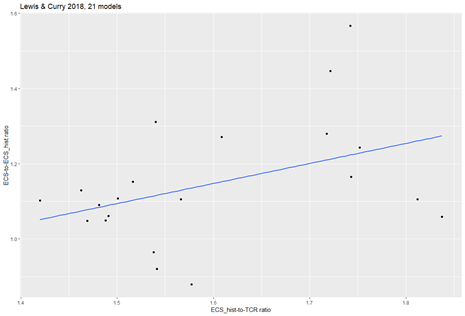
If by contrast you plotted the ECS-to-ECS_hist ratio against the ECS_hist-to-TCR ratio, you see something more. It’s a correlation of about 0.42, meaning the ECS_hist-to-TCR ratio explains 17.5% of the variance.

I wondered why A17 hadn’t reported this. It turns out, if you run the numbers on A17’s data, the opposite is true: there is no relationship between the ECS_hist-to-TCR ratio and the ECS-to-ECS_hist ratio.

But if you chart ECS_hist itself versus the ECS-to-ECS_hist ratio, there is a relationship – and it’s stronger than in LC18, though still not very (r = 0.21, p-value = 0.36).

In the above LC18 charts I used all of the paper’s models, as well as its main ECS_hist estimate (which is an average of three measures the study uses). I wondered if the different results were due simply to the use of a different method of estimating ECS_hist, or the addition of models, so I decided to compare the studies again.
Comparing apples to apples: 21 models in both studies, equivalent measure of ECS_hist
In these charts I take only the LC18 models that are also included in A17. I also take the ECS_hist measure that corresponds to A17’s measure, called ICS.1pct. Likewise, instead of taking the ECS-to-ECS_hist ratio that LC18 reports, I calculated a new one that uses only the ICS.1pct measure. In short, the comparison is as apples-to-apples as it gets.
Before we get to the charts, let’s recap:
· I use the same TCR values in both papers.
· ECS_hist values in both studies are very similar: correlation between them is 0.97.
· ECS values are even more similar: their correlation is 0.996!
A17 offers figures rounded to one decimal whereas LC18 gives the raw data. I tested this: the correlation between A17 values and pseudo-LC18 data (rounded to one decimal number) is almost the same as with the actual LC18 data. So rounding is not an issue.
With differences this small, you’d expect both papers to give essentially the same answer. Indeed, at first sight this comparison does seem to partly ‘reconcile’ the papers. In LC18, ECS_hist now has a correlation of 0.3 (p-value = 0.18).

The explanatory power of the ECS_hist-to-TCR ratio is basically the same it was when using all models (r = 0.42), though with less data it’s less statistically significant (p-value = 0.06).

One could say that, when restricting LC18 to the setup used in A17, the ECS_hist-to-TCR ratio still hast the most explanatory power, but ECS_hist by itself cannot be dismissed. Whereas in A17 there is only one explanatory variable, ECS_hist, with the ECS_hist-to-TCR ratio playing no role at all.
However, even this partial ‘reconciliation’ is not real.
Regressing against both variables
Here’s a problem: ECS_hist and the ECS_hist-to-TCR ratio are themselves correlated, and highly so (approximately, r ranges from 0.5 to 0.7). A model with a high ECS-hist-to-TCR ratio will have a high ECS_hist, and viceversa.
Obviously, if A is correlated with B and B is in turn correlated with C, probably you’ll see a correlation between A and C. But that doesn’t mean the association between A and C is real. Maybe the correlation of A and C comes about entirely from A’s relationship with B. Perhaps, holding B constant, an increase in A is not associated with an increase in C.
Multiple regression is a way to figure that out. In A17, when regressing against both ECS_hist and ECS_hist-to-TCR ratio, as you’d expect the latter plays no role (it actually has a negative regression coefficient). But what happens with LC18 is more interesting: the apparent correlation that ECS_hist had (0.3) turns out to be spurious. The regression coefficient of ECS_hist is effectively zero.
So it seems we’re back to square one. In LC18, the ECS-to-ECS_hist ratio is explained to a small degree by the ECS_hist-to-TCR ratio; ECS_hist itself plays virtually no role. In A17 it’s the opposite: ECS_hist provides some explanatory power, while the ECS_hist-to-TCR ratio has no explanatory power at all.
What’s up with the outlier dot at the top of all these charts?
The dot with the highest ECS-to-ECS_hist ratio is the CSIRO model. I ran all the numbers without it, though I will not include the charts because the post already has enough of those.
In terms of correlation, excluding CSIRO does seem to change things quite a bit: for LC18, the two measures essentially converge and now have the same correlation (0.34). p-value is about 0.14 for both.
In the case of A17, both correlations increase (ECS_hist remains much higher than the ECS_hist-to-TCR ratio, 0.39 vs 0.15). So, the story could be that in A17 it’s ECS_hist that has explanatory power, with ECS-to-ECS_hist ratio playing a very small role, whereas in LC18 both measures explain part of the ECS-to-ECS_hist ratio
But when doing regression the image becomes less clear. The ECS_hist-to-TCR ratio again has no explanatory power in A17. And in LC18, both measures retain a positive regression coefficient but they are even less statistically significant than before.
This makes sense: in LC18, the correlation that each variable had with the ECS-to-ECS_hist ratio (0.34) in fact was partly contributed by the other measure. So both ECS_hist and the ECS_hist-to-TCR ratio have some explanatory power, but much less than what you’d believe if you looked at one of them independently of the other.
If you’re wondering what happens when you run the regression using all 31 models from LC18, the picture gets clearer: ECS_hist has no explanatory power (actually a negative coefficient), whereas the ECS_hist-to-TCR ratio has a positive and statistically significant relationship with the variable we want to explain. The weak correlation that ECS_hist showed, discussed at the beginning of the article (0.135), turns out to be spurious. The result is similar if one excludes CSIRO from the list of 31 models, though in that case the ECS_hist-to-TCR ratio falls a bit short of statistical significance (p-value = 0.08).
Conclusions
The data from A17 and LC18 are extremely similar but lead to different interpretations even when using the same climate models, same TCR values, and an equivalent measure of ECS_hist. In A17, the ECS-to-ECS_hist ratio is explained weakly by ECS_hist, and not at all by the ECS_hist-to-TCR ratio; the result remains the same if you exclude the CSIRO outlier. In LC18, it’s the ECS_hist-to-TCR ratio and not ECS_hist that provides explanatory power. But if you exclude CSIRO then both measures have about the same explanatory power (which is to say almost none).
With the additional data available in LC18 (i.e. all 31 models), it’s clear that the ECS_hist-to-TCR ratio is a better explanatory variable. Even so, it explains less than 20% of the variance in the ECS-to-ECS_hist ratio. Clearly, there are other reasons why climate models show increased sensitivity over time.
Data and code
The code used for this article can be found here. The A17 data is added manually in R, so the only other thing you need is the ECStoICS.csv file from LC18.
The section on the apples-to-apples comparison is missing these two charts:
The climate sensitivity is a theory without empirical support. It is found in models because models are models of the theory but it is not found in the data. Surface temperature is not linearly responsive to atmospheric CO2 in the observational data.
Please see:
https://chaamjamal.wordpress.com/2018/05/06/ecs-equilibrium-climate-sensitivity/
Not linearly responsive to the log of atmosCO2
The question is the linear temperature response to a DOUBLING of CO2, that gets rid of the log. Please pay attention at the back !
” The ECS_hist-to-TCR ratio is simply another way of expressing how much forcing has gone into the ocean, versus how much has warmed the atmosphere.”
If ECS is based on the physically meaningless “average” of land and sea temperatures, do not expect logical results like historically constant ECS to a given forcing.
If anythng it should be < 1 , since the negative radiative Planck f/b is strongly non linear and becomes more negative "in a warming world".
The whole goon show is based on a non physical metric, you can not average the temperature of different physical media. If you do that, do not expect consistent or physically meaningful results.
The averaging of surface temperature across land and ocean is NOT physically meaningless. Surface temperature change in feedback studies represents the change in emitting temperature, not changes in heat content. Since ocean and land have broadband IR emissivities close to 1.0, they can be averaged together. This is basic stuff.
“An interpretation could be the historical temperature record cannot be used to estimate or constraint climate sensitivity. This would imply that either the historical record is too short, or the forcing it involves is too small.”
AL, the bear in the room is that climate models can never be right….
Past temps have been cooled (adjusted) down to show a faster rate of warming, when it was convenient to show we’re all going to die tomorrow….the fact that climate models duplicate that faster rate of warming….and they are embarrassingly wrong…is proof that adjusting past temps down was wrong
As long as climate models are tuned to the past…they will never be right
Judging from the scattergraphs, those are some weak correlations.
Correlations? Where…? Pure random.
I’m sorry, Alberto, really. As someone who deals with data from the outside world (true, in geology, much of that data is very, very fuzzy), I look at this kind of exercise as similar to medieval theologians discussing angels and pinheads.
Climate models don’t work very well (to be charitable) so why study parameters that are output from models? It’s not real-world data. It’s an imaginary world that (sometimes) loosely resembles the real world, after the dreaded “parameterization” and/or “tuning” has been applied. Any conclusions you might draw could potentially tell you something about the models, but not about the real world.
From Lewis and Curry cited above:
The models don’t even agree with the adjusted data.
It wouldn’t surprise me if the ECS is changing because the climate system is not time invariant. Lewis and Curry mention the possibility but there’s no indication that is reflected in the real world data.
Anyway, I fully agree with Smart Rock.
One problem with climate models is that they are generally tuned to hindcast the past (especially from 1975 to 2005) without considering multidecadal oscillations. About .2 degree C of the warming from 1975 to 2005 was from upswing of multidecadal oscillations, so climate models consider increase of greenhouse gases (and feedbacks) to have caused about.2 degree C more warming from 1975 to 2005 than I think they actually did.
And much of the warming after 1982 was a natural recovery from century-scale volcanoes El Chichon in 1982 and Mt. Pinatubo in 1991+.
Not true Allan. Your “recovery” has made it warmer thab before.
Ryan – you have NO scientific credentials – stop writing and learn something.
As a matter of interest Allan – what are yours?
Much better than your Anthony. I’d guess – care to go first?
And how do we know you are telling the truth?
Allan, you have what seems to be a misapprehension. Churlishness is no way to thank me for alerting you.
Ryan – based on your posts, I’d say you are a teenager or a young adult with NO scientific education. Here are some basics:
Global cooling occurred from ~1940 to 1977, even as fossil fuel consumption accelerated strongly. This observation DISPROVES the “runaway global warming” hypothesis. This ~37-year global cooling period was naturally-caused, and was NOT primarily driven by increasing atmospheric CO2, unless you believe (as many warmists do) that CO2 is the “demon molecule”, that can cause both global warming AND global cooling, human sacrifice, dogs and cats living together, mass hysteria…
RICHARD FEYNMAN ON THE SCIENTIFIC METHOD (1964)
https://youtu.be/0KmimDq4cSU
at 0:39/9:58: ”If it disagrees with experiment, it’s wrong.”
At 4:01/9:58: “You can always prove any definite theory wrong.”
At 6:09/9:58: “By having a vague theory, it’s possible to get either result.”
THIS IS THE “CLIMATE CHANGE” ALARMISTS’ KEY STRATEGY:
“By having a vague theory, it’s possible to get either result.” – Richard Feynman
“A theory that is not refutable by any conceivable event is non-scientific.” – Karl Popper.
The “Climate Change” hypothesis is so vague, and changes so often, that it is not falsifiable and not scientific. It should be rejected as unscientific nonsense.
The “Runaway Global Warming” hypothesis is at least falsifiable, and IT HAS BEEN ADEQUATELY FALSIFIED:
1. By the ~37-year global cooling period from ~1940 to 1977;
2. By “the Pause”, when temperature have not increased significantly since the mid-1990’s, despite increasing atmospheric CO2;
3. By the fact that sea surface temperatures have not increased significantly since ~1982, and corresponding air temperatures increased largely due to the dissipation of the cooling impact of two century-scale volcanoes in 1982 and 1991+;
4. By the fact that CO2 lags temperature by ~9 months in the modern data record, and the future cannot cause the past (in this space-time continuum).
Regards, Allan
__________________________________________________________
“EXTRAORDINARY POPULAR DELUSIONS AND THE MADNESS OF CROWDS”
Charles Mackay (1841)
https://en.wikipedia.org/…/Extraordinary_Popular…
Quotations
“Men, it has been well said, think in herds; it will be seen that they go mad in herds, while they only recover their senses slowly, and one by one.”
“Of all the offspring of Time, Error is the most ancient, and is so old and familiar an acquaintance, that Truth, when discovered, comes upon most of us like an intruder, and meets the intruder’s welcome.”
“Here are some basics:”
Are you kidding?
You make an illogical claim about volcanos then presume to lecture me by waving your arms around a bit.
Show us you’re not just making up the volcano thing.
Ryan you are being ignorant and hysterical These are the basics. The complicated stuff comes later. Grow up and learn something!
Don’t argue until you have studied the subject – and I’m giving you a huge benefit-of-the-doubt – I’m assuming you have the education and intellect to do so. The indications to date are negative.
Here is some of the proof you demanded in your childish rant – I don’t know why I bother with you.
See also Christy and McNider 2017 re the cooling effect of volcanoes.
https://wattsupwiththat.files.wordpress.com/2017/11/2017_christy_mcnider-1.pdf
The Nino34 Area Sea Surface Temperature (the blue line in the following plot), adjusted by the Sato Global Mean Optical Depth Index (for major volcanoes – the yellow line), correlates quite well with the Global UAH LT temperature four months later (the red line).
https://www.facebook.com/photo.php?fbid=1527601687317388&set=a.1012901982120697.1073741826.100002027142240&type=3&theater
It is clear from the divergence of the red line (Global UAH LT temperature) below the blue line that (Nino34 SST) that El Chichon and Pinatubo caused about 0.5C to 0.6C of global cooling that took about 5 years to fully dissipate in each case.
https://wattsupwiththat.com/2018/08/17/gaffe-down-under-final-solution-was-bad-but-so-is-climate-denier/#comment-2432402
[excerpt]
I (we) published in 2002 that the global warming crisis did not exist in reality, and that green energy schemes would not be adequate to replace fossil fuels. Both these statements are now proven to be correct, for anyone who objectively examines the evidence.
I suggest that anyone who continues to support global warming alarmism and schemes to abate fossil fuels is seriously deluded at best, and more correctly is guilty of crimes against humanity. The overwhelming evidence is that increasing atmospheric CO2 will lead to improved plant and crop growth, and any resulting warming will be mild and beneficial.
Let’s broaden the question to:
“Is GREEN extremism worse than worldwide terrorism?” and the answer again is an overwhelming YES!
Green extremism started with the banning of DDT from ~1972 to ~2002. The ban on DDT DOUBLED the number of deaths from malaria, more than half of which were children age 4 and under whose deaths peaked at almost 1 million per year – just babies for Christ’s sake – and half of these deaths were easily preventable.
Add to this the numbers of deaths due to the global warming scam and the “phony war” against increasing atmospheric CO2 and the total green death toll is in the tens of millions, similar to the number of needless deaths caused in the 20th Century by leftist icons Hitler, Stalin or Mao.
Leftist Greens are the greatest killers of our time – rivalling the death tolls of the greatest sociopathic killers of the 20th Century.
Those who fail to learn from history are condemned to repeat it. We are doing that now, killing off the elderly and the poor, thanks to criminal leftist greens and their minions.
Regrets, Allan
Wtf has DDT and Mao got to do “a natural recovery from century-scale volcanoes”?
“Ryan you are being ignorant and hysterical Grow up and learn something!
Don’t argue
your childish rant – I don’t know why I bother with you.”
” you have NO scientific credentials – stop writing and learn something.”
All because you got called out.
Btw none of those links provide the slightest substantiation for your silly claim.
Ryan – the proof your demanded is provided above.
You are a liar and a troll. From now on you do not exist.
And you are way too sensitive about your internet opinions being challenged. I couldn’t care less about whether you reply or not, nor for your egotistical rudeness, but for the record here, nothing you’ve posted has refuted my first reply.
Ryan S:
Please attempt to include some climate science
points in your comments, just to show everyone you
have some science knowledge.
I do Richard, but in this case the onus is on Mr MacRae as it was he who made the suspect postulation. The links he posted do not support it.
Rock, I agree with your comment. I had a friend who modelled rivers. He said: “If you have a sufficiently complicated model of a river you can be left with only two things you don’t understand: the model and the river.”
That sums up climate models for me, too complicated and wrong. What is the point of trying to understand them? We should be using simpler models to understand the actual system better. Furthermore, they are wrong on the basis of a very unrisky hypothesis – that the average temperature of the planet will go up. It’s just a 50/50 considering the chaotic nature of the system – on that basis they are catastrophically wrong, pathetically wrong, and clearly falsified. If they are not falsifiable they are not scientific statements.
Agree 100%. Predicting climate is very similar to predicting river meander. It looks simple to predict. Outside erodes inside accumulates
Nothing could in theory be simpler. In practice nothing is more complicated.
“In theory, there is no difference between practice and theory. In practice, there is.”
-Source unknown, though attributed to Yogi Berra. 🙂
Yogi Berra did not say many of the things
they said that he said.
Complicated models suffer from 2 problems:
1. The cannot be bug free. No technology exists to produce error free compter code on this scale.
2. Because it is complicated there is a tendency to believe it must be right because no one can prove it wrong. If we could prove it wrong then this would allow us solve point 1.
No, models work pretty well, look at how good weather models are these days – todays 7 day forecast is better than 1990’s 3 day forecast. Are they perfectly accurate? No, but that doesn’t throwing the baby out with the bath-water.
I personally don’t remember the 3 day forecasts in the 1990’s but the 3 day forecasts of today are pretty poor and 7 day forecasts are a joke. Flipping a coin is at least a 50/50 chance of being right. I can do better forecasting just looking at the radar for 3-5 days out and much better 1-2 days out.
As far as the baby in the bath water, hold the baby and toss the water as it’s too murky.
I just checked my local weather forecast. This is a copy and paste:
Scattered showers and thunderstorms. Low 69F. Winds light and variable. Chance of rain 40%. 3 to 5 inches of rain expected.
Earlier today (a few hours ago)the forecast was partly cloudy and 20% chance of showers, but the clouds were turning dark on the bottom. I predict rain.
RyanS, we’re good at weather because weather doesn’t have to accumulate accumulated energy from a tiny forcing and its incorrectly calculated feedbacks over millions of iterations way off into the future.
One of the first meme’s I heard was that we couldn’t predict climate in 10 years but we could in 100 years. Nothing could be further from the truth and that meme was designed to misdirect the truth about the models.
It succeeded. I’ll bet you believe it for example…
Is the alarmists keep telling us, climate models are not weather models.
There is no comparison between them.
Regardless, even though weather models have improved, they are so far from perfect that nobody in their right mind relies on them.
PS: Short term weather models are at least possible provided we could get enough data to feed them. The problem is that it’s impossible to get enough data to feed them.
Climate models are just impossible.
MarkW
RyanS wants us to believe that 2017-2018 era programmed “weather models” are accurate to 3-4 days in the future over a region of only 3% of the planet. And, for the most part, some of these 3-4 days predictions are somewhat accurate: temperatures will go up and down and rains will fall in some of the places that they predict. (40% chance of rain is not a very hard target to miss!)
Yet he demands we control the entire plant’s economic future, and force incredible harm on billions of innocent lives, and kill hundreds of millions by starvation and cold while living in the dark heating their food on dung-fed fires in unlit huts, based on exaggerated claims begun in 1988 using 1986-era computer models for the entire planet that predict weather 100 years into the future! 30 years later, after 92 billions in climate change programming “improvements” and “investments”, those same 1986-era computer programs fail to predict even 5 years of temperature change.
RyanS
While it is true that GCMs were developed
from short-term weather models,
the fact that weather models can “forecast”
local weather conditions a few days in advance
has nothing to do with 30 years of wrong
predictions from the climate computer games,
er … I mean climate models.
The physics of climate change physics are unknown.
Therefore any “model” is just a wild guess
— the consensus personal opinions of
government bureaucrats with science degrees.
Simpler models that are capable of approximating the behavior of subsystems would help us understand how the subsystems behave. Trying to understand the whole system is beyond our abilities at this time. Trying to do to much always ends up in nothing getting done.
The hypothesis of catastrophic anthropogenic global warming assumes a runaway process. This necessarily requires a progressive climate sensitivity to drive the models.
Unless they can MEASURE feedbacks and warming by CO2, we have nothing but useless exercises and grant money.
In a running black box system, without foreknowledge, you can’t separate the forward gain and the feedback. It’s impossible to measure feedback.
The best you can do is guess what the system would do without feedback and then calculate the feedback based on the difference between your guess and the system’s observed behavior.
For a start it would be good if they could measure in a scientifically meaningful way the elements of climate which they claim to be so important . Not models , not smearing , not proxies but measure in a way that is consider a normal and required in any decent science.
As to the high outlier-CSIRO-if this is the CSIRO research agency in Australia, well, about half the climate researchers there were supposed to be laid off a few years ago, since ‘the science was settled’ and therefore all the modelers were redundant, which was met with much wailing and gnashing of teeth. (The minister described their science and their reaction much like religion, not science).
Someone also once pointed out that CSIRO wants to enforce major legal changes to climate policy, whilst at the same time making numerous legal waivers in fine print remarks to its various climate science reports such as ‘data is uncertain and CSIRO will not be held responsible for failures in forecasts BLAH BLAH etc etc). If they say the science is uncertain in a legal sense, why is it ‘settled’ and legally enforceable in a science sense?
“about half the climate researchers there were supposed to be laid off a few years ago, since ‘the science was settled’”
Nice try, but the excuse for laying scientists off – because “the science was settled”, came from the then slimey, neo-con minister who is now head of a mining lobby group. In other words he was sacking scientists because he was idealogically opposed to the science.
I have noticed that the skeptic data, observations and logic has been so overwhelming on this site lately that alarmists like Ryan S and Nick Stokes are reduced to pointing out our mistakes instead of defending the flawed science of climate change/global warming. I am glad that both viewpoints are here and are heard. It keeps us skeptics on our toes.
How is Nick Stokes an alarmist? Because he argues for what he believes to be true, and backs it up with reasoning, data and calculations? Even if you think he is wrong, how does that make him alarmist?
What would be some examples of alarmist behavior by Nick Stokes?
I’ve never seen NS argue a point that wasn’t alarmist. Never seem him support a point that contradicted the alarmist view.
Perhaps you could give examples where he contradicted the alarmist view.
“I’ve never seen NS argue a point that wasn’t alarmist.”
What is an alarmist point? I’ve seen people try and use points in an alarmist matter, but what exactly is an alarmist point?
Phillip makes a good point but would Phillip argue the same way when skeptics are labelled deniers?
“Phillip makes a good point but would Phillip argue the same way when skeptics are labelled deniers?”
I will argue the same way for anyone who argues in good faith and makes a genuine effort to explain themselves.
Well Curry, Christy and others have been labeled deniers by Mann. I assume you’d argue against Mann in those cases?
Using data and being an alarmist are not mutually contradictory positions.
It’s how NS argues and what he chooses to argue about that makes him an alarmist.
Phillip,
Before reasonable conversation, there would need to be an accepted definition of alarmist, or alarmist behavior.
In my opinion, if someone effectively puts on blinders, looks only at one side, and their argument continues past rational loss in defense of the premise that CO2 is the primary control knob affecting fish, birds, mangroves, coral, orcas, sea level, sewage leaks, air temperature, global temperature, crime rates, and low birth weight, then they are exhibiting alarmist behavior.
What is your definition of alarmist behavior?
“What is your definition of alarmist behavior?”
Deliberately seeking to cause alarm, and doing so without justification.
What exactly is alarmist about believing that increasing levels of CO2 in the atmosphere will lead to warming?
Is everyone who believes that an alarmist?
You left out the “catastrophic” clause in you lawyerspeak. That changes everything. You know where it goes.
“You left out the “catastrophic” clause in you lawyerspeak. That changes everything. You know where it goes.”
How does that apply to Nick? Because he believes some things are happening that other people judge as catastrophic?
Nick strokes is
hopelessly bogged down
in the minutia
of tenth of a degree C.
surface temperature anomalies —
based on haphazard “measurements”
that are so inaccurate, it is possible
there was no warming since 1880,
or +1 degree C. or warming,
or perhaps +2 degrees C. of warming
since 1880 !
The majority
of our planet has no
surface thermometers,
so the numbers
for those grids
are merely made up,
by people who EXPECT
and WANT to see
global warming
… and their numbers
DO show more warming
than weather satellite and
weather balloon data
— both of which
correlate well with each other,
but not with surface “measurements”.
My climate change blog:
http://www.elOnionBloggle.Blogspot.com
Thanks Phillip,
You asked, “What exactly is alarmist about believing that increasing levels of CO2 in the atmosphere will lead to warming?”
ABSOLUTELY NOTHING….
But, what could also be considered alarmist is exaggerating (outright or through omission). Or helping others exaggerate by showing support for, or by defending, their exaggerations.
So, are you saying that all Ryan and Nick have ever done is “believe that increasing levels of CO2 in the atmosphere will lead to warming?”?
Or are you (deliberately) omitting something to make your line seem stronger?
Right, and we’re back where we started. You disagree with something he argues for, so therefore he is an alarmist.
One thing I have noticed regarding Ryan and our other alarmists.
Each and everyone of them knows what other people are thinking better than those other people.
Ryan S
Wild guess wrong predictions
of the future climate
using computer games,
have nothing to do with real science !
When climate science via hand-tuned climate models is no better than astrology or an ouija board in “predicting” the future, is anyone really surprised there are “other reasons why climate models show increased sensitivity over time”?
joelobryan
The people who make and use the models
to make average temperature predictions,
also compile the average temperature they
are predicting. This conflict of interest
means they have the power to make sure
their predictions are right.
Truth is not a left-wing value.
While climate boffins argue among themselves about arcane technicalities like Equilibrium Climate Sensitivity I look at the UAH satellite record since 1979, see http://www.drroyspencer.com/wp-content/uploads/UAH_LT_1979_thru_July_2018_v6.jpg. As alleged man-made global warming was only supposed to start from about 1950, except that it didn’t as global temperatures fell from the 1940s to the 1970s despite exponentially rising atmospheric CO2, the satellite record covers the entire span of alleged man-made global warming.
Where in the almost 40 year satellite record is there any discernible trace of man-made global warming at a slow but steady rate of at least 0.2ºC per decade as predicted by the models? I see none. All I see is a sudden step increase around the turn of the century caused by a preponderance of natural El Nino effects, then another sudden El Nino jump around 2015-16 which is now dissipating. The truth is staring us in the face.
Or: a steady rise of about 0.12C per decade, interrupted by data-noise caused by El Nino’s, volcanic activity, etc.
Eye of the beholder.
Not even 0.2C more like 0.15C per decade. If the pace doesn’t accelerate it will meet the Paris agreement on its own. No need for carbon taxes or any CO2 regulation of any kind.
Climate graphs are up for laughs
With wiggles full of giggles
When they up they are up
When they are down they are down
With the bits in the middle an obvious fiddle
And statistical arts just like f#*rts
So invoke the muse if you wish to amuse
As the world goes to hell in a cart.
(sarc.
“We use models to make parameters to feed into our models, and the result is always worse than previously models showed, and so the settled science need more research. Send more money.”
classic GIGO
GCM simulations do not do CS or ECS.
The only sensitivity to CO2 in GCMs, consist only when considering the whole
spectrum of the simulations.
It consist as only a delta t, where “t” stands for time.
Like how fast a full simulation will ran.
Meaning a CO2 knob simply speeds up a simulation in accordance to its “power”.
A simple fast-forward button like feature.
The CS or ECS definition has nothing to do with time or delta t.
Further more, realistically considering GCM simulations, the concept of CO2
doubling is an intrapolation as most simulations do not even get at that point,
especially the more realistic ones.
cheers
Simple answer: there are no climatologists who are expert statisticians. All the models are trying to beat data out of the error.
Indeed in fact they keep such people well out of ‘research ‘ even the CRU found that .
Alberto,
Interesting, but your attempts at correlation really do not address the question you pose in your title. In fact it is not clear to me whether you are trying to answer “por que” or “para que”. One of the reasons that a Gregory plot (net flux vs temperature for a constant forcing) shows curvature is that the spatially aggregated Cloud Radiative Effect (CRE) shows a curvature in the large majority of AOGCMs. The reason the CRE shows curvature is the evolution of the surface temperature pattern of warming in the particular AOGCM, which changes the spatially-weighted feedback as time progresses. While this is fairly solidly supported as ONE of the explanations, we still cannot rule out entirely the presence of numerical artifacts in the calculation of CRE as a possible contributing source of error. It is also a fact that in none of the AOGGCMs does this evolution correspond well to the historical pattern of warming. Imposition of the historic observed pattern by prescription results in a lower estimate of climate sensitivity, but that is not particularly relevant to your question. What is relevant is that each model generates its own unique (or, more correctly, uniquely wrong) warming pattern – which controls the shape of the Gregory plot, which ultimately controls the ratio of ECS-to-ECS_hist for that AOGCM.
While there are a number of relatively simple methods for defining model attributes which allow you to predict TCR, ECS_historic and ECS for any given AOGCM, these methods ALL entail deriving model attributes which capture the curvature of the Gregory plot, and then applying normal rules of convolution under the assumption that the system behaves as LTI. You cannot predict this curvature ab initio. You can infer that high curvature implies a high ECS and a high ratio of ECS to ECS_historic, but even this is a weak relationship, as you have found. In reality, you do little better in explaining the spread than you do with a constant mean and variance model.
Your shotgun needs a choke.
As time slips by the ration of alarm to action changes as people, look up into the sky and find its not falling . So to balance is out the approach is to increase the level of alarm, no easy task given the existing high levels .The trouble is this feeds into a positive feedback loop which they seek to resolve through more alarm and so pack through the loop again .
The reason for this is their inability to change , partly through general inability, third rate academics are more than welcome in the area as long as preach the dogma , and that in regards to grant funding etc , it is an approach ,that along with playing ‘find the lady ‘, has worked for years.
Therefore, the failure to advance the science or to get any real action done is nothing compared to the ability to keep the gravy train on track for those ridding it who otherwise would be on their feet if not their arse .
“Why does climate sensitivity increase over time in models?”
1) Incompetence
2) Models don’t reflect reality
3) Because they keep having to make the future warmer to accommodate for the lack of warming that’s occurred so far.
I have to admit I don’t understand this article,
or any purpose in writing it.
There are no climate change models.
Climate change physics must be well understood
before the climate change process can be modeled.
The physics is not understood.
Therefore it is no surprise the so-called “models”
make very wrong predictions.
They are garbage models — known as “failed
prototypes” in polite company.
There is no logical reason to analyze them,
and every reason to dismiss them.
And go back to the study of climate change physics,
which must be something different than the
“physics” underlying the current “models”
In reality, the current “models”
are just personal opinions,
disguised as real science
using complexity
and high level math.
They could have been written on the backs
of envelopes in crayon — they end up speculating
that CO2 controls the average temperature, and
the ECS is about 3.0 degrees C.
Since their predictions are far from reality,
the models are NOT models of the climate change
process on this planet — they model
only the imaginary “process”
in the faulty minds
of the CO2 is Evil people
who designed and programmed them.
My climate change blog:
http://www.elOnionBloggle.Blogspot.com
Has anyone ran these high ECS models for the glacial/interglacial transition? I think that would be comical.
How about IPCC’s definition of CO2 residence (in the atmosphere)?
As the word is commonly understood, if a person lives, say, in Adelaide for 10 years and then moves to Canberra, his residence in Adelaide will be 10 years. Likewise for a molecule of CO2: if an aerial CO2 is absorbed into a plant or the ocean, its residence in the atmosphere ceases.
Not so for the IPCC and its models.
If an aerial molecule of CO2 is absorbed into a plant or into the ocean, but “replaced” by another molecule of CO2 from plant decay or ocean outgassing, the residence of CO2 molecule in the atmosphere continues, according to IPCC. Meaning, if a person moves from Adelaide to Canberra, but somebody else from, say, Sydney, buys his Adelaide apartment and moves in, the residence continues.
Which means that according to IPCC the residence of CO2 in the atmosphere continues and will continue as long as aerial concentration of CO2 is growing from e.g. ocean outgassing. Therefore, successive reports of IPCC will claim an ever increasing residence of CO2 in the atmosphere – which obviously increases climate sensitivity when incorporated into IPCC-approved climate models.
Alberto
An excellent article; congratulations. I can shed some light on one or two issues.
First, the correlation of ECS/ECS_Hist with ECS_Hist is certainly weak for the 31 models analysed in Lewis and Curry 2018 (LC18). We said in the paper that the ratio “should vary positively with ECS_Hist”, citing Armour 17 (A17), as his paper gave a reasonable theoretical argument as to why it should do so. However, we went on to say “a linear fit has little explanatory power”. The correlation as slightly positive, at 0.13, but insignificant.
Secondly, I agree that your proposal of using the ECS_Hist/TCR ratio as a predictor for ECS/ECS_HIst gives a substantially better correlation; 0.42 for the 31 LC18 models, as you say. If one restricts the analysis to the 21 models used in A17, but using the LC18 data the correlation is actually stronger, at 0.52, falling back to 0.43 if the A17 measure of ECS_Hist (using data from years 85-115 of the 1pctCO2 simulations rather than the mean of three estimates) is used. But when A17 ECS_Hist values are substituted for the LC18 ones, the correlation drops to zero, as you say.
You correctly identify CSIRO-Mk3-6-0 as the main outlier model. A17 obtains a far lower ECS_Hist for that model , using data from years 85-115 of the 1pctCO2 simulations, (2.6°C) than I do on the same basis (3.08 K).
The reason is that Armour uses an unsatisfactory method of estimating the forcing for a doubling of preindustrial CO2 concentration (F_2xCO2). He takes half the y-intercept from regressing top-of-atmosphere radiative imbalance on surface temperature over years 1-5, using annual global mean changes from preindustrial values in the model’s simulation in which CO2 concentration is abruptly quadrupled at the start and held steady (abrupt4xCO2).
Point 1) in section 7f of LC18 explains why the A17 method of estimating F_2xCO2 is unsatisfactory. The basic reason is that the year one data point does not reflect a fully adjusted atmospheric state, which is required for valid estimation of F_2xCO2. Reflecting that, the year one point tends to lie above the regression line obtained when year one data is excluded, whether regressing over years 2-5, 2-10, 2-20 or 2-50. In CSIRO-Mk3-6-0 the year one point lies unusually far above where the fit from regressing without the year one point included predicts. See top RH panel in Figure 1 of Andrews et al 2012 (doi:10.1029/2012GL051607).
A17’s method of regressing over years 1-5 of the abrupt4xCO2 simulation gives an estimate for F_2xCO2 in CSIRO-Mk3-6-0 of 4.15 W/m^2. I do likewise but regressing over years 2-10, which produces an estimate of 3.16 W/m^2. Regressing over years 2-20 gives a marginally lower estimate. The IPCC AR5 report gives (WG1 Table 9.5) an estimate of 3.1 W/m^2 for F_2xCO2 in CSIRO-Mk3-6-0 (it also gives an alternative estimate of 2.6 Wm−2, but that is unrealistically low).
If I substitute the A17 CSIRO-Mk3-6-0 4.2 W/m^2 F_2xCO2 value for my 3.16, my 3.08°C ECS_Hist estimate falls to 2.63°C, in line with the A17 value, and the 0.43 correlation of ECS/ECS_Hist with ECS_Hist/TCR becomes very low: 0.08.
So, to conclude this rather lengthy comment, I think your suggestion of using ECS_Hist/TCR rather than ECS_Hist as a predictor of ECS/ECS_Hist in CMIP5 models is a good one, and I recommend that you ignore the unsatisfactory ECS_Hist values given in A17 and everything based on them.
Thanks! I simply ran a correlation between your ECS_hist values and those in A17, noticed it was very close to 1 and didn’t look at the differences model by model; for most models the ECS_hist values in both papers are very close but in CSIRO the difference is pretty big. The fact that the two other methods in LC18 give results similar to the ICS.1pct value (in fact higher) strengthens the case that the A17 figure is wrong.
So if using A17 values one should definitely exclude CSIRO. In LC18 it’s less clear whether the model should be excluded as it’s still an outlier, but when using all the data (i.e. the 31 models) it doesn’t matter much whether it’s included or not.
Also, looking at the rest of the models, the biggest differences other than CSIRO are in GFDL-CM3 (the LC18 value is 9% higher than A17’s) and HadGEM2ES (11.5% higher). In both cases, in the Andrews plot the first year is well above the trend line.
For once it would be nice to eschew drawing lines through such noisy data. Both sides do that and the creates arguments based on that line that at best is useless. If we are won’t to do that then at least draw the band and see if any causal argument survives.
We take fluctuations of a physical variable, mind you not the variable itself and draw trend lines through the noisy data and if it falls our way we argue, be snide or whatever. This habit then we parlay into parameters, which are going to be even fuzzier.
I must be missing something here.
1) I’m not aware of evidence for the initial premise that ECS increases over time.
2) Lewis and Curry were demonstrating that ECS of the real climate system based upon observations is lower than ECS of models. That’s an apples-to-apples comparison, in which the calculation of ECS from observations includes the storage of some of the “extra energy” in the ocean, thus reducing the rate of rise of surface temperature. As such, L&C were not calculating TCR and finding it to be lower than models ECS, which would be comparing apples to oranges. (Of course, TCR is always lower than ECS, because it takes a long time for the oceans to fully warm).
1) There is no evidence of that in the real world (admittedly ocean heat content data doesn’t go back in time far enough to make a strong claim either way). The evidence is regarding climate models.
2) The point of the article is not comparing LC18 results with the models (it’s true that the comparison in the paper is apples to apples, as the authors use ECS_hist). The point is figuring out why, in the models, ECS > ECS_hist.