Guest Post by Willis Eschenbach
OK, this post has ended up having two parts, because as usual, I got side-tractored while looking at the first part. It’s the problem with science, too many interesting trails leading off the main highway …
Part The First
I wanted to point out an overlooked part of Dr. James Hansen’s 1988 oral testimony to the US Senate. At the time Dr. Hansen was the Director of GISS, the Goddard Institute of Space Studies. He told the Congresspersonages, or whatever the modern politically correct term is for that class of Politicritters, the following:
The observed warming during the past 30 years, which is the period when we have accurate measurements of atmospheric composition, is shown by the heavy black line in this graph. The warming is almost 0.4 degrees Centigrade by 1987 relative to climatology, which is defined as the 30 year mean, 1950 to 1980 and, in fact, the warming is more than 0.4 degrees Centigrade in 1988. The probability of a chance warming of that magnitude is about 1 percent. So, with 99 percent confidence we can state that the warming during this time period is a real warming trend.
Here is his accompanying graphic …

Now, I am either cursed or blessed with what I call a “nose for bad numbers”. It is a curious talent that I ascribe inter alia to using a slide rule when I was growing up. A slide rule has no decimal point. So if an answer from the slide rule is say 3141, you have to estimate the answer in order to decide if it means 314.1, or 3.141, or .003141, or 31,410. After doing this for years, I developed an innate sense about whether a result seems reasonable or not.
So when I saw Hansen’s claim above, I thought “Nope. Bad numbers”. And when I looked deeper … worse numbers.
First thing I did was to see if I could replicate Hansens’ results. Unfortunately, he was using the old GISS temperature record, made before they were as adjusted as they are today. His statement was that “The warming is almost 0.4 degrees Centigrade by 1987“. But in the modern GISS data, I found slightly more warming, 0.5°C.
OK, fair enough. So I went and digitized the dataset above so I could use Dr.Hansen’s data, and it turns out that his “almost 0.4 degrees Centigrade” increase by 1987″ is actually 0.32°C. You can see it in the graphic above. Hmmm … Dr. Hansen’s alarmism is unquenchable. Also, note that Dr. Hansen has spliced into the graphic and discussed the 1988 “annual” average even though at the time he only had a few months of 1988 data … bad scientist, no cookies. Comparisons gotta be apples to apples.
Next, his claim is that there is only one chance in a hundred that the 1987 warmth is a random result. That means his 1987 temperature should be 2.6 standard deviations warmer than the 1951-1980 mean. But once again, Dr. Hansen is exaggerating, although this time only slightly—it’s only 2.5 standard deviations away from the mean, not 2.6.
However, that’s not the real problem. In common with most climate-related temperature datasets, the GISS temperature dataset Hansen used has a high “Hurst Exponent”. This means that the GISS temperature dataset will be what has been called “naturally trendy”. In such datasets, large swings are more common than in purely random datasets.
How much more common? Well, we can actually test that. He’s comparing the 30-year “climatology” period 1951-1980 to the year 1987. So what I did was the exact same thing, but starting in different years, e.g. comparing the thirty-year period 1901-1930 to the year 1937, seeing how unusual that result is, and so on.
When we do that for all possible years of the GISS 1988 dataset, we find that being 2.5 standard deviations away from the climatological mean is not uncommon at all, occurring about one year out of fourteen.
And if we do the same analysis on the full GISS dataset up until today, we find it’s even more common. It has occurred in the historical record about one year out of seven. So Hansen’s “one percent chance” that the 1988 temperature was unusual was actually a fourteen percent chance … more alarmist misrepresentation, which is no surprise considering the source.
Conclusions the First
Regarding the warmth of 1987, which was 2.5 standard deviations warmer than the 30-year climatology average, Hansen claimed that “The probability of a chance warming of that magnitude is about 1 percent.”
In actuality, this kind of warming occurred in the record that he used about once every fourteen years or so … and it occurs in the modern GISS record about once every seven years. So the probability of a chance warming of that magnitude in the GISS temperature record is not one percent, it is between seven and fourteen percent … which means that it is not unusual in any way.
Part The Second
In the process of researching the first part of this post, I realized why there is so much debate about whether Hansen’s predictions were right or wrong. The problem is that we’re living in what the most imaginative and talented cartoonist yclept “Josh” calls “The Adjustocene” …

The problem is that Dr. James Hansen is not only the guy who made the 1988 alarmist predictions. He’s also the guy who has been in charge of the GISS temperature record that he has long been hoping would make his prediction come true.
So … here are the changes between the version of the GISS temperature record that Hansen used in 1988, and the 2018 version of the GISS temperature record.

(GISS 2018 data available here. )
Gotta say, those are some significant changes. In the old GISS record (red), 1920 to 1950 were much warmer than in the new record. As a result, in the old record temperatures cooled pretty radically from about 1940 to 1970 … but in the new record that’s all gone.
And things don’t get any better when we add another modern record to the mix. Here’s the Hadley Center’s HadCRUT global average temperature, shown in blue …

Note that HadCRUT (blue) shows the same drop in temperature 1940-1970 that we see in the 1988 version of the GISS temperature record (red). More to the current point, the post-1988 divergence between the HadCRUT and the GISS record is enough to rule out any possibility of determining whether Hansen was right or wrong. The overall trend in the GISS 2018 data is about 40% larger than the trend in the HadCRUT data, so you can get the answer you wish by simply picking the right dataset.
Conclusions the Second
Depending on the dataset chosen, someone can show that Dr. Hansen’s predictions either did or did not come true … it’s the perfect Schrodinger’s Cat of predictions.
Finally, as an aside, just what is an “Institute of Space Studies” doing studying the climate? I’ve heard of “mission creep” before, but that’s more than mission creep, that is extra-terrestrial movement. Don’t know if the Goddard folks have noticed, but there is no climate in space … how about if they go back to, you know, studying the myriad of fascinating things that happen in space, and leave studying the climate to less alarmist folk?
Best regards to all,
w.
Short Version Of My Usual Request:
QUOTE THE EXACT WORDS YOU ARE DISCUSSING.
Digitized Hansen Data from Figure 1:
Year, Anom
1880, -0.403
1881, -0.366
1882, -0.427
1883, -0.464
1884, -0.729
1885, -0.541
1886, -0.461
1887, -0.547
1888, -0.388
1889, -0.184
1890, -0.38
1891, -0.438
1892, -0.44
1893, -0.481
1894, -0.382
1895, -0.408
1896, -0.274
1897, -0.177
1898, -0.38
1899, -0.223
1900, -0.025
1901, -0.086
1902, -0.282
1903, -0.357
1904, -0.493
1905, -0.254
1906, -0.175
1907, -0.45
1908, -0.317
1909, -0.334
1910, -0.313
1911, -0.289
1912, -0.316
1913, -0.254
1914, -0.053
1915, -0.009
1916, -0.258
1917, -0.474
1918, -0.363
1919, -0.197
1920, -0.154
1921, -0.079
1922, -0.143
1923, -0.128
1924, -0.119
1925, -0.097
1926, 0.133
1927, -0.006
1928, 0.066
1929, -0.165
1930, -0.002
1931, 0.085
1932, 0.049
1933, -0.158
1934, 0.047
1935, -0.016
1936, 0.055
1937, 0.17
1938, 0.188
1939, 0.052
1940, 0.111
1941, 0.126
1942, 0.094
1943, 0.034
1944, 0.108
1945, -0.027
1946, 0.035
1947, 0.152
1948, 0.034
1949, -0.018
1950, -0.136
1951, 0.02
1952, 0.071
1953, 0.2
1954, -0.028
1955, -0.069
1956, -0.184
1957, 0.094
1958, 0.113
1959, 0.061
1960, 0.006
1961, 0.077
1962, 0.027
1963, 0.022
1964, -0.264
1965, -0.174
1966, -0.09
1967, -0.024
1968, -0.128
1969, 0.028
1970, 0.034
1971, -0.117
1972, -0.077
1973, 0.168
1974, -0.09
1975, -0.039
1976, -0.235
1977, 0.164
1978, 0.1
1979, 0.131
1980, 0.267
1981, 0.359
1982, 0.058
1983, 0.305
1984, 0.096
1985, 0.053
1986, 0.173
1987, 0.325
1988, 0.562 (five months only)
Nice, careful analysis, Willis. Love the Josh cartoon! The Climate Alarmists have been political from the get-go. And very successful at it, for many years. Starting to wear thin, now that it’s more obvious that the gloom ‘n’ doom stuff just ain’t happening…..
Starting to wear thin?
Yeah, and the ocean is getting a little wet.
Quoting Willis:
“Finally, as an aside, just what is an “Institute of Space Studies” doing studying the climate? I’ve heard of “mission creep” before, but that’s more than mission creep, that is extra-terrestrial movement. Don’t know if the Goddard folks have noticed, but there is no climate in space … how about if they go back to, you know, studying the myriad of fascinating things that happen in space, and leave studying the climate to less alarmist folk?”
The original mission for GISS was substantially changed in the 1980’s AFTER DR. Hansen became Director for GISS, to greatly allow for increased weather/climate research that was more into global warming issues and less for space studies of other planets and lunar atmospheres.
The interesting thing is not that Hansen’s ‘detection’ science was rubbish — that was known at the time, and everyone, including the authors of the IPCC detection chapter (Wigley, Barnett), publicly said so at the time.
See:
No, what is interesting is how that did not matter. At the very beginning of the climate policy push, already the science did not matter. More important for the rest of us outside the USA was what happened today 30 years ago, when the Toronto conference statement was released, opening with:
At that meeting John Houghton and John Zillman from the IPCC protested at its outrageous claims. That did not matter. The science never mattered. The funding for science kept coming. The science did not matter. Why? And what does this mean about the role of science in society?
The dictatorship of the proletariat Failed so they try other ways and means. Here they try The dictatorship of Nature.
Is the proletariat the working class or the welfare class? The working class elected Trump. The welfare class is caught in Pelosi’s safety net.
“Humanity is conducting an unintended, uncontrolled, globally pervasive experiment whose ultimate consequences could be second only to a global nuclear war.” If you want to rule the Humanity, with the Dictatorship of Nature, this is what we all have to believe. Stalin once said “ Ideas are more powerful than guns” I think he is right so be careful what ideas you let into our minds?
“Humanity is conducting an unintended, uncontrolled, globally pervasive experiment whose ultimate consequences could be second only to a global nuclear war.”
It’s called ‘Socialism’ and ‘renewable energy;
Especially if the people with wacky ideas have guns.
To the the post modern New Left, the role of science in society is to support the Revolution to bring about the New World Order.
Politically incorrect conclusions will not get future funding.
Politically incorrect science will not get funding either.
“At that meeting John Houghton and John Zillman from the IPCC protested at its outrageous claims” – but subsequently jumped onboard….
Houghton soon got on board with Hansen.
“everyone, including the authors of the IPCC detection chapter (Wigley, Barnett), publicly said so at the time”
What did they say? No quotes are visible.
I would like to see the raw data record chart against the current and Hansen’s 1988 GISS record.
I love comparing the raw oceans and land data to the adjusted. Raw shows more warming.
Alley
When government bureaucrats
REDUCE the average temperature
in the past,
and do NOT REDUCE
today’s average temperature
by the same amount,
then the net result
is MORE GLOBAL WARMING
from the past (reduced) to today (not reduced).
Do you understand that, Alley?
Probably one-third of the “warming”
since 1880 was caused by “adjustments”
to raw data.
Richard, when scientists INCREASE the ocean temps of the past, the net result is less warming.
Do you even understand that, “Richard”? Probably 1/3 of the “cooling” since 1880 was caused by “adjustments” to raw data.
Why do you even bother to pretend to know how temperature has been adjusted?
Alley,
I have read Karl’s paper. He adjusted the temperatures of the recent, cutting-edge technology of the Argos floats upward, to match the poor quality ship water-intake temperatures so that he could claim there had been no pause in temperature increase. You should get out and read more.
Clyde,
You should read more carefully. Karl’s paper had nothing to do with Argo floats.
Nick,
From the paper: “… the data are sea surface temperature (SST) observations taken primarily by thousands of commercial ships and drifting surface buoys.”
It is not so much a matter of not reading carefully as it is not remembering the details after three years. So, you are right that the drifting and moored buoys used are not a part of the Argo network.
But, your talent for nit picking to create a diversion from the essence of the claim is what earns you so many negative votes. You do not win an argument or gain respect from red herrings and straw men.
You might have just said “The Argo network was not a part of the floating and moored buoy data that Karl analyzed.” But, that would have implied that my claim was essentially correct with regard to how Karl et al. adjusted the SSTs. Instead, you attempted to make me look like I didn’t know what I was talking about. You have instead, damaged your credibility by making people realize that you will do anything to win an argument, even if truth is not served.
“is what earns you so many negative votes”
I’m trying to get ahead of Steven Mosher. My fear is that I’ll be on -999 when WUWT pulls the plug on the scheme 🙁
Nick Stokes, the content of your remarks most times is very good, worth reading. But the position you take is not always understood. Nevertheless, you keep us sharp and that is why we need people like you.
But it would be good to hear from you when you have doubts on something on ‘the other side’. That would make the discussion more open, more balanced (from your side) and with less emotions (by the readers here). There is enough we don’t know about weather and climate, let’s be open about that. In fact, we don’t know that much. And the search for truth is an interesting one.
By the good information you give and by keeping everyone sharp, you are doing well. But why not ‘a bit more two-sided’?
Wim,
I generally try to stick to facts rather than opinion – I don’t always succeed, but I try. If the facts are right, they generally don’t need my affirmation – I speak up when I think they are wrong. But sometimes I do need to speak up in favour, and then I do. Recent example here.
Nick, I know you generally stick to facts rather than opinion. But by the choice of facts that you are opposing to, you seem to express an opinion as well. And that opinion seems (!) to be that ‘the other side’ is doing everything well, big mistakes don’t need to be criticized and ‘on this side/site’ everyone is doing wrong and even small errors need to be corrected. Which might not be what you are aiming to. It might be that you are trying to correct errors on both sides (even big ones) but that we don’t see that or hear that, at least not on this side/site.
A personal note from my side. It seems that everyone may make ‘alarm’, but never needs to apologize when he/she was doing completely wrong. I am not talking about you, I just notice that no ‘green person’ or ‘alarmist’ ever makes excuses for the damage he/she makes. I am worried about that. It is good to know that someone is able to be open about main mistakes that have been made in the past or about the position someone was taking in. Here you are mainly correcting mistakes or possible mistakes that are made by people on this site. Which is good, but possibly only half of the work that should be done.
My personal position – I was clear about that here https://wattsupwiththat.com/2015/11/29/ipcc-science-ipcc-government/ – is that the IPCC is not a scientific institute but a government organization. The IPCC is an organization that never accepted the scientific method (to find the truth) but instead used ‘its own rules’ to promote a certain (government) opinion, trying to reach a certain ‘government goal’. Which brought that institute far from the science that we need to understand weather and climate, which was (and is) at the detriment of society itself. After that government trick, all people that were paid by governmental organizations (also universities) needed to speak ‘government (IPCC) language’. At the detriment of science. Now, when the real independence of universities and research institutes is gone, large corrections for the points of view as expressed /or NOT expressed by scientific groups and for their kind of science have to be made. We need (your) corrections for those ‘big mistakes’ as well.
OK, Nick. I’ll have to give you a +point for a sense of humor.
“I have read Karl’s paper. He adjusted the temperatures of the recent, cutting-edge technology of the Argos floats upward, to match the poor quality ship water-intake temperatures so that he could claim there had been no pause in temperature increase. You should get out and read more.”
Clyde:
Ships have been found to overread by 0.12C as compared to buoys.
Now because buoys are increasing in number vs ships then there has to be a correction made to either the ships or the buoys, else the trend will be falsely altered via that introduced bias of changing relative numbers.
It doesn’t matter to the trend which way you do it. Buoys up or ships down.
Not to do with “cutting-edge” buoy readings being adjusted to claim anything.
Karl found that this had introduced that bias during the “Hiatus” period (an artifact affecting the trend that was not physical).
Given that there are more ships readings than buoys they applied the 0.12C to the buoys
Same result would have been had if the ships had been adjusted down by 0.12C.
If you don’t correct (because of increasing buoy observations vs ships) the temperature gradually slides from ship temp to buoy temp weighting, which is 0.12°C cooler. That is a falsely introduced bias to the trend, which is what Karl et al 2015 revealed.
Anthony,
I perfectly understand that the offset had to be adjusted. But, only in climatology would someone get away with adjusting high-quality data to agree with inferior quality data! The increasing number of buoys is a weak excuse in these days of high-speed computers. Start the adjustment run on Friday night before going home for the weekend, or borrow a computer from someone taking their annual 2-3 week vacation. It isn’t like you have to hire a temporary bunch of monks to erase parchment and scribe the new numbers!
I does make a difference whether the ship intakes are adjusted down or the buoys are adjusted up. By adjusting the buoy temps up, it reinforces the claim that there was no ‘pause’ and that the oceans are warming more than they probably are.
“I does make a difference whether the ship intakes are adjusted down or the buoys are adjusted up.”
It makes absolutely no difference. The adjustments are only done in the context of calculating an anomaly. Suppose instead of adding 0.12C to buoys, you subtract it from ships. Then you add 0.12C to everything. The result is the same as adding to buoys. What does the effect of that last have on anomalies? None at all, because you add the same to the temperature and to the mean that you subtract. So arithmetically there is no difference.
It seems to have some kind of symbolism for some people. I suspect that is mixed with arithmetical misunderstanding. But there is a simple practical reason for adjusting buoys. The records are a lot shorter. If you adjust ships, you have to go back to 1900’s. And that affects a much greater number of places where the data is used and has been written down.
I believe that the ‘raw’ data no longer exists for either GISS or HadCRUT.
Nice beliefs. They exist.
Can you provide a link to where they can be accessed by the public?
Since the mid twentieth century warming was nearly the same as the late twentieth century warming, that presents a big problem for the warmistas. link Hansen had to have known that. It should have been kinda obvious to him even without the application of statistical analysis. (Yes, I realize that the century wasn’t over yet when he testified before Congress.)
Side-tractored? Remember WEillis, autocorrect is your worst enema.
I like “tractored”, especially when travelling along “trails leading off the main highway”.
Never mind Willis, at least it was a ‘Green’ tractor
Deere me!
I think that was deliberate….
Anyone who knows “yclept” likely uses “side-tractored” humorously. Thanks for both.
Yup. Willis even says “could care less” when he means “couldn’t care less”.
He was slide-tractored too 🙂
Yclept is a Haitian rapper
Yes, as some suspected, “side-tractored” was indeed deliberate. I consider it one of my better malapropisms. It may be related to the fact that I learned to drive at a tender age on our Ford farm tractor, which had no power steering of course. It was definitely strong-minded about following ruts in lieu of the instructions of the skinny-armed ten-year-old behind the steering wheel …
w.
Very effective. Suggests being dragged off track, rather than simply wandering off.
Does this also mean that you have HEARING PROBLEMS from said same tractor ?
“…side tractored…”… That’s a phrase my Dad would have used, and maybe even did. He had me believing for years that disconhookeded was a real word.
Red94ViperRT10
“disconhookeded”
You’re claiming it’s not a real word?!
MOD, report this man to his father immediately!
So, twice then?
I agree that 2 is 100% different to 1.
I agree that Hansen was biased in his presentation.
But it wasn’t as implausible in the ’80s as it is now.
We should all beware of hindsight when making judgements.
So therefore the precautionary principal still applies.
However as warming is not according to the models of climate catastrophe, we
need not take unworkable and uneconomic precautions for something that may be benign or in fact, beneficial.
The Precautionary Principle is a horrible rule of thumb … see my post “Climate, Caution, and Precaution” for a discussion of its faults.
w.
Even more worser. L’Hopital’s rule on operations with zero and infinity show that chance of occurence approaching zero x consequence (end of world as we know it) yields zero risk.
The Precautionary Principle: “Do not stand up, lest you fall down!”
Fortunately, early man ignored that one…
BTW Willis – great post!
Best, Allan
But it was, because assuming a small sample of new data is outside normal is dangerous. The problem might easily be that your sample is simply too small or unrepresentative or that there is no normal data set with normal distribution.
30 years seems like an incredibly small sample of data to use for something like climate, particularly using one averaged figure that is likely to be pretty inaccurate and meaningless.
M Courtney said “But it wasn’t as implausible in the ’80s as it is now.
We should all beware of hindsight when making judgements” I agree, Hansen did take that into account. The fox (Hansen), was watching the hen house, (GISS Data ) and we got the Adjustocene.
M Courtney
Thanks, M, but at the time Hansen gave his presentation, that situation of warming had already occurred in 7% of the years of his record … no hindsight involved, he just didn’t look.
w.
Overly charitable of you to say he didn’t look, isn’t it, Wiillis? If he didn’t look, then we need to conclude that he made up the 1% claim out of whole cloth. But it seems far more likely that he was well aware of his deception, just as 0.32 was nearly 0.4, and a few months was sufficient to estimate the whole year.
of course I’m engaging in crazy conspiracy theory here. After all it’s not as if he predicted the most likely day for a heat wave, disabled the air conditioning, or left the windows open prior to the hearings to ensure that the room was stiflingly hot, or something. Shame on me.
Actually, there is no evidence at all that Hansen did any of that.
Senator Wirth is a figment of someone’s imagination? I don’t imagine that Hansen personally did the dirty deeds, but he was almost certainly aware of them and was therefore a party to them.
No one has mentioned that from 1977-1987, according to the anomaly charted values, the globe warmed 0.5C. That’s a rate of 5 C per century. So 30 years later we should already be up more than 2 more due to the baked in warming and all the additional CO2 that was emitted above even Hansen’s worst case scenario. What’s (not) happening here? Global warming seems awfully non-linear.
“But it wasn’t as implausible in the ’80s as it is now.”
I disagree. It was perfectly well-known that temperature time series are strongly autocorrelated and that probabilities based on normal distributions (=independent data points) will be way off. Hansen undoubtedly knew this. Modern “climate scientists” know this. Do they care? No.
@Mike Courtney July 1, 2018 12:51 am you say, “…So, twice then? I agree that 2 is 100% different to 1…”. But you’re making a comparison Willis never made. “…[Hansen’s] claim is that there is only one chance in a hundred that the 1987 warmth is a random result…” So the valid comparison is 2 out of 30, or 7%, vs. 1 out of 100, or 1%. Using your strawman statistics, Hansen is 700% wrong!
Red94ViperRT10:
You demonstrate that M Courtney was right when he wrote,
“We should all beware of hindsight when making judgements.”
You attribute his post which said that to “Mike Courtney”, but M Courtney was christened Matthew (not Mike), and those who know him call him Matt (not Mike), and he calls me Pater.
Paraphrasing his comment, I say “We should all beware of our unwarranted assumptions when making judgements.”
Richard
Its raining over here in Devon,
The MET office statistics page was checked yesterday (actually 6.5 hours ago as I didnt switch off till 0130 hrs), “10 % chance of rain through until mid-day”.
today it says the same , 10% chance of rain and jumps to 22% chance of rain at noon. The statistics were absolutely correct, A 10% value was proven right, it is raining, whats even better is the now blanket of yellow crayon from end to end across the whole south west of official thunderstorm warning
The only problem with this is that folks like to think 10% means its not going to happen and that the MET office looks further ahead than a couple of hours.
Gut feel seems to be far better at reality than statistics ever will be !
Gee, I thought 10% chance of rain meant ‘will rain in 10% of the area’, or ‘will rain everywhere for 10% of the time period’…
Or there is a 10% chance there will be rain somewhere in the area. In our case (USA) over the last 50 years the areas have gotten larger and, thus, the forecasts more accurate.
Most statistical models that produce a probability of precipitation forecast calculate the probability that it will rain At a single point in a given time frame
As a practical matter, that is not very useful. I want to know if I need an umbrella, not it those in the next county need an umbrella!
When looking at the bad things done in climate science, some skeptics can imply that ‘consensus scientists’ are self-serving and dishonest. It’s not like that; ‘they believe in‘ what they do. The problems in climate science are part of a more general problem in modern science. Mission failure. Many scientists, perhaps most, are careerists with no great commitment to a wider truth. For them, ‘truth’ is what they can first get themselves, then the rest of us, to believe. A game played with numbers. I have little doubt in my head that Mann regarded the statistical tricks he used to create the Hockey Stick from 3 tree rings as valid. Andrew Gelman, tells the long tale of how so much got so bad. The result of this mission failure is a replication crisis in science. One big cause of bad science being far too many ‘researcher degrees of freedom‘. This was once about cherry-picking, putting undue emphasis on small data sets, claiming significance where it isn’t, … mostly bad statistics. The climate saga added treating ‘models as data‘, not reporting what the actual model is, etc. Bad modeling. That’s a whole new dimension to the mis-science of ‘researcher degrees of freedom‘. When scientists’ methods allow them so many research degrees of freedom; they must almost always get it wrong.
When things get politicized it usually bring its own logic to. What supports us and our Agenda is logical and everything else is not. First they politicized the environmental movement then leftist politicians let them into scientific areas so they could infect those to.
Santa, raised in the Conservation movement that begin in and around the turn of 20th Century I was fascinated with the modern environmental movement which really only began in late 1960s. I was intimately involved with the environmental movement. I can assure you that from early days the leaders in the movement planned it to be a political movement, though in early days it was not leftist just liberal. Worse, unlike the Conservation movement which assume humans are part of nature, both part of the problem and the solution, the modern environmental movement quickly made humans the bad guy, something in total opposition to nature. At first it was just evil corporations; today it is all humans, but especially those in Western Democracies that are supported by capitalism.
I do agree that leftist politicians allowed or in some cases forced science into the realm of big P politics. As research funding became more and more dominated by government it became easier and easier to politicize the game. Climate science is certainly not the only field corrupted.
Edwin
Grateful for your insight.
Well said, mark Pawelek.
Climate science also suffers from a relative paucity of data, which is why they spend so much time and effort manipulating what they do have. It mitigates against levels of reproducibility seen in other scientific disciplines.
If somebody reports a significant new method of, say, producing pluripotent stem cells, then you can bet the farm that some competitors will be trying to reproduce it within a few weeks. Often quietly, if they have reason to think it suspect. This helps reduce confirmation bias and outright fraud, which can still occur.
Cli-sci is a smaller and more incestuous field where significant real-world data is more difficult and time-consuming to obtain, where ‘interpretaion’ of data can build a career, and where shysters can be retired before they are rumbled.
Thank you Michael,
I read your book, and it is excellent. Everyone here should read it too.
Michael Hart
Climate science does not use real data.
– Over 99.999% of Earth’s history
has no real time temperature measurements,
– For surface temperatures since 1880,
most of the Earth’s grids have no data,
so are infilled with wild guesses by government bureaucrats
who have predicted a lot of global warming,
and would like their predictions to come true, and
– For surface measurements since 1880,
a minority of grids do have raw measurements,
but those data are not used to compile
a global average temperature.
What is used are “adjusted” data,
sometimes “adjusted” more than once.
Once raw data have been “adjusted”,
they are no longer real data —
they are government bureaucrat estimates
of what the data would have been,
if measured accurately in the first place.
So, in conclusion, climate science does not use any real data
to compile the global average temperature … which is a
temperature no one actually lives in !
Not that having perfectly accurate temperature data
since 1880, or even for thousands of years,
would help us predict what the future climate will be !
My climate change blog:
http://www.elOnionBloggle.Blogspot.com
Richard Greene
Brilliant, thank you for a post a layman can understand.
Willis
This is particularly concerning since we know from the Climategate emails, that the Team quite blazenly said that they have to get rid of the 1940 warming.
We therefore know that the reduction in the 1940 warming, and the ensuing revisions to past warming was deliberate. These adjustments go even beyond a priori bias, because we know that the Team were aware that the 1920 to 1940 warming episode causes real problems to displacing the null hypothesis, ie., that all variations in the temperature record are of natural origin, and deliberately went about the task of flattening the warming out of the record.
In my opinion, you proved the adjusted temperature reconstruction is wrong, the other day when you posted your interesting article on stacking up volcanos. In my opinion, the reason why you were unable to find the signal to volcanos in your analysis, is because the data sets (and they are not data) have been so bastardised by endless adjustments that they are now no longer a reliable source for real world temperature change.
PS. I am sure that someone who is more familiar with Climategate than I am, can post the Climategate email that I am thinking of.
If they do, I think you’ll find that they didn’t say that.
September, 2009. Tom Wigley writes to Phil Jones:
Here are some speculations on correcting sea temperatures to partly
explain the 1940s warming blip.
If you look at the attached plot you will see that the land also shows the
1940s blip (as I’m sure you know). So, if we could reduce the ocean blip
by, say, 0.15 degrees Celsius, then this would be significant for the global
average—but we’d still have to explain the land blip.
I’ve chosen 0.15 degrees Celsius here deliberately. This still leaves an ocean
blip, and I think one needs to have some form of ocean blip to explain the
land blip …
It would be good to remove at least part of the 1940s blip, but we are still
left with “why the blip?”
He’s trying to explain the blip. If they are still left with “why the blip?” they haven’t got rid of it. And anyway, as he said, it was speculation. No adjustment actually happened as a result. Neither Wigley nor Jones had custody of any SST data.
Tom Wigley: “if we could reduce the ocean blip”
WR: No. Facts are facts, data are data. In Holland professors are dismissed when they manipulate the data to create a certain result. Because of fraud. In Dutch:
https://nos.nl/artikel/554459-overzicht-fraude-in-de-wetenschap.html
https://nl.wikipedia.org/wiki/Diederik_Stapel
https://www.ad.nl/nieuws/hoogleraar-erasmus-mc-ontslagen-om-fraude~a5b7802d/
A scientist can not discuss ‘reducing the ocean blip’ when there IS an ocean blip. Tom Wigley is talking about reducing “the ocean blip” that was found in the data.
But, as you say, Nick Stokes, “Neither Wigley nor Jones had custody of any SST data”. So they COULD not change the data.
Even the intention to change data is contra-scientific. In Holland: close to effective scientific fraud which is concluded when data are changed to get a certain (desired) result. Resulting in a dismissal.
In fact, there is no suggestion that raw data would be changed. The question is, what does it mean? There is something odd here – it could be an error. How much error?Scientists are allowed to think about that.
Except that is not remotely what the quote says. So yes, if the quote actually said something along the lines of what you say, perhaps. But it doesn’t. That’s how words work you see.
What the quote certainly does not say was the original claim:
” the Team quite blazenly said that they have to get rid of the 1940 warming”
In fact they are talking about an odd-looking dip in 1945. And wondering if it is an artefact.
Nick,
I have spent about 30 years studying ship’s data and I know that it is anything but robust and not fit for scientific study.
You state:
They are not talking about a dip in just one year, ie., 1945. It was a dip occurring during the war years, in particular during the convoy era.
During the war, shipping lanes changed, and ships followed closely hurdled close to one another in convoys such that the ocean was being agitated far more than would normally be the case. During the war years, one is simply not measuring like with like and that is before one even considers the inherent problems with bucket measurements. Later, of course, there was the change between bucket measurements and water cooling inlet measurements.
But whilst there may be reasons to consider that post 1940 data is suspect, there is no reason at all to reduce the 1920 to 1940 data. The peak of 1940 should stand.
The issue with the war years data should have been dealt with by setting out a wider margin of error during that period, and again during the change from bucket to inlet manifold.
Nick, it is not odd. There is a complete lack of oddness. It is in the wrong direction.
“wrong direction”
For whom? Folks here are always complaining that scientists are always cooling the past. But the suggestion here is that late 1940’s SST should have been warmer. The 1945 drop was spurious.
” the Team quite blazenly said that they have to get rid of the 1940 warming” That is not the same as saying “I don’t understand that blip.
We need to be able to explain it.”
Nick: “There is something odd here – it could be an error. How much error?Scientists are allowed to think about that.”
WR: perhaps it is subtle, but there is a big difference in searching for errors at random and searching for SPECIFIC errors as you do when you are specifically searching for errors that REDUCE a certain data result: Tom Wigley to Phil Jones “if we could reduce the ocean blip by, say, 0.15 degrees Celsius, “.
The last sentence has the intention to change the data in a specific direction. Isn’t that the intention to scientific fraud?
And they did in fact change the record and they are at it today.
I need the assistance of those more gifted in WayBack Machine than I…, I became interested in the Global Warming thing because I had to. Back in 2006 I took a consulting job to look for energy conservation measures at a U.S. military installation. As part of the contract we attended the conference each year, held at various places, to discuss various aspects of government energy policy. The conference in 2008 was held in August in Phoenix, AZ, and it seemed to me it was virtually dedicated to Global Warming. A keynote speaker (can’t recall his name, and although the website presenting the “minutes of the meetings” if you will lists keynote speakers, none rings and bell, and there is no indication of the time of day they actually presented, so that’s no help. It could have been Gavin Schmidt himself, but he’s not listed on the program or minutes) the second day began his speech with, “You don’t need to Google, or do an internet search, on Global Warming. Everything you need to know about climate is right here…” and gave the web address for Real Climate. That’s right, Gavin Schmidt’s (supposedly his personal, but done while he is on the clock at his day job, working for the government) blog. The speaker went on to say the time for debate was over, the discussion was closed, and there would BE no further discussion. All of which got my back up, so to speak.
So when I got back to a computer, I did exactly what he told us not to do… I Googled Global Warming. As an auto-complete suggestion, I saw, “Global warming scam…” I clicked on that. What I read was astounding. That’s how I discovered WUWT, it still showed up near the top of the search results in Google back then.
By the end of the week, though, I wanted to know why it was so important to the speaker that I NOT pursue any other information aside from that presented on the Real Climate website. So I went there. I quickly deduced why I was not to visit anywhere else, I could quickly tell all of the website was completely one-sided, and no debate or discussion was allowed. Curiosity, though, compelled me to click on the right-hand tool-bar, where it was organized by the author of the post at the beginning of each thread. I think I picked Gavin Schmidt (80% confidence level *smirk*). Now here is where my memory gets fuzzy, I think I picked the opening post of a random thread (50% confidence level, it might have been a reply to another comment), in which, about half-way down the page the author proclaimed (this is from memory, so may not be exact),
Imagine that for a second, he’s admitting not only that there is no Global Warming in the data, but also that he has assigned people to set about changing the data!!! That is when I became not just a skeptic, but possibly even a conspiracy theorist. But this is where I need the WayBack Machine drivers, I can’t find that post anymore! It was made sometime in the second half of 2008 (very remotely possibly as late as 1st quarter 2009). And beyond that, I have given everything I can recall that may help uncover it.
So, @Nick Stokes, this entire sub-thread, it matters not if you can parse away an individual quote taken “out of context” from an individual e-mail, and justify that we took it out of context, the fact remains that the Adjustocene is not random, adjustments are all made with a specific goal in mind, and even if Wigley and Jones had no direct access to that particular database, they did have the email addresses of those people who did have access to those databases, and the ClimateGate emails, taken in totality, clearly indicate that Wigley and Jones likely were instigators, possibly even authors, of changes made (without documentation or transparency) to said database.
End rant.
ROFL… Man science is easy, when after collecting data that doesn’t conform to your preconceived notions, you simply invent an “error” and adjust the data.
No, it doesn’t say they want to change data. The blip is a calculated average derived from data. They think that there is something wrong with that average, and are trying to figure out what might be causing it.
But there is context here. These are not secret plottings. Jones and others had already written a much discussed paper in Nature on exactly this matter. They thought the peculiar discontinuity was a changeover from buckets to engine intakes, and postwar variations in the intake. Those are things scientists should think about. And publishing a paper in Nature is a very public and proper way of doing it. And if an adjustment is made, they will have to very publicly persuade the actual managers of SST indices to do it. SST is actually a combination of different data types, and you have to figure out how to combine them. That is not data in itself, but calculation. Jones et al thought the calculation method needed to be revised.
Nick Stokes
Is there any scientific data relative to the heights of people reading mercury thermometers in the 18th/19th/20th Century?
Is there any data relative to the types of paints used on Stephenson screens globally?
Is there any scientific data on tea boys being sent out in the snow to record data when the resident ‘scientist’ was on his day off/on holiday/drunk/couldn’t be bothered?
Is there any data on the types of buckets used in ship readings?
Is there any data on the number of cabin boys sent to chuck a bucket over the side of a ship and not bother?
Is there any data that describes the wholesale falsification of climate data when these few variables are not intimately understood?
I could go on, but a cursory examination of historic recording methods ought to throw up many more conditions that blatantly undermine historic data.
Mann’s hockey stick describes temperature measurement down to tenth’s of a degree, but that’s simply not credible when proxy data going back hundreds of years is involved.
Torture the data and the methods all you want mate, the fact is, the wild claims of Hansen et al have not manifested themselves.
They were wrong then, and scientific observation proves them wrong now.
” many more conditions that blatantly undermine historic data”
So what do you suggest? Give up on historic data completely? I can just imagine what people here would say then. Look at the criticism of BoM for not including data before 1910 in their ACORN set.
Nick Stokes
I don’t think I suggested we give up on historic data. You conjured that up out the blue to score a point.
What I’m suggesting is that it should be treated with extreme caution and not used to bludgeon humanity to death with, as irrefutable fact. Just by way of example, you may recognise it:
“The problems with K/A dating are more profound, especially for the fossil record. A study in Hawaii gave an age for rock of 2.3 ± 0.3 million years. I don’t care about the specific age except that it is relatively recent geologically. What troubles me is the ± 0.3 million years. That is 300,000 years or a full error range of 600,000 years. How much happened in the last 600,000 years? Of course, as you go back in time the error increases. A one-million-year error range is not unusual.”
https://wattsupwiththat.com/2018/07/01/evolutionary-and-global-warming-theory-predictable-responses-with-no-empirical-evidence/
In fact, I could go further. I wonder if numerous scientific studies couldn’t be consigned to the bin because specific dates of historical events, based on paleo records are used, which don’t acknowledge the error ranges.
Nick,
You said, “So what do you suggest? Give up on historic data completely?” Isn’t that what has happened with pH data?
For goodness sake. There is a very clear and explicit order to that last sentence. Asking ‘why the blip’ comes after ‘it would be good to remove at least part of (it)’. Scientists most certainly are not allowed to think like that.
No, scientists often do think like that. There is something odd in that result that doesn’t look right. What would it take to remove it? It is a way of quantitatively looking for cause. It doesn’t mean you just change things to remove it, and Wigley, in thinking about that land component etc is clearly indicating that in thinking his way through it. But if you know there is a variation of something that could explain it, then you can focus on whether that something is right.
No Nick, scientists don’t. Real scientists say, “Oh hell, these numbers are no good, let’s get a better instrument and start again!”
And they do not publish until they have better numbers.
“Climate Scientists,” on the other hand…
“let’s get a better instrument and start again”
Hard to do with historic temperatures.
Only in the crazy climate cult are statements like ” So, if we could reduce the ocean blip by, say, 0.15 degrees Celsius”, “I’ve chosen 0.15 degrees Celsius here deliberately.”, “It would be good to remove at least part of the 1940s blip” seen as normal ways to discuss the data.
There is a big, yuuuge difference between, “That blip looks odd and is not supported by other data (in fact it WAS supported by other data, the “blip” appeared in both the land data and the SST data). Let’s look into it, such as instrument calibration, recording, verification, etc.” and “…It would be good to remove at least part of the 1940s blip…” Do you see the difference there? And @Nick Stokes, if you try to tell us those statements are identical, you lose all credibility. And you do have some left, BTW, but you’re pushing it.
You are the biggest “denier” on the face of the earth, Nick. Ethically, you’re statistically insignificantly different from zero.
No, there’s no suggestion the “raw data would be changed”…raw data is raw data. It would be adjusted and reported data. Duh. Playing semantic games here as usual?
There’s certainly a suggestion on how to product adjusted data…”speculations on how to correct sea surface temperatures” is just that. They even discuss a “deliberate” selection of a quantity.
As with Hansen’s failed claims about increases in tornadic strength that you tried to spin-away as a fairy tale, the climategate quotes are plain and damning.
Nick,
They were conspiring to deceive fellow scientists and the politicians naive enogh to trust them.
Makes sense. Holland has a great need to deal with reality. Ocean level rise needs to be accurate when reclaiming land from the ocean via dikes.
Really, you refuse to read that as a scientists saying he wants to change the data to fit his theory?
Let’s try this then: do we know that plenty of scientists in every field of science have done exactly that? Yes we do.
Does Nick Stokes consistently and constantly claim that climate scientists never do and never would? Yes he does.
Is somebody therefore being a bit stupid?
I wouldn’t say stupid, it’s probably a psychological defense mechanism as a result of cultish brainwashing.
“Really, you refuse to read that as a scientists saying he wants to change the data to fit his theory?”
Yes. Firstly, one simple item that people just don’t want to deal with. He can’t change the data! He is a mid-level academic in a minor English University. The data is held by a large US Federal agency.
But second is this local enthusiasm for picking over stolen emails to glean truth, while ignoring the actual path of science. Jones and others had just published a much-discussed paper in Nature explaining why they thought the blip was due to a change in methods of SST measurement. That put the case for modifying the index squarely and publicly. Musings in a Wigley email are of no significance in comparison.
Nick,
You wrongly assert that the Climategate emails were “stolen”.
All the ‘Climategate’ emails (including those from me) were leaked. They were NOT “stolen”.
The emails were of discussions of scientific matters that are not covered by intellectual property rights. Also, those emails do not contain statements that say they are subject to personal or commercial or financial or security or military confidentiality.
Assertions that the Climategate emails were “stolen” are attempts to side-track considerations of their contents.
Richard
Nick Mannsplaining why Wigley and Jones should retain their halos.
Yeah, well, to quote Richelieu:
“If you give me six lines written by the hand of the most honest of men, I will find something in them which will hang him.”
Fortunately in this case you can look at the actual science they produced. But ain’t nobody got time for that! There’s a witch to be burned.
If the land and ocean temperatures show the same ‘blip’, that means the ‘blip’ is real. So one should not get rid of it.
You’re right as usual Nick. Conspiracy to commit murder is no crime, only the actual murder.
Nothing see here. Move on!
In fact, the “1940’s blip” was a topic of discussion at the time, and it wasn’t at all about “trying to get rid of 1940’s warming”. Quite the contrary. There is an article from the time about it here. There was a sudden dip in temperature in 1945. A lot of people thought it was an artefact of some measurement problem. A paper, of which Phil Jones was a co-author, had recently appeared in Nature, titled “A large discontinuity in the mid-twentieth century in observed global-mean surface temperature”. Their argument was
“We argue that the abrupt temperature drop of 0.3°C in 1945 is the apparent result of uncorrected instrumental biases in the sea surface temperature record.”
They did not think that the 1940’s warmth was wrong, but the SST temperatures immediately following 1945 were too low.
Regarding this abrupt drop in temperature in 1945.
It seems that the drop in temperature between 1940 and 1960 has been either erased from or minimized in the various global temperature record databases. However it still shows up in many local temperature records, such as for the continental U.S. temperature or for the AMO index.
I also noticed in a recent post on WUWT that correlations with the global temperature record broke down over this same period. I have noticed this phenomenon in the past as well. To me, this indicates that corrections made to the global temperature record over the period of 1940 to 1960, which are apparently related to the measurement of sea-surface temperatures, are inappropriate.
Without these corrections, which lower temperatures prior to 1960 by approximately 0.3 – 0.4 C, the whole AGW narative falls apart.
There is the problem. Scientists placing their beliefs ahead of the data.
The data says the SST was cold. The scientists can’t explain why so they assume the data is wrong and needs to be adjusted.
They fail to consider that the data is correct and there is some fact they have failed to consider. Or more likely some factor they have not yet discovered.
And once they have adjusted the data the unknown factor will be permanently hidden from discovery. Holding back science for at least a generation.
“They fail to consider that the data is correct and there is some fact they have failed to consider. Or more likely some factor they have not yet discovered.”
Or, that temperature is very localized, and doesn’t follow some phantom “global mean”.
Nick,
I was getting email from Phil Jones at the time, some about how land and sea temperatures for NZ matched each other, while those for Australia did not.
Today, after convoluted purposeful adjustments, not only are all matches good, but land and sea are now combined for global.
Can this be done by honest, open science? Geoff.
Nick, you are flat-out lying or playing stupid again.
The emails explicitly refer to the “1940s warming blip.”
You’re pretending it was “a sudden dip in temperature in 1945” and that they were trying to explain aberrational post-1945 cooling.
If that were the case, they’d be talking about the 1940s COOLING blip. Do you need someone to explain the difference between warming and cooling to you?
How do you sleep at night?
“If that were the case, they’d be talking about the 1940s COOLING blip. Do you need someone to explain the difference between warming and cooling to you?”
Well, here is Willis’ complaint about that from above:
“As a result, in the old record temperatures cooled pretty radically from about 1940 to 1970 … but in the new record that’s all gone.”
So there wasn’t actually a “1940’s warming blip” to remove. Willis is grumbling about the removal of cooling.
The context is clearly the paper that Jones had co-authored in Nature the year before. It begins
“Data sets used to monitor the Earth’s climate indicate that the surface of the Earth warmed from 1910 to 1940, cooled slightly from 1940 to 1970, and then warmed markedly from 1970 onward1 . The weak cooling apparent in the middle part of the century has been interpreted in the context of a variety of physical factors, such as atmosphere–ocean interactions and anthropogenic emissions of sulphate aerosols2 .
Here we call attention to a previously overlooked discontinuity in the record at 1945, which is a prominent feature of the cooling trend in the midtwentieth century. The discontinuity is evident in published versions of the global-mean temperature time series1 , but stands out more clearly after the data are filtered for the effects of internal climate variability. We argue that the abrupt temperature drop of 0.3 6C in 1945 is the apparent result of uncorrected instrumental biases in the sea surface temperature record. Corrections for the discontinuity are expected to alter the character of mid-twentieth century temperature variability but not estimates of the century long trend in global-mean temperatures.”
They must pay you a lot of money to make this stuff up, your explanations are nuanced and almost convincing, until we think, “Why is this man saying this, for the last ten years?”
You must be very proud of yourself puta
Nick: My complaint with all of the SST adjustments is that they have been done from the desk. When someone goes out on a boat with a variety of buckets and a way to sample temperature of the water at the engine intake valve under various configurations, and a buoy and measures the difference in temperatures under a variety of conditions, then perhaps I’ll believe there is something scientific involved in adjusting SST records.
Frank,
Lots of people have tinkered with buckets, on ship and ashore, and engine intakes There is a review here. The more difficult area seems to be working out what mix of methods was actually used, rather than the variation of the methods themselves.
Meantime the soup gets warmer.
The “soup” has been cooling for 3 years…
http://www.woodfortrees.org/plot/hadsst3gl/from:2015.5/plot/hadsst3gl/from:2015.5/trend
Why stop at the surface David? Cherrypick?
Put on you geometry cap for a second. We can measure 100% of the sea surface temperature via satellites. It is a 2D geometry or approximately 150,000,000 m^2 and all heat in and out of the ocean must pass through this 2D surface.
Now think of 2,000 m of ocean depth. This is a 3D shape of approximately 1X10^12 cubic meters. A single transect, essentially a 1D line passing through this shape, is an infinitesimal % of the overall volume, and even 2,500 transects adds up to a very small % of this volume actually being measured. Heat can be transferred to or from the atmosphere (must pass through the 2D skin of the ocean) but also to and from the 1,750 m of ocean below where no heat content data is collected.
In other words, the surface temperature is a well constrained measurement with little error, whereas heat content of the upper 2,000 m of the ocean is highly uncertain and meaningless when you consider that heat can be transferred to or from a place where we aren’t even looking.
Robert, Good explanation!
Since probably before we put missiles on a nuclear submarine the Navy has been “mapping” the “thermal structure” of the oceans. Why? to hide submarines or find out where they might be hiding. I have often wondered how the Navy data would match to other data. My guess is that it certainly would be a better estimate of the thermal capacity of the oceans. Of course such data remains Top Secret or did the last I checked.
“the surface temperature is a well constrained measurement with little error”
That isn’t a common view here. But satellites aren’t magic. In fact, they aren’t used in SST indices. Wiki notes:
“here are several difficulties with satellite-based absolute SST measurements. First, in infrared remote sensing methodology the radiation emanates from the top “skin” of the ocean, approximately the top 0.01 mm or less, which may not represent the bulk temperature of the upper meter of ocean due primarily to effects of solar surface heating during the daytime, reflected radiation, as well as sensible heat loss and surface evaporation. All these factors make it somewhat difficult to compare satellite data to measurements from buoys or shipboard methods, complicating ground truth efforts.[17] Secondly, the satellite cannot look through clouds, creating a cool bias in satellite-derived SSTs within cloudy areas.[2] However, passive microwave techniques can accurately measure SST and penetrate cloud cover.[13] Within atmospheric sounder channels on weather satellites, which peak just above the ocean’s surface, knowledge of the sea surface temperature is important to their calibration.[2]”
Pre ARGO, there is all but no measurements down to 2000 metres. Talk about sparse data!
And unfortunately, ARGO was corrupted as soon as it was rolled out, which has forever tainted its data. When first rolled out, it showed cooling. Due to a priori bias, this was thought to be erroneous. The solution was to simply delete from the data set, the buoys that showed most cooling. This was done without returning a random sample of buoys to the laboratory to see whether there was any equipment fault/calibration error.
Pat Frank in https://wattsupwiththat.com/2016/04/19/systematic-error-in-climate-measurements-the-surface-air-temperature-record/
“More recently, Argo buoys were field calibrated against very accurate CTD (conductivity-temperature-depth) measurements and exhibited average RMS errors of ±0.56 C. [37] This is similar in magnitude to the reported average ±0.58 C buoy-Advanced Microwave Scanning Radiometer (AMSR) satellite SST difference. [38]”
Why start at the last El Nino? You should always have at least 10 years and start-stop at the same ENSO.
Why start at 2015.5?
Translation: I have no counterpoint against the blog post, therefore try to create a deflection with a pretty chart.
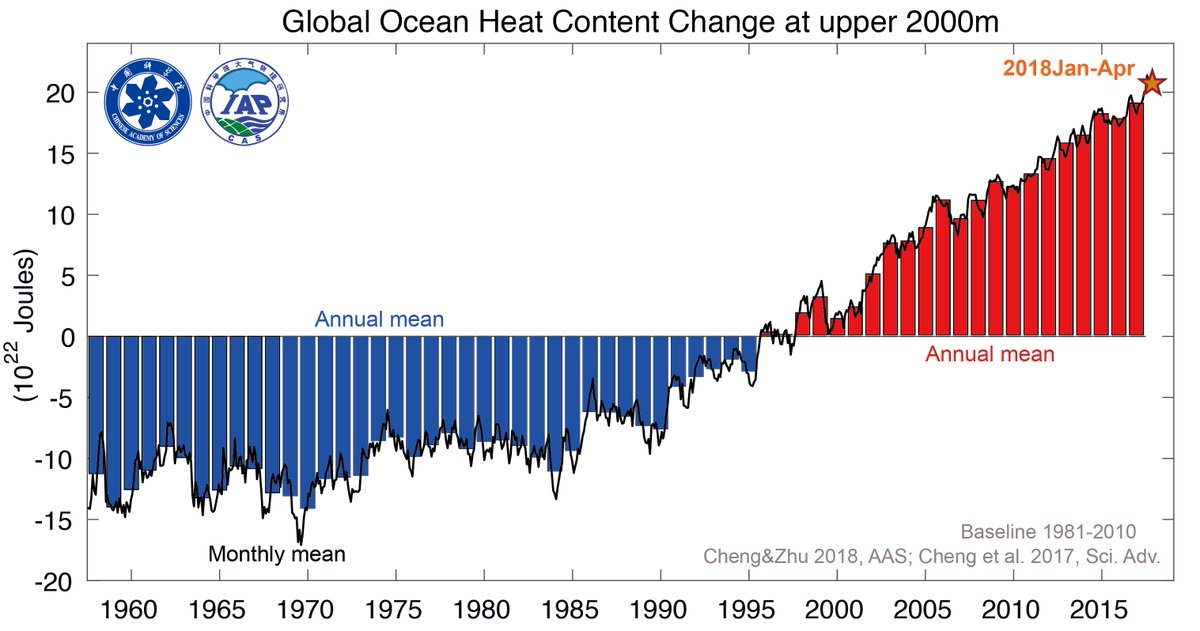
And in Zetajoules no less. 😉
No, I just don’t see the point on focussing on Hansen and how accurate or otherwie 30 yo scenarios are. The atmosphere is far more prone to shorter term variations than 2km of seawater so if you want to know what the trend is – that pretty graph is a good place to start. Who know though, maybe its getting colder down deeper and that graph is misleading. Willis?
Thanks, zazove. Me, I think that the claimed accuracy of oceanic temperature measurements is far overstated … see my posts “Decimals of Precision” and “An Ocean of Overconfidence“.
w.
None the less an indicator far less prone to the vicissitudes of short term fluctuation and as that graph indicates: the warming proceeds apace regardless of the accuracy oc 30yo scenarios.
Heat capacity of water = 3993 J/kg/K
Total mass of water on earth = 1.35 10²¹ kg
I don’t know about the chart above, but when I looked at NOAA’s data I saw a 180 ZJ rise in 30 years. 6 ZJ/year.
So, total heat capacity of earth’s surface water: 3993 × 1.35 . 10²¹ = 5390 x 10²¹
Divide that by 6ZJ, to get an average ocean temperature increase of about 0.001 C per year. In 1000 years time, oceans could be 1 C warmer at this rate. Sadly, for all I know the next deep glaciation may have kicked in by then.
You stop that! A value of 0.001 deg C is nowhere near as apocalyptic sounding as 60,000,000,000,000,000,000,000 Joules per year! You’ll get people no longer screaming about impending DOOM!
Yes, but if they change the aspect ratio of the chart so that the y axis is much taller and the time base is compressed, it would be much more alarming.
Yes, the data should really be presented in Hiroshima’s of energy.
Hey, where are the error bars on that graph?
No matter what you plot, it’s definitely warmer. They love woodsfortrees, so here it is from 1980:
http://www.woodfortrees.org/plot/hadsst3gl/from:1980/plot/hadsst3gl/from:1980/trend
Alley, who claims it isn’t warming since 1979?
Also have you noticed that you just smashed the AGW conjecture since the warming rate from 1979 are about the same or cooler than earlier warming rate trends going back to the1800’s.
Dr. Jones BBC interview
http://news.bbc.co.uk/2/hi/8511670.stm
There is no indication that CO2 is driving the undenied warming trend since 1979.
Shades of CRU graphical presentation, meaningless. This begs for the before and likely after, so a full cyclical picture can be seen.
Great chart. Thanks.
Great graph.
Zazove, do you think that ocean heat content is controlled by atmospheric CO2?
I see hand-waving, red-herring, and strawman all in one pretty little chart. Because it all comes down to, so what? Of course the temperature of the oceans change, they have been doing it for millions or even billions of years, and undoubtedly will continue to change in the future. Various proxy data indicates it has been both warmer and cooler than anything measured in our very, very, very, very short instrumental temperature record. Did I mention that you have presented a short record? You show <60 years of data (it doesn't even go back as far as the 1940s "blip" than began this thread), and I'm pretty sure there is proof we have had oceans for several billion years, what percentage is that? I am not alarmed. FAIL.
If the graph had been going down I’m sure you’d find it far less disturbing. No comment on David’s 3 year plot?
The Human Animal cannot pass off untruths – it is a very discomforting thing to even attempt to do.
Even ‘by omission’ because the worst person for keeping a secret is the very person whose secret it is.
Government Types will claim they ‘miss-spoke’ and if you kick up a fuss, will hit you with a new tax.
Sometimes they get it wrong and give themselves away.
Big beautiful shiny diamond was buried within the Martian dust-storm story.
The ‘scientist’ told us that dust storms of the Martian style couldn’t happen on Planet Earth because:
Planet Earth “has plants”
And THAT is ALL you need to know.
PS You now know why Hansen was so hot & sweaty during his ‘testimony’
Cute huh
It isn’t CO2. ERBE shows that quite clearly. As the earth has got warmer it has emitted more, not less energy.
I am happy to learn that the post 1945 era that I grew up in was not as hot as I remember.
Good job on the Hurst aspect and the other nits.
On the temperature, I believe 1988 would be land only, and not a very complete record as it predates construction of ghcn.
An apples to apples comparison is hard, because station inventories change and there are needed adjustments.
Nevertheless hansen’s achievement is spectacular given the complexity of the system. History will record the broadly correct findings and ignore the nits.
Dr. Hansen’s original 1988 chart (posted above) stated that it is a GLOBAL Temperature Trend, in fact ALL of the charts posted are Global based data.
You missed this badly, Steve.
He also said, in the paper with Lebedeff which introduced the Ts index:
“The principal limitation of this data set for global or hemispheric analysis is the incomplete spatial coverage, illustrated in Figure 1 for four dates. Although the number and geographical extent of recording stations on land areas increased strongly between 1870 and 1900, there were still large areas in Africa and South America, and all of Antarctica, without coverage in 1900. Substantial station data for Antarctica begins in the 1950s. Large ocean areas remain without fixed meteorological stations at all times.”
Uh huh so what!
A whole lot of other station records were collected later (GHCN), and this filled in gaps and affected the estimated global average a little.
http://noconsensus.files.wordpress.com/2010/01/ghcncrucompare21.png
add
ad/Submit
verb
1.
join (something) to something else so as to increase the size, number, or amount.
But then he stands in front of Congress and tells them the graph he is showing is “global average temperature”, doesn’t discuss uncertainties and errors, and instead says he is 99% certain. So you’re in agreement that his 1988 testimony to congress was political and not scientific?
” doesn’t discuss uncertainties and errors, and instead says he is 99% certain”
It isn’t true that he didn’t discuss errors. Here is his Fig 1 showing the uncertainties, with a range similar to the variation we have seen between his version then and later versions. His 99% relates to the question of whether, even allowing for error, the graph is showing a rise that could have happened by chance.
Why do there appear to be fewer “error estimates” than annual mean temperatures, and why are they placed on the lines connecting the data points? Can we add Hansenization to Karlization?
I don’t see any error estimates on the trendlines, or near the data. I see a footnote sort of thing at the bottom of the chart, indicating “Error estimates (95% confidence)”. I never took a statistics class, and clearly Hansen didn’t either, but we did some discussion of data and error estimates in Mechanical Engineering classes. I don’t think that’s how we were taught to do error estimates. I don’t see his supporting data or supplemental information where he calculated the error, so we can’t tell for sure.
This is 1988. You can’t just wave the mouse and get a shaded colored background in the graph. At least, not easily. I think where I was we were still using mechanical plotters with pens. The estimates vary gradually and are given at sample length. Even then it is cluttered.
Fair enough, but they are not realistic. Who in their right mind would think that the margin of error is only about 0.1 to about 0.18 degC.
Nick,
I had an Atari with good graphics and a spreadsheet in 1979, and an Amiga with superior graphics, an improved spreadsheet, and a decent Paint program in 1984. While I didn’t get my first IBM PC until 1991, the first IBM PC came out in 1981 and many, if not most, businesses and government agencies had them by 1988. I would be surprised if NASA didn’t have them in abundance in 1988. I was routinely using a desktop PC at work in 1988, and had access to color printers.
Nick, SO what Lebedeff was saying is there are large areas of the Earth, especially the oceans, with no temperature data especially historical data. And for portions of the Earth there is probably data that is inaccurate. In other words there is a huge amount of uncertainty in the data being used and that is before adjustment.
Well, we now have a measure of the uncertainty caused by lack of stations. It is shown in Willis’ discrepancy plot which varies by about 0.1°C. But it doesn’t change the broad conclusion. The old index with limited stations and the new both followed a similar upward path.
I don’t think that’s what it shows at all. Comparing inaccurate data to inaccurate data doesn’t prove anything, least of all how inaccurate either (or both) data set(s) may be.
Nick Stokes:
He also said, in the paper with Lebedeff which introduced the Ts index:
His Congressional testimony and comments to reporters and other non-peer-reviewed communications were more alarmist than what he wrote in his peer-reviewed publications.
Oh ok, that explains everything then. There was a 1% chance it occurred by random variation except that there was a 33% chance that the data was crap. Is that the explanation?
“…The principal limitation of this data set for global or hemispheric analysis is the incomplete spatial coverage…”
Fact: It was STILL global and not just land, so Mosh was wrong.
Fact: There is STILL “incomplete spatial coverage” today.
Fact: You’ve gone out of your way any number of times to show that a very limited number of stations are needed to accurately represent global anomalies, so why are you going out-of-your-way to defend Mosh’s false claim with this “incomplete spatial coverage” point?
Mosh himself also suggested that one needed only about 50 stations (but he might have placed a caveat that they be spatially evenly distributed).
Now I read that to mean he didn’t have enough data to make any meaningful projections, and then he went ahead and did it anyway!
“Nevertheless hansen’s achievement is spectacular given the complexity of the system.”
May history please quote you on this, as well?
Willis,
“So I went and digitized the dataset above so I could use Dr.Hansen’s data”
GISS has a handy history page, which not only graphs the old data, but has numbers for download. There is a file of old TS versions here. It includes a 1987 version, which is what Hansen said he used.
“here are the changes between the version of the GISS temperature record that Hansen used in 1988, and the 2018 version of the GISS temperature record”
It is a very different set of stations. GISS Ts in 1987 is from Hansen and Lebedeff. GHCN did not exist then; they used mainly WWR data. They showed a plot of data available; it has a peak of about 1800 in the years 1950-75, but then a substantial drop-off, down to under 1000 in 1980. So the 2018 version has at least three times the number of stations.
“More to the current point, the post-1988 divergence between the HadCRUT and the GISS record is enough to rule out any possibility of determining whether Hansen was right or wrong.”
This is not like with like. GISS Ts, which Hansen used, is land stations only. HADCRUT is land and SST, but dominated by SST.
Nick
Always good to see your comments, but I did not see any comments from you on the recent article by Willis on stacking up volcanoes (https://wattsupwiththat.com/2018/06/25/stacking-up-volcanoes/)
If you have time, it would be useful to have your comments on that interesting article, in particular, since you are an expert mathematician, whether you have any issues with the maths behind Willis’ analysis.
Willis found that with respect to the 24 largest volcano eruptions, these did not show up in the BEST and CET temperature reconstructions as producing even a short term cooling.
No one raised issues with the methodology of Willis’s analysis, and Willis concluded that contrary to popular views, volcanos do not lead to cooling. Personally, whilst I consider that Willis’s analysis supports that conclusion, it is nonetheless incorrect, and the real conclusion to be drawn from that analysis is that the temperature reconstructions are not fit for scientific scrutiny, and it is because they are defective that one cannot see the cooling effect of any one of the 24 largest volcano eruptions.
You have alluded to the reason why, namely that the set consists of continuously changing stations such that one is never able to compare like with like, ie., a point similar to your comment: “It is a very different set of stations. GISS Ts in 1987 is from Hansen and Lebedeff. GHCN did not exist then; they used mainly WWR data. And of course, Steven Mosher makes a similar point, namely: An apples to apples comparison is hard, because station inventories change and there are needed adjustments.
As I often suggest to you, what is needed is to isolate say the best 200 stations, least impacted with local environmental change these past 80 or so years, retrofit these (with same LIG thermometers, enclosures painted with the same historic paints), and simply compare modern day unadjusted RAW data collected at each station, using the same TOB as used at each individual station, with the historic RAW data for that station, ie., simply compare each station with itself, and not try and construct some hemispherical or global construct.
Please, if you have time, have a look at Willis’s analysis and please comment on why you consider it failed to reveal the impact of volcanoes
Richard,
I don’t have a strong opinion on the matter. It seems to me that sometimes (eg Pinatubo) volcanoes seem to have an effect; sometimes it is hard to detect, and there may in fact be none.
Thanks, Nick.
i always appreciate your input.
Nick Stokes: “This is not like with like. GISS Ts, which Hansen used, is land stations only. HADCRUT is land and SST, but dominated by SST.”
WR: You are right that it is not like with like. But Hansen was suggesting that he was telling about the warming of the Earth. And the Earth is dominated by the oceans, also in extension: 71% of the surface is ocean. So HADCRUT is a good choice to compare with the graphic of Hansen as shown above, a graphic which has the title “Global Temperature Trend”. Global. Exactly what HADCRUT is supposed to demonstrate.
Hansen should have said that he was using mostly Land Stations which could give a very different picture than the picture for the Earth as a whole. That would have been correct. It was Hansen who was not correct and preferred to give a biased view on temperature developments on the Earth. Well seen by Willis.
Nick Stokes, another question for which I am interested in your answer: how much might Land temperatures go up without (!) a comparable rise in Ocean temperatures, more than a half degree? If so it has to be explained in which way (!) oceans can rise as fast in temperature: by which mechanism?
“Hansen should have said that he was using mostly Land Stations”
Hansen was not actually using stations at all for the prediction. He was calculating a global air temperature with a GCM. He compared it with an air temperature measure; the best available at the time. Indices made of combined air temperatures over land and SST for ocean simply did not exist at the time.
It is clear that land temperatures can and do rise faster than SST during warming. I don’t know how far they could get out of line, but it clearly has, by a fraction of a degree. During that 33 year period from 1988 to 2017, HADCRUT rose by 0.53°C, while CRUTEM rose by 0.85°C. HADSST3 rose by 0.42°C.
Nicke Stokes: “I don’t know how far they could get out of line, but it clearly has, by a fraction of a degree.”
WR: As I have shown here: https://wattsupwiththat.com/2017/01/26/warming-and-the-pause-explained-by-wind-upwelling-and-mixing/
sea surface temperatures can get ‘out of line’ simply by more or less wind over the oceans: more or less mixing of surface waters or more or less cold deep upwelling will result in important changes.
As the graphics of Ole Humlum show, most time a change of temperature of the oceans is followed by a change of the temperature of land – and not the other way round: page 41 from http://www.climate4you.com/Text/Climate4you_May_2018.pdf
If the oceans as a whole are only warming by a 0.001 degree a year (see calculation above of Mark Pawelek), any ‘dangerous warming’ will soon find its limits in the but slowly rising overall temperatures of the oceans. Even if there is a mechanism (less wind) which temporarily could enhance surface temperatures over the oceans. But as soon as wind will be enhanced, cooling of the oceans will be the result.
To continue ‘fear mongering’, a mechanism must be known of how to definitely break the strong relationship between ocean temperatures and land temperatures, something else than ‘urban heat island effects’ that influence land temperature measurements. If ‘climate science’ does not know a mechanism other than ‘temporarily less wind over the oceans’, all climate scientists should say that any warming over decades or over a century must be very limited. Because no other mechanism is known to heat the oceans faster than with a 0.001 degree in a year.
Without such a mechanism, the relatively fast warming over the last century should be near its limits.
Largely because of the difference in specific heat of water and land, it is inappropriate to conflate the two temperature sets. But, I’m not really telling you anything that you don’t already know, but willfully choose to pretend isn’t true.
@Nick Stokes This is why you have credibility left. You are great with actual data, and data sources. It’s the conclusions you reach from said data that boggle my mind!
Willis
I suspect that your own article was written contemporaneously with that of Clyde Spencer’s (https://wattsupwiththat.com/2018/06/30/analysis-of-james-hansens-1988-prediction-of-global-temperatures-for-the-last-30-years/).
In your article, you note, quoting Hansen himself, that:
“Are we to believe that at least two events with a 1% probability occur within 7 years of each other?”
Of course! Every storm from here on out is to be labeled “a once in 100 year event”, because how else can we claim that things are getting So Much Worse and we need to Be Concerned?
Much of that is due to ignorance (reporters), sometimes willful (meteorologists and scientists).
A 100-yr storm event is precipitation that falls in a given amount of time. There is a 100-yr rainfall for a 24-hr storm event. There’s one for 48-hrs. 72-hrs. 15-minutes. 30-minutes. There’s one for ANY storm duration. So there are any number of possible durations for which a 100-yr storm event can occur in a given year. There’s isn’t one true “once in 100 year event.”
Now that’s not true for flood events…there is a “once in 100 year event” for flooding. But that is so out-of-whack for most locations because of changes in land use.
For me the concept of “Global Temperature “ suffers from cyclical logic; for it is merely the result of a series of definitions, assumptions and measurement techniques by which the result is obtained. A flaw in any one of these renders the result suspect and any change in the process negates the previous result.
Hence the never ending debates upon its value and behaviour. However it is a useful concept if treated with due respect for its vagueness; but should never ever be used as a basis for prediction. That is a matter for Chaos Theory to deal with.
That is why I prefer Ocean heat content (J) and seaice extent (km2).
Sea ice volume is more dependent on heat content than sea ice extent.
But extent is easier to measure.
“For me the concept of “Global Temperature “ suffers from cyclical logic; for it is merely the result of a series of definitions, assumptions and measurement techniques by which the result is obtained. A flaw in any one of these renders the result suspect and any change in the process negates the previous result.”
It’s not just that. Temperature is an intensive property of the point being measured. Averaging intensive properties from different locations doesn’t give you anything meaningful. Anomalies derived from such are also physically meaningless.
Oh No! The truth is worse than we thought. Thank you Minister of Reality. And a quart of hero medals for Komrad Willis.
.
.
Sandy,
Minister of Future
There is climate in most planets and large moons of the solar system, and interplanetary solar wind conditions and cosmic ray rates are usually referred as space weather.
It’s simply nonsensical to use the 1950-1980 to define your data set and then say things outside that dataset are unusual. They might be, but they might not be. What you are trying to discover is whether they are. But you cannot assume they are, then exclude them from the data set and say “look, if I exclude them, they are excluded.”
You have to be able to show that your data set is “normal”, but that is entirely what we are trying to discover. Should the warming be in the normal data set or not?
The 1950 to 1980 base includes the great global climate shift of 1970-75 or so.
Not a good choice, in hindsight. Or then. Another reason to prefer actual temperatures to these silly animal things.
In my State of Victoria, there are old mile markers by the railway lines. Between Melbourne and Bendigo, IIRC, there are measurement errors that were tracked to the use of 3 or 4 different definitions of the length of the standard mile at the time. You need stable, reliable, understood base measurements for best results. Geoff
Phoenix44,
I agree completely. Hansen used the standard deviation of the 1950-1980 data set, instead of the standard deviation of the 1958-1988 data set, to arrive at a probability for a measurement in the latter data set. He was comparing peaches and nectarines, inasmuch as there was some overlap. As I explained yesterday in my article, if Hansen wanted to establish the probability of the early-1988 seasonal average occurring as a random variation, he should have de-trended the data set containing the measurement, thereby removing the upward trending bias. He then should have calculated the standard deviation of the residuals. He should have known those things were necessary, but didn’t do them. That leaves two possible conclusions: He is incompetent in statistics, or he willfully lied for political reasons.
If course there is climate in space , Willis, never heard of the ‘solar wind’ ?
🙂
Solar wind is what happens when we eat too many sunflower seeds.
We began feeding Black Oil Sunflower seeds to quail. We then noticed they take off faster and more vertically. We had no idea. Thanks for the explanation.
Thanks Willis for exposing those numerous errors.
Yes accurate Global Temperature must address BOTH Type A (Statistical) AND Type B (Systematic etc.) errors. Yes temperature statistics must include both locational, temporal (HURST) Climate Persistence variations, both non-random.
Systematic temperature errors also need to be addressed, per the BIMP international standard “Guide to the expression of Uncertainty in Measurement” https://www.bipm.org/en/publications/guides/gum.html e.g. as exposed by Anthony Watts Surface Stations Project. http://www.surfacestations.org/
David L Hagen,
You say,
“Yes accurate Global Temperature must address BOTH Type A (Statistical) AND Type B (Systematic etc.) errors. ”
Sadly, at present there cannot be a determination of accurate Global Temperature”. The two basic reasons for this are as follows.
1.
There is no agreed definition of ‘Global Temperature;.
Each group that provides data for ‘Global Temperature’ uses a unique definition of Global Temperature alters the definition it uses almost every month. Effects of this have been presented in this thread as discussions of
(a) whether Hansen’s 1988 data were global (as he said) or merely “land based” (as some here assert)
and
(b) whether it was right to ‘cool the past’ by use of different definitions of Global Temperature (i.e. different data sets collated in different ways and subjected to different data ‘adjustents’). The severity of the changes to Global Temperature GISS has obtained by choosing different definitions of Global Climate is clearly seen at a glance by this
http://jonova.s3.amazonaws.com/graphs/giss/hansen-giss-1940-1980.gif
2.
If there were an agreed definition of Global Temperature then the accuracy of any determination of Global Climate could not be known because there is no possibility of a calibration standard for it.
An assessment of these problems is provided by Annex C of the item at
https://publications.parliament.uk/pa/cm200910/cmselect/cmsctech/memo/climatedata/uc0102.htm
Richard
Sceptics should simply acknowledge Hansen’s second monumental achievement, the Hansen Factor. To determine the value of an unknown (e.g. global temperature), one multiplies the value of an economically essential known (e.g. carbon dioxide) by its Hansen Factor. Et voila, the answer to “where should humanity aim.”
Humanity, however, must let history decide whether the Hansen Factor eclipses the Hansenometer, a numerical device that changes the past and divines the future.
And it’s even harder to say a prediction is right or wrong when it is about a graph of a highly interpolated average. It’s like arguing over the meaning of an abstract painting. It’s hard to say who is right and who is wrong, and more importantly, who cares?
It’s much easier to test a tangible prediction, like the West Side Highway being underwater this year. Someone check, any kayaks paddling down the highway yet?
It’s much easier to test a tangible prediction, like the West Side Highway being underwater this year. Someone check, any kayaks paddling down the highway yet?
No one predicted that the West Side Highway would be underwater this year.
There was some flooding in April though.
Phil Hansen predicted the Westside Highway would be under water.
https://realclimatescience.com/2018/06/hansen-got-it-right/
“Phil Hansen predicted…”
Who’s Phil Hansen?
I think he’s one of the Hanson brothers…
Since many people here misspell his name “Hanson”, you could be right, David.
Phil. Google is not your friend.
https://wattsupwiththat.com/2009/10/22/a-little-known-but-failed-20-year-old-climate-change-prediction-by-dr-james-hansen/
On the contrary that link agrees with me, I suggest you read it.
April flooding was a temporary event due to the stormwater system failing to handle heavy rainfall. The West Side Highway has had “some flooding” regularly during storm events, including many times before Hansen’s prediction. That’s not what he was talking about.
Hansen’s claim was based on sea level rise and thermal expansion backing-up the Hudson River so that it would cover the West Side Highway.
Neither Hansen nor the interviewer said that as far as I’m aware, in fact Hansen described a storm. The West Side Highway does flood periodically, so saying ‘well the WSH will be flooded (again!)’ would be something of a local in-joke. The highway that he mentioned no longer exists in any case.
” The highway that he mentioned no longer exists in any case.”
Hmmm.
In that case, Hansen’s prediction was the most wrong that was possible.
Richard