By Javier
A most remarkable climate phenomenon is taking place under our very noses without anybody paying attention to it.
As nearly everybody knows, the planet is warming. Since its short-term rate of temperature change hasn’t changed much, the warming is essentially accomplished because the planet spends less time cooling than warming. Therefore, periods of cooling have become shorter and result in less cooling.
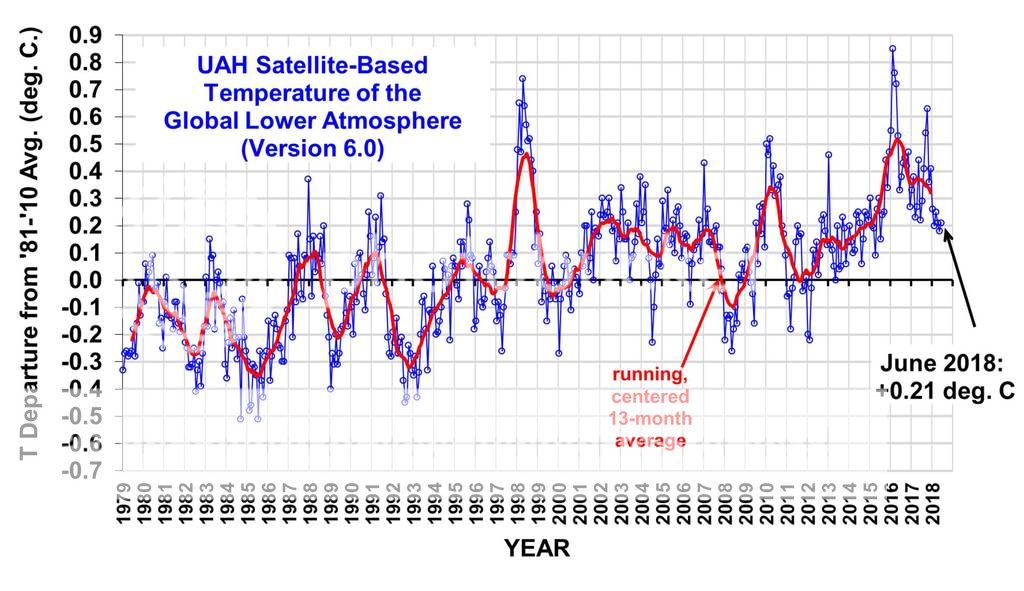
In the figure below, we can see the top 10 biggest periods of cooling in terms of temperature decrease since 1950. The data used is a 13-month centered average of the monthly HadCRUT 4.6 global dataset found here:
The date given is that of the month of maximum temperature when the cooling started, and the length in months is to the month of minimum temperature when the cooling ended.
Notice how the top four took place before 1975, during the ENSO period dominated by La Niña conditions.
The data for the cooling period that started in 02/2016 (red in the figure) is provisional, as the cooling has not ended as of June 2018. If it continues for a few more months, it could easily make it to the top three.

Figure 1
The most remarkable thing is that every single top cooling period in the list has a reasonable explanation except the current one. Two of them are associated with the major volcanic eruptions of El Chichon and Pinatubo, and seven of them are associated with major La Niña events when the Multivariate ENSO Index (MEI) reached a standard deviation of -1 (see bottom panel in the figure).
Only the current cooling period remains there unexplained, without a big volcanic eruption and without a major La Niña event.
Climate scientists should be looking for a reason for this most interesting cooling instead of ignoring it.
Why is the planet cooling now?
Everybody can have their own favorite explanation. Personally, I see no other reasonable cause for the cooling but low solar activity.
God has a sense of humor…
Yep. That’s why he created mankind. He thought the Universe was a boring place so he created mankind so the rest of the Universe could have a perpetual clown show for entertainment — Then man invented politics and since that happened the clown show has exceeded His expectations for over-the-top and off-the-wall hysteric levels of hilarity. The rest of the Universe laughs at us.
That’s why
heshe created mankind.HeShe thought the Universe was a boring place soheshe created mankind so the rest of the Universe could have a perpetual clown show for entertainment……
..
See, I fixed your errors.
Well, that explains why nothing seems to work quite the way it should.
“Ah yes, Vir. The universe does, after all, have a sense of humor. Unfortunately, not a very pleasant one.” – Ambassador Mollari.
TonyL, like the Babylon5 reference. “Vir” also played a character in Animal House…..
“Fat , drunk, and stupid is no way to go through life, son.”
… and then, because she was feeling guilty, and because personkind was a little too accurate a rendition of herself, she created kittens to try to make it up to personkind.
Kittens are good, one of the best things on Earth according to Morte….
Especially if you use a barbeque sauce with lots of garlic.
you’re missing out on the squiggly shapes if you haven’t tried deep frying.
mankind: wifman and wereman, abbreviated and altered to woman and man. man was the description of the species not a gender.
Wifman we’ll recognise as giving us the word wife, and wereman we know in popular mythology in terms of a hybrid male man/wolf – the werewolf.
Female hybrids would therefore be wifwolves.. I suppose that’s why we’ve never seen to many movies about such creatures – “attack of the WIlfwolf’ just doesn’t have the same ring.
we now return to your normal broadcast
Gender is a grammatical term, not biological. But yes, “Man” means human in the Germanic languages, the species not a sex.
He created dogs after what Eve did.
I’m thinking that the rib myth got started because women have narrower waists than men (at least before childbirth) and wider hips, and in prescientific times, no one bothered actually to count the ribs.
Women and cats run the world. Men and dogs just need to get used to it.
Found in some woman’s recipe book: “How to wok your dog.”
It is better than “cashew kitty”.
And Star Trek Discovery was not a cow… gotcha.
Star Trek Discovery was not a cow
It was a dog.
No, it was a cash grab. I have no idea if it was any good, but I’m not paying an additional monthly fee to see it.
Well done Betty.
Regards
If God is female please explain childbirth.
There is nothing to explain, ….. the female God(ess) created a male human ….. and then created a female human for reproducing all future humans in conjoined succession …… with ONLY the female’s nuclear RNA being inherited by her female offsprings.
The actual question Roy was asking was implied. “If God is female, then why did she cause females to have such a difficult time in childbirth?”
All a woman’s children offspring, male and female alike, inherit her mitochondrial DNA. I admit I don’t know if the same is true about her nuclear RNA, but to me it seems likely.
Sam and Leo,
Mitochondrial DNA is correct.
You don’t inherit nuclear RNA, by which I presume you mean Small Nuclear RNA (snRNA) or U-RNA. It’s made according to instructions in your DNA, which of course comes from both parents, and transcribed by RNA polymerase II or III.
That would be the mitochondrial DNA, NOT the nuclear DNA. Your nuclear DNA is fifty from each parent.
Yeah, if a woman is God , that explains at lot. we all know they are good at giving birth to things but can’t drive. No wonder all those black holes keep crashing to one another.
That is why She had to event free will and let MANkind get on with it.
Ugh… Hey Bets are you a woMAN or a woSHE? (rolls eyes at the absurdest of the absurd.)
That’s taken from a classic graffiti:
1. writes:
> God is black !
2. comments:
> Yes she is !
– and now we need an extra 3.:
> and she’s a cat !
Keep up with the times Betty your feminist rants are stale complaints. Don’t you understand that only God gets to decide what pronoun to use and It matters not what God is only what God says God is. The only open question is: was God once a Theyby.
Ze created mankind?
@ur momisugly Betty,
It seems your sense of humor (judging by the like/dislike numbers) works just about as well as mine when winning pool, game after game, in a biker bar.
God is neither a he or a she he is something else altogether but he has told us to call him “Father” so you should always refer to him as such.
The reason that God is a ” he ” has to do with something that doesn’t taste like chocolate. Or so I’ve heard
“Betty” is a sockpuppet
Are you another of these Uman hater types Tom.
If so, care to tell me a greater achievement of nature in the universe than Man.
Among amniotes, I’d go with the blue whale and the bee hummingbird.
Don’t forget the platypus.
I realize you jest, but that idea is almost enough to make a believer out of me. If comedy is the purpose, at least there’s a purpose!
Why do people assume God is good, maybe it is a Devil and made sentient beings likes us to suffer for entertainment.
I’ve really never thought otherwise.
I thought El Niños — such as occurred in 2016 — were typically followed by a period of global cooling even if unaccompanied by a La Niña.
No?
Climate change is supposed to be forced. Something must cause the planet to warm or cool and ultimately that something is probably affecting the energy balance one way or another. While small periods of temperature change might be chaotic, it is clear that the major periods of cooling have an associated cause, as can be seen for the other nine in the list. Since the planet is warming, if you don’t have a cause for the cooling, the planet should be warming instead.
While it is true that the end of an El Niño should cause a reduction in the warming rate just due to the disappearance of the warming cause and a drop in temperatures as the lingering heat in the atmosphere leaves the planet, this should not cause in any way a major cooling in the top 6 of the last 70 years.
Say what? The temperature peaked in the El Nino of November of 2015 and started dropping from there. As you point out, other El Ninos were followed by major temperature drops in your graphic above … so why wouldn’t this one? That’s special pleading.
w.
In UAH observations, El Nino peaked in February 2016.
https://www.nsstc.uah.edu/data/msu/v6.0beta/tlt/uahncdc_lt_6.0beta5.txt
The major temperature drops were caused by major Niñas, not by the preceding Niños.
“unexplained major cooling ”
That is fluffy nonsense.
It is neither unexplained nor major.
1. As others point out a drop after an EN is totally normal.
2. If you call this
a major drop, how would you describe it if temperatures dropped back to the 30 year average?
You’re looking at short term fluctuations overlaid on a rising AGW trend. The solar min might have made a barely measurable difference, but I’d expect the next few years to be back on the rising trend. If it wasn’t that would take some explaining.
When does a drop after an El Niño stop being normal? Statistics say this cooling is already top 6th and the only one in the top 10 without the help of a strong La Niña or a volcanic eruption. Being a unique event fits my definition of not being normal.
The running mean in the UAH graph is down 0.2, I see plenty of 0.2 drops.
And now the hint of warming resuming.
Nothing burger.
1/10ths and even 100ths of a degree…OH MY. Back to my safe space with my teddy. Thanks Ry, don’t know what I’d do without your alarmism!
Then you need to learn some stats. You use the word but you don’t use ANY stats.
Start by learning what a normal distribution is and reflect on why it is called “normal”.
You also need to learn to use a non distorting filter since your pathetic running mean is known to produce spurious peaks and troughs. If you initial data processing introduces spurious rises and falls there is ZERO point in make a list of the “top ten” and scratching your head as to the cause.
This kind of incompetent spreadsheet fiddling is exactly what is wrong with mainstream climatology.
Sorry to be a bit blunt but I’m getting rather tired of pointing out the same errors and seeing people continue using the same broken methods because they are too lazy to learn how to apply anything less problematic than a crappy running mean.
Love the way your “Mt Pinatubo” cooling started before the eruption and the El Chichon stated 18 mo after the eruption. Maybe there is a clue that much of the “volcanic forcing” is being confounded with other variations.
BTW what is the reason for fitting a straight line to the length vs cooling graph? Oh, of course, because that’s all you know to do apart from a running average ( and Excel does it for you , so it only takes two seconds ).
I also noticed that. It is clear that Pinatubo eruption took place in the middle of a cooling period. That’s a job for climate scientists to disentangle the contributions to the cooling. What appears clear is that the eruptions contributed to the cooling. The scientific literature on that is huge, and it has made it to the models.
Lean to use a proper filter. Pathetic running means are well documented to distort the data and produce spurious peaks and troughs.
Since you are basing the rest of your analysis on peaks and trough , your list of the “top ten” is meaningless so don’t spend too long scratching your head or jumping to “conclusion” like “solar: what else could it be?”
This kind of Micky Mouse , spreadsheet fiddling is what is wrong with much of mainstream climate science.
You talk about statistics buy you don’t use ANY statistics. Start by learning what a normal distribution is and reflect on why it is called normal. Then apply some statistics to the very small number of intervals in your sample and come back and tell us how important sixth from the top is.
Sorry , this is junk science of the premier order.
I tell you the same I told Willis. It took me 10 minutes to analyze the data for this post. It shouldn’t take you longer to do it your favorite way. Do it and post your results so we can see the differences it makes and how significant they are for the main conclusions of the article.
Otherwise your criticism and opinions are irrelevant.
And you are barking the wrong tree here. This ain’t climate science or wouldn’t be posted on an internet blog. This is science opinion.
“I tell you the same I told Willis. It took me 10 minutes to analyze the data for this post. It shouldn’t take you longer to do it your favorite way. Do it and post your results so we can see the differences it makes and how significant they are for the main conclusions of the article.”
Sounds like a fair bargain to me. I look forward to the debate.
don’t hold your breath. Greg won’t produce anything that takes effort. He like to armchair criticize.
@RyanS
The injtial cooljng in the TLT post 2015 El Nino peak was the steepest most rapid cooling in the entirety of the TLT dataset. That’s major cooling.
Why would you expect “the next few years to be on a rising trend”? If the anomaly behaves as it has post the previous Super El Nino in 97/98, it will settle at approximately where it currently is right now for zero warming for the next X amount of years until the Super El Nino.
There has not been a “rising trend” in the TLT in the behaviour of the anomalies as you seem to think. Since 1979 there has been as close to zero warming as what you can get from 1979 to 1997, then a step change in the anomaly post 97/97 Super El Nino followed by another protracted period of close to zero warming as you can get which if the anomaly behaves as it did post 97/98 peak for the 15 Peak, there will be another step change upward followed by another protracted period of as close to zero warming as you can get.
The only statistically significant warming in the entirety of the TLT dataset has occurred as a short burst step change in anomaly trend post 97/98 and if things go as they did post 97/98 peak, another short burst step change post the 15 peak will occur which will not be evident for at least another 2 to 5 years.
If it does, the real work of atmospheric science will be to determine why the energy in the atmosphere released by the oceans during the two Super El Nino’s did not fully dissapate from the atmosphere post those two el ninos.
Where’s my safe room…I mean, we are talking 1/10ths of a degree here. OH MY. TAKE MY MONEY AND FIX IT!
We are obviously basing our conclusions on different data. In the graph Ryan put out, it’s the eighth largest cooling since 79. Since the linked table doesn’t even have column headers or units, I’ll have to defer to the UAH graph.
I have to side with Ryan on this. It is far too soon for any sort of conclusion. Give it another year or if it gets a lot bigger, and I’ll consider it more important. As it is, it’s far too early to tell. We definitely don’t want to jump the gun on this.
and here I thought Ryan finally made a reasonable point…but alas, his self-deception reared its ugly head, again:
“You’re looking at short term fluctuations overlaid on a rising AGW trend.”
AGW trend? Evidence please.
That wriggly red line on the UAH graph, can you see it? Its wriggling up.
Or are my eyes deceiving themselves!
Something is causing that and 30 GT of CO2 might well be the culprit.
Ryan,
From 1999 to 2015, its wriggle trend was down.
Since CO2 increased all during that period, the gain in vital plant food can’t be the cause.
Same as when CO2 grew steadily after WWII, but Earth cooled alarmingly until the PDO flip of 1977.
The AGW hypothesis has been repeatedly busted by Mother Nature’s reality.
You said “A”GW trend.
What does “A” stand for?
Is it something that can be evidenced by the graph alone?
If not, honest liberty’s request is fair enough.
To take an example, if the “A” stood for “anthropogenic”, then clearly the graph wouldn’t be evidence of any such thing, and you’d have beclowned yourself. Merely saying that CO2 “might” have caused it isn’t evidence.
This is not the 1980s for explanations. We have this now….
http://www.climate4you.com/images/NOAA%20SST-NorthAtlantic%20GlobalMonthlyTempSince1979%20With37monthRunningAverage.gif
El Coño remains to be discovered.
An El Nino, by its very nature, is a temporary phenomenon. The temperature goes up briefly and then drops. Always. We have never seen an El Nino that wasn’t accompanied by a drop.
An El Nino involves massive amounts of water sloshing around. link The water can’t pile up forever. It has eventually to slosh back. That’s why El Ninos are temporary. Everything else is a spurious correlation.
Sure, after an El Niño there is always cooling, but as the analysis shows, without a big La Niña afterwards to cool the Pacific surface you don’t get a major cooling.
without a big La Niña afterwards to cool the Pacific surface you don’t get a major cooling
This is verifiably wrong just by looking at the current event.
This is what I am saying. Current cooling is an exception. Another one took place in the 1870s.
All is relative (Quija board Herr Einstein for an explanation). There can be cooling relative to an El Nino peak – but nor relative to the mean, which may still be warming.
Or it can be cooling relative to the mean. (Depending on how the mean is defined, of course – define it one way, there is cooling, define it another, there is warming.)
Did you mean a Luigi Board?
https://youtu.be/15nNY7uofNw
An El Nino is a temporary burst of energy that warms the atmosphere. With the cessation of the warm pulse, you would expect temperatures to naturally drop back to what they were prior to the initialization of that pulse. No need to invoke any other mechanism.
Until temperatures drop below what they were at the start of the El Nino, you cannot honestly declare that we have seen a bout of planetary cooling.
Why? The idea is that ENSO is climate neutral because El Niño and La Niña events compensate each other, not because they revert to baseline. Actually it is said that the 1950-1975 period shaw cooling because of an excess of Niñas that clearly did not revert to baseline. I fail to see why the temperature should drop back to baseline. Plenty of people defend that the 1982 and 1998 El Niño events contributed to the warming, so it must not be that obvious.
It seems to me that a lot of people is ready to defend that if after the big El Niño the temperature doesn’t return to the prior value then it is global warming, and if it does then it is what should be expected. Where is the data that says that all the heat brought to surface by an El Niño must necessarily be disposed off and cannot increase the temperature of the planet?
Stop and think for a second. If you warm something up, then cut back the heat, the something is going to cool.
You don’t need anything to cause the cooling. Radiating away excess energy is what objects do.
The air warms because there is a big pulse of warm water. When that pulse returns to it’s normal temperature, the air will also return to it’s normal temperature.
There is no normal temperature in a warming world. There is no normal temperature to return too. We have no idea of how much cooling should take place after a big El Niño, so the only way to go about this is to compare it to similar periods as I have done.
MarkW Define heat, warm and cool, please. Are you talking Newtons or Celsius. You keep mixing your units as if they are all the same making your statements incomprehensible. Example if I cut back the heat (energy) to boiling water, but not enough to make it stop boiling the water does not cool(temperature). Thus, if you stop and think for a second, using these definitions your statements has been proved by repeatable experiments to be false. This is the problem with climate science most don’t define the units and thus are talking gibberish including “scientists”.
Mark,
One thing about El Nino is that the warm water was already there, but just in a different place, ie piled up against New Guinea and Australia. When the trade winds hold the warm water there in the west, local sea level is higher than in the Eastern Pacific. New Guinea is just south of the equator. The tropical sun heats that mass of water.
When the trades slacken, the warm water sloshes across the Pacific basin, arriving off the coast of tropical South America. Sometimes it only gets as far as the tropical Central Pacific. But off the Americas, it can spread out, cool off and get replaced by cold water.
The other thing is that cool water usually wells up off the South American Pacific coast, and arrives there from Antarctica with the Humboldt Current. This upwelling is what makes the great fisheries there, leading to vast guano deposits, thanks to sea birds’ eating the fish.
So the normal state is upwelling, until and unless the trades slacken. The so-called La Nada is thus really just a less powerful La Nina. The cold water also makes for the desert conditions in coastal Peru and northern Chile (comparable to Namibia and northwestern South Africa).
IMO what causes the trade winds (created by Earth’s rotation, plus oceanic and atmospheric circulation) to subside is the sun, especially its UV component, which makes and breaks ozone. This variation in solar radiation flux affects atmospheric pressure, hence wind strength and even direction.
Please correct me if wrong.
Wrong it is a change in the direction of jet stream that temporarily changes the measured temperatures. You can not measure energy using just a thermometer reading. It is not physically possible. By the way how do you CREATE this burst of energy?
The burst of energy in the air is caused by an increase in water temperatures.
How do you know there has been a burst of energy to begin with?
So water temperature increases, causing the energy in the water to burst into the air, correct? Which would then of course remove energy from the water, so then there should be a corresponding drop in the measured energy of the water. I don’t recall seeing graphs of ocean energy moving opposite of atmosphere energy during these events. If they do exist then that would be a strong indicator your argument is correct. If those measurements show a steady state or rise then either you are wrong or the data is wrong and nothing can be determined accurately.
The ‘planetary temperature’ as measured by who? They all suck rocks. I’ll stick with the UAH for most comprehensive and unbiased look. So it’s clicked up a few 1/10ths…BIG EFFING DEAL. Hate this crap.
Seems obvious to me. the cause is volcanoes and which way the wind is blowing. Now all you need to do is figure out what causes the wind to change direction.
co2 of course!!!!!!!
do I really need to put a sarc tag?
I am not sure if I’m reading between the lines with 20-20 vision, Javier, but are you implying perhaps that the various excuses for cooling periods were invalid, and the claim that CO2 forces warming is likewise at least an exaggerated effect? In other words, nobody has accurately identified the primary cause for the atmosphere’s oscillating temperature?
As Willis argued persuasively, volcanoes don’t explain cooling as has often been invoked by the CAGW faithful. Is there a case of cooling that did not immediately follow a Niño?
I am not going that far. My point is that the current period of cooling is too large to be explained with the usual arguments, and the most likely explanation is that CO2 forcing is overrated and solar variability forcing underrated. That’s already farther than most climate scientists are willing to go, at least publicly.
Heat in, heat out.
Correct – the global mean temperature does appear to drop after an El Nino spike.
I don’t know the reason of course, but I speculate this might be happening:
– the warm water buried in the ocean gets forced to the surface.
– the warm water raises the global mean temperature.
– the warm water cools as the thermal energy is lost to space.
– the now-cool water drops the global mean temperature.
Or it could be air moving molecules from one region to another causing a change in temperature but not a change in energy which is why when the wind changes back so do the temperatures mostly. The temperature swing is way more in one year then projectedCAGW for decades.
I have been saying for a while, no one is looking at the mechanisms that control the temperature anomalies, where and why they vary. They are numbers without any analysis.
Regards
Serously Harry? I think you’re only firing on one otter today
Actually the ‘warm water’ does not come up from below, it sloshes in from the west as the trades weaken…El Nino. Stronger trades pile the warm water up over western Pac and upwelling of colder water causes the La Nina.
Hint, the time-depth-temperature data transects from ARGO do not show warmth “hiding” or “buried” at depth. Why ignore such a marvelous, publicly-funded and high tech ocean temperature measurement system?
“As nearly everybody knows, the planet is warming. Since its short-term rate of temperature change hasn’t changed much, the warming is essentially accomplished because the planet spends less time cooling than warming. Therefore, periods of cooling have become shorter and result in less cooling.”
The above paragraph is nonsense. If you are trying to say that the little bit of warming is the result of massive cooling trying to counteract the even more massive warming caused by CO2, you are dead wrong for a 100 different reasons all delineated here many times by us skeptics. . You offer no new facts and only one new conclusion with no supporting evidence. So I wonder what exactly is the point of your article?
Looks like someone had their sense of irony and humor shot off in the climate wars.
naw, I agree the OP isn’t very well posted.
Yes, the article author is trying to claim cooling causes warming. It doesn’t of course – warming causes warming. But the earth does indeed cool when there is less warming coming in, I accept that.
I imagine all these “cooling” rays coming from the sun, a sort of Mr Freeze effect 🙂
…technically…
Actually in the “race to zero” the winning laboratory used lasers to cool the samples the last couple degrees. Directly. Pew Pew. Cold.
The truth is that there are energy states that cannot be shed until enough heat has been applied and also the old convection rule about using hot water to freeze blocks of ice is a fact.
Hot water freezes faster because it has little air in it, not because it was hot.
The lasers in your example were not adding heat, they counteracted the vibrations of the molecules, cancelling heat.
MarkW
That is not how lasers are used to cool atoms. Quite the opposite in fact. Read a little and you will see how it works. The atoms are hit with energy at one wavelength stimulating them to emit a photon at a different wavelength with more energy than the original input. The results is cooling.
The “hot water freezes’ is also incorrect on two points. Air doesn’t interfere with the freezing of water. Hydrogen bonds do.
http://www.iflscience.com/chemistry/hot-water-freezes-faster-cold-and-now-we-know/
The enthalpy of water that has been cold for a long time is higher than water that was heated then cooled quickly to the same “starting” temperature. The from that point, the water that was heated will freeze faster.
Harry
It is assumed that all tropical evaporation yields 100% heat loss to space. No. The atmospheric system can choke and drop huge volumes of warm rain water.
No one is quantifying earths heat removal efficiency. It is not annually consistant.
Your post does not make any sense, I do not know what you are even talking about.
“Yes, the article author is trying to claim cooling causes warming”
Well, for years alarmists have been claiming warming causes cooling so what’s good for the goose./sarc
Alan,
if you look at a global warming contour map (I posted 2 further down), then you will see that the overall warming rate IS the result of the sum of massive warming, and massive cooling.
I use ruby-red for all warming rates greater than or equal to +5.0 degrees Celsius per century.
I use dark-indigo for all warming rates less than or equal to -5.0 degrees Celsius per century.
The reason that I do this, is because the warming rate from one month to the next, can be very high (like +200.0 degrees Celsius per century), or very low (like -200.0 degrees Celsius per century). The reason that the average warming rate is around +1.8 or +2.0 degrees Celsius per century, is because those very high rates cancel each other out, leaving a small remainder.
“The reason that the average warming rate is around +1.8 or +2.0 degrees Celsius per century, is because those very high rates cancel each other out, leaving a small remainder.”
I think that’s completely backwards. A more obvious way to look at it is that the reason there is a long term average warming rate of around 1.9°C/century is because that is the underlying rate, and the reason you see huge variations over very short periods is because of noise.
It’s inevitable that the high rates cancel each other out because they are not the real trend, just random variation about the true trend.
Bellman,
there is no climate GOD setting the “real” trend.
Every day, over land, the temperature range is about 10 degrees Celsius. That is warming and cooling at a rate of about 730,000 degrees Celsius per century.
The “average” is around 1.9 degrees Celsius per century.
So it is 0.00026 percent signal, and 99.99974 percent noise, from a daily point of view.
And believe me, the warming and cooling EVERY DAY, is REAL.
“there is no climate GOD setting the “real” trend.”
Whatever causes a trend the job of statistics is to determine if a trend actually exists and if so what sort of trend it is. Your argument seems to be that random fluctuations in temperature can cause a non existent trend to appear. This is precisely what statistics tries to avoid with significance testing. If a trend is statistically significant it is unlikely to be the result of random variation.
“So it is 0.00026 percent signal, and 99.99974 percent noise, from a daily point of view.”
Which is irrelevant. The daily seasonal fluctuations make no difference to the average measured over any sensible length of time. Monthly global averages do not vary by 10 degrees.
I was thrown by the wording of that paragraph too.
Planet is warming.
Temp hasn’t changed in short-term.
Planet spends less time cooling than warming. Doesn’t that mean planet spends more time warming than cooling?
Periods of cooling have become shorter and result in less cooling? Doesn’t that mean less cooling results in more warming?
I’m not seeing how the cooling premise stands here.
Now if only someone could figure out what causes the ENSO.
As long as I can get chocolate ice cream, I do not really care which way the thermometer’s readings float. 🙂
Odd of me to respond that way, I know, but – well, that’s just me.
The Southern Oscillation is the key to El NIno’s and La Nina’s.
That changing pressure pattern across 3000 miles of ocean, along with the MJO, alter the normal steady TradeWinds, and thus the wind tension on the tropical Pacific.
Understand the why’s of the SO, understand ENSO.
It’s the sun! A shocker, I know.
http://www.issibern.ch/teams/interplanetarydisturb/wp-content/uploads/2015/01/Asikainen_03_2014.pdf
Both the ENSO and the NAO are driven by solar activity variations.
“an unexplained major cooling “
Hardly unexplained. Everyone expected that a major El Niño, as in 2016, would lead to a high peak in temperature, followed by a decline. It’s the way they work. You’re reckoning this “cooling” from the peak of the El Niño (2/2016). The level after the decline was higher than the level before.
why do you think the decline is over…
…and what lotto numbers should I pick
Correct me if wrong, but hasn’t 2018 been cooler than 2015 in GISS?
In UAH observations, 2018 so far has been slightly warmer than 2015:
Average anomaly of ~0.21 v. ~0.23.
The higher July anomaly accounts for 2018’s slight warmth advantage to date.
Yes, and 2018 so far is higher than 2014 … what’s your point?
w.
My point should be obvious. It’s in reply to Nick’s claim that Earth hasn’t yet returned to conditions before the 2015-16 Super El Nino.
If it hasn’t yet, the trend is clearly down. In GISS, unless it has been “adjusted”, the planet has cooled dramatically since Feb 2016.
We’ll see about 2015 v. 2018 in five months. This year is liable to be cooler, since El Nino was building in the latter months of 2015 (0.41, 0.33 and 0.45 degrees C anomalies for Oct-Dec).
“This year is liable to be cooler, since El Nino was building in the latter months of 2015 “
Indeed, so it isn’t reasonable to use 2015 as the “before” condition. 2018 is well ahead of 2014, and that was a record in its time.
The first half of 2015 is a valid “before” comparison. Even with the current quarter, ie July, August and September. The anomalies for Aug and Sep 2015 were about the same as the average for the previous seven months.
The effect of El Nino became evident in the fourth quarter.
OK, mean Jan-Jun 2015 was 0.8166C (GISS). For 2018, it was 0.8283.
Thanks.
In UAH, average monthly anomaly was exactly the same 0.2183 for Jan-Jun in both years.
H1 2015 was 0.817. For 2018, it was 0.828
H1 2015 was 0.82. For 2018, it was 0.83
H1 2015 was 0.8. For 2018, it was 0.8
Nick, you have failed to say why temperature should go back to baseline after the big El Niño in the absence of a big La Niña. There is lots of extra CO2 in the atmosphere and the planet should be warming, not going back to baseline. What should cause the planet to cool back to the pre-El Niño situation?
Javier,
“What should cause the planet to cool back to the pre-El Niño situation?”
Because ENSO is a well characterised sloshing situation. Here is another post from Bob T, this time Dec 2015, tracking the pulse of warm water that came from the W pacific. It is a finite pulse, and the warmth it brings will mostly pass. And sure enough, Bob’s post was titled “December 2015 ENSO Update – Shouldn’t Be Long Now Until the El Niño Starts to Decay”.
The El Niño cause isn’t just my idea. Here is Roy Spencer’s May 2018 UAH V6 post:Global temperature continues to drop from El Nino induced high.
Nick, I have no problem with a temperature decline after an El Niño, but since you claim to have read Bob Tisdale’s writings you are misrepresenting him, because he defends that after a big El Niño the temperature of the planet experiments a jump (step up). So he clearly does not expect the temperature of the planet to go back to baseline after a big El Niño and you cannot use him to say why you expected temperature to go back to baseline. So you still have not told us why do you think that in a planet that is warming a big El Niño should be followed by cooling back to baseline.
The basic idea is that ENSO is neutral because Niñas and Niños compensate each other over the long term. But what you are saying implies that Niñas are not needed and even if there was only Niños they would still go back to baseline.
“you cannot use him to say why you expected temperature to go back to baseline”
I actually noted that it is still above where it was. But Bob obviously expects a decline, which you say is unexplained. GISS rose about 0.6°C to Feb 2016. If there weren’t a decline from such peaks, warming would be rapid indeed.
Here is a GFDL GCM reproduction of ENSO events. Their pulsatile character is obvious.
Nick, you keep going back to the expected decline. Of course a temperature decline is expected by everybody after a peak in a strong El Niño. That is not what is being discussed. It is your expectation that the decline should go all the way down to the initial temperature prior to El Niño that we are discussing. I was expecting you would back that expectation with some scientific literature on why the subsurface heat brought to surface by an El Niño cannot be used to warm the planet and the temperature is expected to return to the prior state. It looks to me more and more that your expectation is just an opinion not based neither in scientific literature nor in analysis of the data, and thus pretty worthless.
And if there is no expectation that the post-El Niño cooling should proceed all the way to the prior temperature, then it is remarkable that this post-El Niño presents so much cooling without the help of a strong La Niña. What is causing this cooling to be so strong as to make it to the top 6, above the cooling caused by the Pinatubo and Chichon eruptions, that so many articles generated? Why is it stronger that the cooling from big El Niño events that were followed by big La Niña events?
Javier,
“That is not what is being discussed. It is your expectation that the decline should go all the way down to the initial temperature prior to El Niño that we are discussing. “
No, you keep misrepresenting me on that in a way that is obvious. I expressed no “expectation that the decline should go all the way down to the initial temperature”, and I have none. To the contrary, I noted that that hadn’t happened. What is actually being discussed is your claim that since the El Niño peak, there is an unexpected cooling. I insist that cooling was expected, and the magnitude seen is not surprising – and it is less than the prior rise.
Nick,
Then it is you who is misrepresenting me. I haven’t said that the cooling is unexpected. What is unexpected is that we would get a cooling of a magnitude of the top 10 without the help of a strong La Niña. And is unexpected because it hasn’t happened since 1950. It did happen in the 1870’s, but then there wasn’t any significant anthropogenic CO2. Such a big cooling you shouldn’t expect. The fact that is continuing is amazing.
What is cooling the planet now, two and a half years after the big El Niño ended?
Javier,
“Then it is you who is misrepresenting me. I haven’t said that the cooling is unexpected”
Well, the heading says:
“The planet is experiencing an unexplained major cooling “
I actually meant to write unexplained, but I think there is little difference here. It can’t really be expected but unexplained.
“What is cooling the planet now”
I don’t think it is cooling now. As I noted above, the first 6 months of 2018 (GISS 0.93C) is warmer than the first six of 2015, and significantly warmer than 2014 (0.74), which was a record to that date.
Nick, the key word here is major. A cooling was expected, but why should it be a major one? As I have showed, previous major coolings were associated to either strong Las Niñas or volcanic eruptions. Is this so hard to understand or are you just being obnoxious?
Your information is not good. This is yesterday’s output of CFSR courtesy of Oz4caster.
https://oz4caster.wordpress.com/cfsr/
The last time the annual average went down a pixel was a week ago. The cooling is continuing as of now.
Javier,
“Your information is not good. This is yesterday’s output of CFSR courtesy of Oz4caster.”
Well, I do my own plots, collected here. Here are a number of indices, anomaly base 1981-2010, over the last 4 years. Hard to see major recent cooling there.
And more recently, based on NCEP/NCAR reanalysis, from here:
Yes, I know about the Moyhu place although I don’t use it. Your results are similar to others.
The problem is that it lacks the resolution of daily data and that the data is artificially divided in irregular 28-31-day bins incrementing the noise.
Thanks Javier. As a footnote, the daily CFSR global surface temperature anomaly estimate for August 21 UTC at 0.105C (referenced to 1979-2000) dropped to its lowest point since 0.09C for 2015 July 11 and is forecast by the GFS to drop to near or possibly slightly below 0.0C around next Saturday-Sunday (Aug 25-26). If it drops below 0.0C, that would be the lowest since -0.01C for 2014 June 30. Stay tuned the next few days.
The daily values are quite noisy, so I like to look at the 91-day (seasonal indicator) and 365-day annual indicators for longer term trends. The 365-day centered running mean is still about 0.2C above where it was at the beginning of 2014. If it continues falling at the same rate as over the last 6-months, it will drop to about 0.1C higher than that level in about another 6 months (early 2019). It would have to continue dropping at that rate for another year or possibly a little longer (late 2019) to reach the level of early 2014. If that happens, it will truly be back to where it was during “the pause”. Time will tell.
Thank you Bryan,
I also like following the annual mean and the recently added seasonal mean. The trend is clear and the only question is when it is going to stop. It has already been longer than I expected, and sooner or later it will stop. The graph in the article shows that 3 year-long cooling periods are very rare, and 4 year-long cooling periods have not taken place since 1950.
Graphical analysis of your data, as I learned to do in investing. It will tell when there is a significant deviation from current trend.
The CFSR estimated GMSTA dropped to 0.01C today (2018 Aug 25) referenced to 1979-2000 and this ties what was last seen on 2014 November 28. This recent downward spike was led primarily by very cold Antarctic temperatures and is weather related. However, the continued overall downward trend may be a hint that GMSTA will be slowly dropping back to 2014 levels at the tail end of “the pause” over the next year or so.
It will also help 2018 be 4th warmest behind 2015, and that is also good to reduce the level of climate hysteria in the media.
1998
Nick just so we can be clear about this. Do you agree that John Christy and Roy Spencer would never fudge the UAH figures? Because if the climate was truly headed for disaster and they knowingly made things look like everything was all right that would be like committing suicide or treason, right? Therefore we can all keep debating with bated breath on the UAH results. Climate science will live or die on the UAH satellite data cause its the only data that both sides trust? Correct?
I don’t imagine scientists ever fudge temperatures. They try to get them right. But satellite measurements are intrinsically unreliable, as shown by the very big changes that both UAH and RSS have made in recent years.
Well, if as you say the satellite measurements are intrinsically unreliable and since the surface data is incomplete, contested, contaminated by heat island effect changes and time of observation bias, and subject to a variety of interpretations, it might be more productive call the whole warming debate off and admit that nothing in the data so far indicates climate catastrophe is immanent. But of course, it’s a lot of fun arguing and disagreeing and pondering how the earth’s weather and climate system is ticking over.
There hasnt been any UAH adjustments since they found that the satellite was losing its orbit position. Since then everything has been fine and that problem won’t resurface now that they are aware that every satellite does this. The RSS changed their figures to be more in line with the FALSE groundset data. They were pressured to do so. The UAH dataset now stands as the only dataset that skeptics will trust. If alarmists wont trust it then we cant argue about temperature. Then lets argue about some other data that is proving that global warming exists. I have been looking for it for 30 years since Hansen’s testimony and I havent seen it yet. The ball is in your court Nick. Your task is to prove that the null hypothesis should be rejected. To date I haven’t seen any evidence that would reject it.
Nick writes
IMO this is because the structure of the atmosphere is changing and the models used by UAH and RSS only work for a short time. But if you can’t reliably measure it when you have the opportunity to calibrate (and do) then what value can you put in a GCM’s representation of the atmosphere as it evolves?
For the complete picture:
(July- +0.02 vs. June) is included. I don’t see any cooling!
But you did see the previous warming, didn’t you? That is called selective perception. It is a bias.
No, I see the warming from 2014 on to the beginning of 2016 and a ( smaller) cooling since then. Overall: warming since 2014 and not cooling!
It is a well known fact that trends are absolutely dependent on starting and ending points. You have chosen a starting point that allows you to ignore the cooling it is taking place. Because cooling is any decrease in temperature, even the one that takes place from day to night.
I have chosen a trend that maximizes the change in global average temperature by choosing the last local maximum (Feb 2016) and following the trend until the next local minimum whenever it takes place. A cooling it is even if you don’t see it.
No. It is not the way they work. Only Niños that are followed by strong Niñas make it to the list of top periods of cooling… except 2016.
shhh…if it had been two back to back El Ninos that lasted for ~5 years…..everyone in Nick’s world would have expected that too
The bigger the El Nino, the bigger the subsequent cooling.
I’d like to see a plot for that.
Here is just one example of Bob Tisdale, at WUWT, predicting just such a decline of temperatures following the El Niño peak. No-one disagreed.
He probably expected a big La Niña that has not taken place. Such cooling without a strong La Niña and without a strong volcanic eruption is UNPRECEDENTED
He whose name shall not be mentioned predicted this hot dry summer across N America 15 years ago, based on the solar jerk. He also said it would be cooling. Both of these occurred: an El Nino Modokai following a major El Nino during a period of cooling.
Obviously the Modokai will end, the cooling will continue after the current perturbation. Cooling will continue for another seven years then there will be another hot year.
It is therfore conceivable that the cooling duration could be 60-80 months. Wouldn’t that be interesting?
Voldemort is now involved in climate forecasting? Sheesh, I knew that guy was not to be trusted
We have seen times of low solar activity in the past. Why did that not cause cooling?
Next, using a smoothed time series as input to a calculation is a big no-no, as explained here and here.
It gets worse. Using a centered smoother instead of a trailing smoother brings in information from the future … a very, very bad idea for anything but display purposes.
Next, solar activity has been dropping since about 1980, but overall temperatures have continued to rise. See the data that you are using for evidence of that … if solar is the cause, why would it be warming overall while the sun is cooling overall?
Finally, we have seen dropping temperatures since the last big El Nino event, just as with the previous El Nino events … so despite the “no La Nina” mantra, it is indeed the result of the El Nino/La Nina pump at work.
But heck … other than those five gaping holes in your argument, you’re doing well …
w.
They are holes to you.
If you are worried about my use of averages redo the calculations with your averages and discuss the differences you find. Otherwise it is just armwaving.
Next, I already showed you that solar activity has not been dropping since 1980. We need to review it to fix the information.
PMOD TSI
F10.6 Flux and EUV
You should abandon those old fake memes.
Finally, show me a big El Niño in the last 70 years that was not followed by a big La Niña and yet showed a big temperature decline like the one we are seeing. I guess not.
The current definition of “La Nina” is goofy. “La Nina” is a temperature drop in the Equatorial Pacific from November of one year to November of the next year, as shown below.
And yes, Javier, there was a large La Nina drop following the 2015 El Nino, larger than most in fact. So OF COURSE we’d expect a global temperature drop to follow that La Nina drop. Read’em and weep …
w.
Javier, let me add the following:
AS EXPECTED BY EVERYONE … well, everyone but you I guess, global temperatures started dropping about three months after the November peak of the 2015 El Nino … do you truly think this was just a big coincidence?
w.
As above, peak was in February 2016, so temperature started dropping in the next month, ie March.
I see you have to move the goalposts.
The first Niña conditions in 2016 were just 3 months below -0.5°C anomaly in Niño 3.4, and the second Niña period in 2017-18 barely fitted the definition of a Niña event (5 consecutive periods of 3 months below -0.5°C).
https://www.esrl.noaa.gov/psd/gcos_wgsp/Timeseries/Data/nino34.long.anom.data
Not a single month reached -1.0°C.
Both the MEI and SOI indexes show very weak Niña conditions after the big El Niño of 2015-16.
So no Willis, there was no large La Niña following the 2015-16 El Niño.
Good for you if you expected the cooling, but even then, it remains unexplained. Clearly the sixth biggest cooling in the past 70 years was not caused by a big La Niña.
No it was caused by two consecutive minor La Ninas separated by a short El Nino pulse and the fact that the strong 2015 El Nino was over.
When you take your foot off the accelerator, do you ask why the car is slowing down? It’s no mystery as to why after three consecutive El Ninos, and with the last being a major one, there would be cooling afterwards.
According to BOM, there has not been a La Nina following the recent strong El Nino.
ENSO has, on a couple of occasions, flirted with being a La Nina without ever quite crossing the threshold.
I haven’t checked, but if I recall correctly NOAA did declare a La Nina, for a month or so, but BOM did not.
Isn’t it the case that during the satellite era, ENSO has not been neutral in the sense that there have been more El Ninos than La Ninas and/or the strength of the EL Ninos has been stronger than the strength of the corresponding La Nina? If that is indeed the position, then one might expect to see a slight warming trend during the satellite era reflecting the positive contribution ENSO has been making.
There’s one basic problem with your reply.
Temperature at sea level is regulated by gravity and the Earth’s atmosphere has been shrinking. The specific heat of a mass of air changes with the density but we only ever measure the pressure… which is NOT interchangeable in reality.
The atmosphere is shrinking? Do tell. And show some evidence, please.
The earth has a thermal lag, the low time between solar cycles is not long enough to have much of an impact.
The latest cycle is however weaker than the several that preceded it.
Exactly, solar flux is a slow variable for the variance in irradiance that has been measured so far.
Not to disagree with you main argument, but,
“Next, using a smoothed time series as input to a calculation is a big no-no…”
That’s only true if you are using the smoothed series as input to something like a linear regression. What Javier seems to be doing is much cruder, looking at the difference between a peak and a trough. In that case using a rolling average is much better than using individual months.
“It gets worse. Using a centered smoother instead of a trailing smoother brings in information from the future…
It makes no difference if you use a centered or trailing smoothing. All using a non-centered average would do would be to shift the dates by 6 months.
Better look at the AMO not-detrended chart again with the update through July. This and solar minimum should not be overlooked.
I agree. Who estimates a high influence of solar forcing MUST estimate a very high sesitivity of the temperatures vs. CO2 with the given T-record since 1990 or so. This is the dark side of the sun…
I disagree. That statement carries several assumptions that are likely not to be true. Those that repeat it are usually unaware of said assumptions, as they rarely have critically examined the question.
Javier, if you specified the exact “assumptions that are likely not to be true” instead of just waving your hands and pointing, you might get some traction …
w.
I wanted people to think by themselves to see if they could spot the undemonstrated assumptions in that statement, but I guess that is too much to ask from some people so I’ll put the spoiler.
1. Assumption that the effect of solar variability on climate is mediated solely by changes in TSI. Thus given the small changes in TSI the climate needs to be very sensitive to small changes in top of the atmosphere energy changes that would make it also very sensitive to changes in GHGs. However there is ample evidence well reflected in the literature that the climate is quite sensitive to solar variability in other parameters, like UV and IMF that change a lot more than TSI.
2. Assumption that the effect of solar changes on climate is nearly immediate, and that it doesn’t slowly accumulate over decadal and multidecadal periods leading to a non-linear response, as again multiple evidence well reflected in the literature supports.
So in essence the statement that “a high influence of solar forcing MUST estimate a very high sesitivity of the temperatures vs. CO2” is only true if the Sun obeys a limited conception on how it should act on climate. If it doesn’t, and it is very likely that it doesn’t, then it is just an empty statement that denotes a limited conception of a very complex issue.
The cooling is a persistent temp flat period lasting until 2040 AD.
Reasons, driving forces, period duration, variables — all explained
in PART 8 of “Climate pattern recognition 1600 AD to 2050 AD” in:
http://www.knowledgeminer.eu/climate-papers.html
Therefore, temps will stay within a horizontal flat Nino/Nina range. Some
slight cooling might be expected caused by the low sunspot number, but
nobody demonstrates a calculation of how many sunspots cause how
much cooling/warming. Willis pointed this out a number
of times. Better visit the above quote. JS.
Nobody has actually proven that sunspots mean ANYTHING to Earth’s weather. Correlation is not causation and historically the count has been less accurate than the temp of bathwater in the same eras.
Low solar activity – Zharkova’s work shows fairly convincingly (her data matches the past 3000 years of solar activity) that we’re heading into at least 2 very low solar cycles 0 SC25 looks like a non-event completely and SC26 lower than the current SC24)
https://arxiv.org/pdf/1705.04482.pdf
Earth’s magnetic field is crashing – the field strength has dropped precipitously over the past 20+ years, even faster than the 20 years prior to that. One might see it as asymptotic.
“Previously, researchers estimated the field was weakening about 5 percent per century, but the new data revealed the field is actually weakening at 5 percent per decade, or 10 times faster than thought. As such, rather than the full flip occurring in about 2,000 years, as was predicted, the new data suggest it could happen sooner.”
The solar system is leaving the shelter of the local supernova cloud – we’ve been cruising inside a shield of supernova remnant, protected from a large part of the GCR’s (Galactic Cosmic Rays) that affect our weather so strongly. (Svensmark and CERN CLOUD research)
https://www.newscientist.com/article/dn24153-solar-system-caught-in-an-interstellar-tempest/
The triple whammy of GCR increasing events could easily see us heading into a major ice age instead of just a new LIA.
And if any of the nutjob priests of AGW get to do the garbage they have been muttering about (polluting the sea and sky to deflect solar rays even MORE) the ‘major’ part of that would become almost a certainty.
And while it is tempting to say we need more CO2 to shelter us, the logarithmic response to increased CO2 and the almost saturation point already achieved would suggest that’s as useful as tits on a bull.
“Low solar activity – Zharkova’s work shows fairly convincingly (her data matches the past 3000 years of solar activity)”
Sorry – but it doesn’t ….
http://www.leif.org/EOS/1512-05516-Zharkova-Fail-by-Usoskin.pdf
https://wattsupwiththat.com/2017/06/06/solar-update-june-2017-the-sun-is-slumping-and-headed-even-lower/
Come on, everyone knows that the polar ice caps are melting and the Greenland glaciers are receding at the rate of a gigaton per day, and all that ice water is flowing into the oceans and cooling things down all over the planet. It’s not rocket science, deniers, just basic physics! And just as well it is happening too, otherwise the excess heat from all those extra CO2 molecules would have made most of the planet uninhabitable by now
[???? .mod]
Ha Ha
I am sure “Colin” forgot the #sarcoff tag…I’m sure!
Low solar activity? That’s a bit rational isn’t it? This is Climate Science we are talking about….
Nature’s quasi-cyclic meandering of many parameters within the chaotic climate system command how the solar energy reaching earth is used and dispersed. Currently the outcomes seem to indicate the initialization of a planetary cooling regime. For how long and how cold — who knows?
We live in interesting times, and would appear to have an interesting future coming.
The top figure blob of data points is not a good linear fit with variation at a temperature across the entire graph. for example, at -0.3C.
No, because the cooling rate is not fixed. However the tendency is that longer periods of cooling tend to produce bigger temperature drops, as it is obvious.
Except a few years ago when the N. Hem. Krafla volcano blew in Iceland sending plumes of ash across Europe.
My better angels say to stay away from this one.
But Enough is Enough.
Javier says:
“While it is true that the end of an El Niño should cause a reduction in the warming rate just due to the disappearance of the warming cause and a drop in temperatures as the lingering heat in the atmosphere leaves the planet, this should not cause in any way a major cooling in the top 6 of the last 70 years.”
Dead wrong.
In several cases of La Nina cooling following the El Nino warming, this happened:
The majority of the cooling happened before the La Nina developed. The La Nina events are not the sole cause of the cooling. They may not even be the primary cause of the cooling. Some people seem to think that heat transport to the polar regions, then out to space might have something to do with it.
But that is none of my business.
that’s because La Ninas are the result…not the cause
Yet you still have to explain why the biggest cooling periods that do not coincide with strong volcanic eruptions do coincide with strong La Niña events. You say the cooling is not related to La Niña yet this contradicts the data that shows global surface temperatures following Niño regional surface temperatures with a delay. Clearly La Niña has an influence on surface temperatures as El Niño does.
Now you are being somewhere between obtuse and deliberately disingenuous.
You say:
“You say the cooling is not related to La Niña”
I really said:
“The majority of the cooling happened before the La Nina developed.”
That means *some* cooling is not related, *not* all the cooling is not related.
Not the same thing at all, is it?
Be more accurate, be more careful. It is no wonder that Willis E. often admonishes us to:
“Quote my *exact* words”. Please do so in the future.
Do you know what Maslow’s Hammer is?
Then we are agreeing. If part of the cooling is associated to La Niña, and there was no strong La Niña, then that part of the cooling is missing and the current cooling should have not made it to the top 6.
http://www.spaceweather.com
Indicates we are having very few sunspots so far this year.
At least I am not alone in being cold. So far this August our minimum average temperature is running about 8C colder than August 1973. Broome in Western Australia has changed from subtropical to a Mediterranean climate this month.
The maximum this month is running 3C below last year.
Please, bring warming back.
An interesting article.
Global Warming Contour Maps provide another way to see these cooling periods.
I must apologize, I left my contour map covering 1880 to 2018 at home. But I have my contour maps of the northern hemisphere, and southern hemisphere, from 1970 to 2018, on me.
I quickly added labels for the 7 cooling periods that Andy May listed, that occurred after 1970.
You can see how the labels point to “blue” cooling periods, on the contour maps. You can also see the relative size of the cooling period in the northern and southern hemispheres.
If anybody wants to see the legend for Global Warming Contour Maps, it is here:
There are a lot more contour maps on my website. Recent additions include regional warming, and seasonal warming:
https://agree-to-disagree.com
Sorry Javier, I got your name wrong in my post.
What do you think of the “blue” cooling periods in the contour maps. Being “visual”, it is easy to pick then out from the “red” warming periods.
It also supports your idea about spending more time warming, and less time cooling. But you need to be careful about this, because you need to take the magnitude of the warming rate, and the magnitude of the cooling rate, into account.
Javier …. I have a question. When you say cooling, i’m curious as to in reference to what? Are you saying the cooling began at an El Niño peak? …. or are you saying it’s cooled in comparison to the point prior to the occurrence of El Niño? I ask this because in my mind, “cooling” means a change in direction of the smoothed curve. A 0.25C decrease in temp from the peak of an El Niño is a pretty meaningless metric. In contrast, a 0.25C cooling from the smoothed temp that occurred just prior to the El Niño would be considered a bonafied cooling.
We measure changes in temperature that we call anomaly. When the changes are negative it is cooling. When the changes are positive it is warming. Then you choose every relative maximum and measure cooling to the next lowest minimum.
It doesn’t seem you filtered out the impacts on anomaly from changes in ENSO, based on your statement that x nu,bet of cooling events were due to La Niña, or volcanos. Like I said,…. a 0.25C cooling from an El Niño induced warming of +0.3C = a net 0.05 warming. I’ve seen graphs where they filter out the effects of El Niño, and volcanic activity and it would seem to me that if you are going to approach the subject from the perspective of anomaly, you need to use an anomaly that is not contaminated by known phenoms that influence temperature. It’s like the “pause”. There were all kinds of El Niño’s and La Nina’s within the pause, but the least squares analysis determined no net warming for x amount of time. I’m not sure we’ve made it back down to the pre El Niño temp yet. … but I’ll have to back and look at that one.
I don’t want to filter out any cause. I want to compare cooling periods regardless of the cause. The present cooling period stands out because it shows a different attribution.
Yes , I understand that. And I like the idea. I’m just trying to give you a suggestion to make your cause stronger. If I throw a ball up in the air, it will fall back to the ground due to gravity. That is kinda what I feel about the cooling of the anomaly from the peak of El Niño back to where it started.
I expect articles on this blog to claim black is white, but this one is exceptional. “Cooling” is a relative term. In this case the cooling is coming off peaks of warming – to go and claim this means the earth is cooling is just silly.
Also the “scientists are ignoring it”. Hard to fault the scientists for ignoring something that is not happening.
You mean it is not happening because the temperature has not decreased enough or for a long enough period? Where is the boundary when it starts happening if it continues?
The boundary? You tell me, you seem to be cherry-picking them where you want to.
Look, I get it. You wanted to write an article that claims “cooling”, then try to link it to the sun, then try and claim scientists are ignorant. It’s propaganda – you write the stuff then the platform publishes it. Or “fake news” as our Fearless Leader calls it. It’s a funny business.
I already told you. This is the sixth biggest cooling of the past 70 years. It is significant at the decadal scale by definition. As the planet is warming, the biggest periods of cooling need an explanation. Two periods of cooling that were smaller, during Pinatubo and El Chichon eruptions generated a huge amount of scientific literature because the cause is known. In the current cooling the cause is unknown. It should be investigated.
Harry,
The now trend is that Earth is cooling. That’s simply a fact. A trend lasting two and a half years isn’t meaningless.
We’ll see how long it lasts before reversing. Then you can decide whether it’s silly or not.
However, if, as The Team insist, CO2 be the control knob on climate, why should there have been any cooling periods since carbon dioxide zoomed upward after WWII, steadily increasing for 73 years now, with the possible exception of after major volcanic eruptions?
Yet, Earth cooled dramatically for the first 32 years after WWII, despite steadily climbing CO2. Then the PDO flipped in 1977, and the planet warmed slightly for about 20 years. Then, again despite even more rapid increase in CO2, global temperature, as nearly as it could be measured, stayed flat, until the recent El Nino.
Obviously, CO2 is not the control knob. Indeed, its effect is at best negligible. Thus, no worries. It’s all good. The world’s plants thank us for the free food.
A two and a half year trend eh? You might want to calculate the confidence interval on that one. I am always amused by people seeing “patterns” in short-term noise.
CO2 appears to be the control knob on global temperature. Go watch Dr Richard Alley’s presentations on why the climatologists think that.
The ice free Arctic is the equivalent of leaving the greenhouse door open!
The major cooling is because IT WAS SO WARM, The last el nino was something not recorded a DOUBLE YEAR NINO with year 2 a super nino after a weaker year 1. This pumped immense amounts of water vapor into the air, spiking temps. If you look at UAH, it is true the cooling is very large, BUT IN RELATION TO PREVIOUS EL NINOS, WHICH WITHIN 3 YEARS HAD RETURNED TO NORMAL OR BELOW FOR A TIME, this one has a record high temperature in the wake of it, In short, the cooling is simply the planet trying to get back to average, and the counter to this argument about how cool it is, is that for the first time on UAH data, we HAVE NOT HAD A MONTH RETURN TO NORMAL AFTER THE EL NINO! I am not trying to be a party pooper, but we must face the fact this last super nino, like the 97-98 el nino, may be signalling a new pause point but higher than the one before, Please look carefully at Dr Spencers charts and you will see plainly what I am saying, In all previous el ninos, within 2 years, at least one month had dipped to below normal, Nothing has been under .2c in the wake of this last one. It is all natural IMO, but its there to see http://www.drroyspencer.com/wp-content/uploads/UAH_LT_1979_thru_July_2018_v6.jpg
Joe, I think you are wrong on this one. The fact that the cooling has taken place without an accompanying La Niña means the Pacific has not increased its subsurface energy as much from enhanced solar irradiation due to La Niña conditions of reduced cloud cover.
I have already presented this analog several times. It might very well show what could be expected to happen.
That was another big El Niño that was not followed by a strong La Niña.
Regarding the attribution of the cooling, you have no way of knowing how much is due to reversion to the mean and how much to other causes like low solar activity. What I do know is that of the biggest ten temperature drops of the past 70 years this is the first one that is not accompanied by a strong La Niña or a strong volcanic eruption. A reversion to the mean is therefore not a good explanation.
Eeekkk!!!!
“MONTH RETURN TO NORMAL” and
“dipped to below normal”
I hate to sound pedantic, but this terminology make it sound as if we are in a persistent ABNORMAL state.
Would the term “average” serve better? The use of the term “normal” when “average” would be better, seems widespread.
Otherwise, exactly so. I do watch the UAH charts, and that is exactly what I see.
Joe Bastardi
OK, so let me ask this question: We have seen a 60-66 year short cycle in global average temperatures, apparently superimposed on a far longer 900-1000 year long cycle (Minoan Warm Period, Roman Warm Period, Medieval Warm Period, Modern Warming Period.)
Do the La Nina-El Nino’s perhaps NOT “add up” to zero effect over time?
What if the observed short cycle of 60-66 year are actually a period of repeated El Nino “ramps and flats” raising global average temperature slightly higher over 30-33 years, then a 30-33 year of more frequent La Nina events when temperature drops are more frequent?
Are El Nino-La Nina oscillations documented well enough from 1860 through 2018 to prove, or disprove, this process?
One would need only a 3:2 ratio to raise temperatures incrementally, then a 2:3 ratio to lower it again – assuming even that the two ever did “cancel each other out as assumed by the CAGW alarmists. After all, something is causing the 1000 year long cycle in global average temperature.
https://judithcurry.com/2017/12/02/nature-unbound-vi-centennial-to-millennial-solar-cycles/
Javier writes:
“Regarding the attribution of the cooling, you have no way of knowing how much is due to reversion to the mean and how much to other causes like low solar activity.”
Low solar activity promotes El Nino conditions.
I think the reason the “cooling periods” are bigger is because the warming periods are bigger. The swing of the pendulum, and damping; a system using feedbacks to correct itself.
I am having trouble understanding this post, or is it a joke ?
I see now, sorry I was tired.
Cooling since 02/2016, very interesting.
Jeff ==> Wake me up when the lines goes negative…then I’ll listen
Okay, set your alarm for six months.
Hi Javier. An interesting challenge to the mainstream media. I hope they notice. My favorite cause for this cooling is the continuing decline in obliquity. It was about the Minoan Warm Period when obliquity went from adding heat to the Northern Hemisphere to adding heat to the southern hemisphere.
.
.
For the last three thousand years, Since 1000 BC, the end of the Minoan Warm Period, the global temperature trend has been -0.5 to -0.7 dgC per 1000 yrs, projecting full glacial of 8 dgC in another 7,000 yrs. Another clue, the obliquity dropped below 23.5 degrees around 1300 AD, the onset of the Wolf Minimum. Now the glacial cold lurking in the deep ocean, held in check by obliquity for 10,000 years, has been set free, ending the Holocene Interglacial. We are in the transition zone to glacial cold, expect Finoscandian ice sheets to start in 2000 yrs.
.
.
Sandy,
Minister of Future
Sandy, the decline in obliquity is taking energy from the poles and adding it to the tropics. But the change is too slow to be noticed in the centennial scale. Precession has been taking energy from NH summers and autumns and adding it to NH winters and springs, and the opposite in the SH, so the NH summer position of the InterTropical Convergence Zone (ITCZ) has been migrating South, with important consequences for climate.
This figure I made attempts to explain this complicated processes and the effect they have on climate.
“My favorite cause for this cooling
And your favourite cause for the warming?