Solar cycle 24 has seen very low solar activity thus far, likely the lowest in 100 years.
Guest essay by David Archibald

Figure 1: F10.7 Flux 2014 – 2017
The F10.7 flux shows that over the last three and a half years the Sun has gone from solar maximum through a bounded decline to the current stage of the trail to minimum. Solar minimum is likely to be still three years away.

Figure 2: F10.7 Flux of Solar Cycles 19 to 24 aligned on month of minimum
Solar Cycle 24 is sitting at the lower bound of activity for solar cycles back to 1964, the start of Solar Cycle 19. From here to minimum though, it looks like Solar Cycle 24 will have much lower volatility than the solar cycles that preceded it.

Figure 3: Oulu Neutron Count 1964 – 2017
According to Svensmark’s theory, the neutron flux, with its effect on cloud cover and thus the Earth’s albedo, is one of the bigger climate drivers. For Solar Cycle 24, the neutron flux duly turned around and starting rising again in 2015, one year after solar maximum. It is a safe bet that the neutron flux is heading for a record high at solar minimum (+ one year) relative to the instrumental record.

Figure 4: Oulu Neutron Count aligned on month of solar minimum
The last weak solar cycle was Solar Cycle 20 which caused the 1970s Cooling Period. From the same stage in that cycle the neutron count flattened out to minimum. That could happen for Solar Cycle 24 but it is more likely to keep rising to minimum as 23 did and thus we can expect a count, at the end, of over 7,000.

Figure 5: F10.7 Flux and Oulu Neutron Count 1964 – 2017
If we conflate the F10.7 flux and the Oulu neutron count inverted, that shows they tracked each other closely up to 2004. Something changed in 2004 and since then the neutron count has been higher relative to its previously established correlation with the F10.7 flux.

Figure 6: Ap Index 1932 – 2017
Figure 6 shows that what changed in 2004 was the magnetic output of the Sun, shown in this instance by the Ap Index. Prior to that, there seemed to be a floor of activity at solar minima, just as the floor of activity for the F10.7 flux is 64. Three years to minimum and the Sun is now back to that level.

Figure 7: Solar Polar Field Strength 1976 – 2017
The best predictor of the amplitude of the next solar cycle is the strength of the solar polar magnetic fields at solar minimum. Figure 7, from the Wilcox Solar Observatory, shows that the solar polar magnetic fields at minimum have been weakening with each successive cycle.

Figure 8: Solar Polar Field Strength aligned on minimum strength at solar maximum
Solar Cycle 25 started from the blocks looking like it was going to be very weak and fulfill the prophecies of those predicting a Maunder-like experience for the 2020s. Then after a couple of years it caught up with Solar Cycle 24. Looking back over the previous three cycles, the solar polar field strength at this stage, three years before minimum, has been close to the value at minimum. On that assumption, Solar Cycle 25’s amplitude is likely to be two thirds of that of Solar Cycle 24, and thus 60. Further climatic cooling is therefore in store.

Figure 9: Sunspot Area 1985 – 2016
NASA has deigned to give us another nine months of sunspot area data by hemisphere, up to September 2016. The strong asymmetry between the northern and southern hemispheres continues. The fact that the hemispheric peaks of the last three cycles align indicate that there is a multi-decadal force operating in the vertical dimension. The chance that two sets of three points line up exactly by themselves is infinitesimal.

Figure 10: Hemispheric Sunspot Area and F10.7 Flux
As shown by Figure 10, total sunspot area tracks the F10.7 flux closely.
David Archibald is the author of American Gripen: The Solution to the F-35 Nightmare
“Solar Cycle 25 started from the blocks looking like it was going to be very weak and fulfill the prophecies of those predicting a Maunder-like experience for the 2020s. Then after a couple of years it caught up with Solar Cycle 24.”
How can this be possible when we’re still in solar cycle 24?
It’s the fiscal solar cycle 25
underrated
I believe he is referring to the predictions for cycle 25.
The trailing shoulder of one cycle can overlap with the leading shoulder of the next such that the minimum between is the sum of the two. Drawing smooth curves reveals the overlap; but, how do they know the smooth curves are there?
When solar cycles are small, the sunspots of the waning cycle can go to zero before the new cycle’s sunspots pick. [The waning and waxing curves are smooth curves.] This happened between solar cycle 23 and 24. In 2006 I taught my Physics class about sunspots and how to view then and there were none to be seen for the next at least two years.
Does anyone have or has anyone seen an update on this graph?

I’d have thought if the situation changed there would be a new plot but I am unable to find one.
In short it shows how the SC25 preconditions are simply not present (as of 2011) and suggests SC25 to be a non-event.
Valentina Zharkova’s twin ‘heartbeat’ chart shows a similar prediction for the coming cycles. She is careful NOT to predict an LIA but the conditions seem similar.
Don’t people have eyes in their head. Zharkova’s plot is nonsense, plain and simple. Completely wrong in the timing of everything.
After reading that through a couple of times, I almost think I understand what he meant, but the entire paragraph under the heading “FIgure 8:” is incomprehensibly written and should be redone.
That’s what I wanted to ask, but I figured the author must know what he is talking about. Anyway, you’ve raised an excellent question that should have been addressed in the article.
It is the ‘Solar Polar Field Strength’ that is being referred to. Related to, but a precursor to, the coming cycle, so it is the condition ‘Pre – cycle 25’.
Thanks David, looks like a lot of work has gone into this. I guess Leif will be along throwing stones soon. To a layman like me, this is looking like a cold episode has already started. it sure feels like it down under. But then, it’s still only weather. https://pindanpost.com/2017/06/06/the-looming-cold-in-oz/
Up here in Northern California, temps have also undergone a noticeable change for time of year as compared to the last 6 years. Interesting to note that 3 times in the last month Intellicast and others have forecast high 90s F temps which never materialized. I wonder if the missed forecasts had anything to do with global warming on the brain for the forecasters.
We’ve had the same in the UK, regular forecasting of temperatures which have not been achieved. I suspect it is due to forecasting programmes being tuned towards ‘hotter’.
Despite a Met Office claim last week of ‘record’ May temperatures – when I check temperatures for the last 12 months locally there is a significant decline (looks in the order of 2 and 3 degC)ion the average maximum between May 2016 and May 2017.
These temperature records are for Bracknell, Berkshire where the Met Office was long-based until moving to Exeter a few years ago. Other UK areas can be selected using the site’s main pages but the local one to me is here : http://www.weatherfamily.org/bracknell/graphs/graphs.php (select May 2016 to May 2017 and average daily maximum and minimum)
It looks like a similar situation in the arctic. Here’s a link to graphs of the arctic temperatures since 1959.
For the last month or so the arctic has been somewhat colder than normal. I haven’t looked at all the graphs but, for all the ones I have seen, that’s remarkable. As we enter the melt season, the arctic temperatures cleave very closely to the average.
Notwithstanding the above, one season does not make a climate trend.
I have been watching that. I wonder what Griff thinks about that after all of his prior dire warnings of warming signs in the Arctic.
I wonder what connection there might be to the below average temps and the 140+ Gt above average snow sitting on Greenland. I would bet that we are witnessing a sea change, a pivotal moment.
@commieBob – it is closer to two months than one. If you look at the whole record since 1959 this is unusual. I’m avoiding the word unprecedented. Some observers keep saying Arctic ice is growing, but I am just seeing a melt slowdown on the NSIDC graphic.
I’m in East Texas – the first week of June is usually when we start wondering when the first 100 degree temps are going to show up. Today the high will be 85, tonight it will drop to the low 60’s. It was cool all the way through May, too. It’s absolutely marvelous! Thing is, June in Texas hasn’t usually been the poster child for pleasant, cool weather.
At the height of the great 2011 drought here, ranchers were having to truck hay in from hundreds of miles away to keep their animals alive. This year it has been so wet and cool that truckloads of hay can be seen sitting in fields with hand drawn for sale signs, very cheap to anyone who wants to pick them up. Growth has been so heavy that already storage facilities for that stuff are full to overflowing.
But according to the widely-followed Central England Temperature series (CET), spring 2017 was the warmest in the 360-year record.
Perhaps anecdotal evidence of a few days at one site can be misleading
That is not surprising as look at the above average ssta sitting off in the Atlantic. Looking back at my daily Tropical Tidbit collection the ssta went positive in your area on May 1st, increased in warmth day by day to where there is now a decent little hot spot surrounding the UK. That should be the immediate cause for having above average temps, imo.
Here is the current picture, …http://www.tropicaltidbits.com/analysis/ocean/cdas-sflux_ssta_global_1.png
Richard Barraclough said “Perhaps anecdotal evidence of a few days at one site can be misleading”.
Even hard evidence from one site can be misleading. Consider this proof of global cooling: The hottest day on record (117 degs F) in my hometown in N. Idaho was set in [drum roll] … 1962. I was only 7 years old, but I recall it vividly, as we were driving in a car without A/C to stay at a hot springs resort – I kid you not.
@ur momisugly Brian…the daily historical records for Northern California show that the 1950s’60s hold most of the records for low temps in this area perhaps in the region as well including where you are. For example June shows that 18 low temp daily records in June were from the 1950s/60s, and 9 of the high temp records are in June. May shows 15 record low temps from the 1950s/60s, while April holds 12 low daily records. July holds 18 daily low records from back then. Every month of the year shows a similar pattern.
If they say it and believe it – it must be true!
In their spirited support of global warming, forecasters routinely over-estimate tomorrow’s temperatures.
Question: does the estimated temperature or the actual temperature make it into the record books?
Last year this time (in southeastern Washington State) I was already picking my Tayberries. This year, they look to be about 2 weeks behind last year’s ripening. The wheat field also appear to be behind last year’s rate of ripening.
In the south 100 mi from the gulf coast it was 59 Thursday morning which is unbelievably cool for this late in June.
don’t criticise Dr. Svalgaard on the basis of what you imagine he say in the future. Most unreasonable.
Whether it took a lot of work to put unscientific eye-balled lines on some graphs is questionable. I would have preferred some kind of documented and reproducible method.
Perhaps, but this data at least is credible. Contrast this to the CO2 Climate Change cabal: they have consciously skewed their data to support their Global Warming theory. No wonder one has to find this on Drudge; the MSM Will not touch it. By the way, if it turns out the Sun is the climate driver, what do we do with Al Gore… have him fly more? Re-issue 1959 Eldorado Cadilacs?
S’gonna be 8°C tonight at 21° south on the coast (ie in 500k the tropics).
No doubt it will be the hottest June EVAH once the records are adjusted…
In the UK we apparently had the warmest spring evah in Northern Island. Not that anyone there had noticed. It’s now 16C in Liverpool, in mid June. Climate change? Bring it on!
The NorthEast USA is still waiting for summer which usually arrives in May, not June.
Mike the gen-xer, this child of “the greatest gen” is still seeing mornings in the 50’s just like I remember during some years in the 1970’s. History repeats itself.
Got the heater running in Hervey Bay tonight, 25° South of the Equator.
Here in SW France, the heating has been on much longer than any of the past twelve years I’ve been here.
Still waiting for “summer” to start properly – so far none of the days where windows are closed and shutters pulled almost shut to keep the heat out. Very much cooler weather than we’ve been used to since 2000.
SteveT
Eric, I got into Philadelphia on the 18th last month and it hasn’t stopped raining, and cold, around 17 / 18 every day. I thought it was supposed to be summer here !
I grew up in Philly. Last frost for that area is around Mothers Day…that is when it is safe to plant tender stuff outside.
It can be cold and rainy until well into May, although almost every year has a few hot days in April and sometimes even March.
This year was no different.
In May, it can be rainy for weeks on end, or it can be blazing hot for weeks on end. Rainy is more common.
My June, the weather usually turns dramatically to the warmer, but at any time in Summer cold fronts can lead to crisp cool nights and pleasantly hot and sunny but low humidity afternoons.
Three days in a row over 90 is called a heat wave there.
A days drive south, here in Florida, it is 90 nearly every single day from April until sometime in October, unless it begins raining before it gets to 90. Along the coasts it is cooler if the wind is off the water.
Tampa Florida has never recorded a single 100 degree reading ever in history.
Philly used to have 100 degree days nearly every summer…they have become increasingly rare.
I do not know where these record high global temps are occurring…no place in particular is hotter than ever, but added all up it is?
Hard to buy it.
Very hard indeed.
Hmm no. Not yet.
We are still recovering from the 2016 El Niño. Global temperatures started to rise mid-2014 due to a quasi El Niño and continued rising through 2015 up to February 2016. Since February 2016 the world has been cooling but on average we are about half way down to the 2001-2013 average.
The global cooling has not stopped yet as since April 2017 temperatures have been lower than the previous six months average. The important thing is that the cooling is taking place without a La Niña situation. During a La Niña, despite faster cooling, the tropical oceans are recharging energy from the sun due to lower cloud cover and that ocean heat can manifest as a faster warming once La Niña ends.
So the situation is interesting. Without a La Niña the planet is not recharging the heat lost to space during the last big El Niño, and theoretically the cooling could continue all the way down to the 2001-2013 average by 2018-2019 and further down afterwards. If by the early 2020s temperatures are at the level of the early 2000s, the alarmists are going to have a lot of explaining to do.
From oz4caster.wordpress.com
They already have some explaining to do… According to satellite measurements in the lower troposphere, of global temperatures, there has been no significant warming since the 1998-El Niño. That’s twenty years ago soon and the IPCC people can’t give any plausible explaination why the global warming has been, and still is, absent…
Erik,
Satellite temperatures show warming.
That’s because of the underlying Ocean cycle, that’s what’s cooling the NH. Less warm water North of the equator, less warm humid air pushing into the continents. It’s 56F @41N 81W Suppose to have a few days in the 90’s this weekend, gulf air pushing Canadian air out of the way.
What’s interesting is that the ENSO widget at WUWT shows we are on the borderline of renewed El Niño conditions.
The ENSO widget does not decide when we are in El Niño conditions.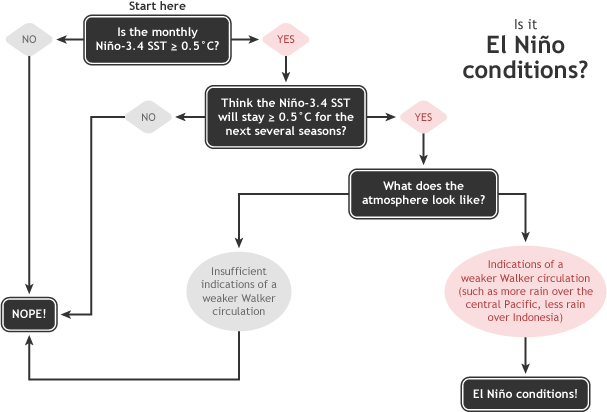
This is the flow chart for deciding when we are in Niño conditions by NOAA:
I think it is not very likely that we will have El Niño conditions in the 2017-18 season, despite current El Niño 3.4 SST. Where is the heat going to come from? A weak El Niño for 2018-19 cannot be ruled out at this time.
Javier, according to NOAA there is a lot of left over warm water from the 2016 El Nino which spread the warmth north more than usual. This is the warm water that has filtered back into the Nino 3.4 area creating the +.5 anomaly which would generally be considered weak El Nino conditions.
This (along with the AMO) is one of the reasons why the global anomaly has generally stayed higher than would be expected after an El Nino. However, it appears we might be getting an up-welling cool water pattern in the east Pacific which could push the warmer waters back towards the PWP. If this continues it might lead to La Nina in 2018.
This recent El Nino simply hasn’t behaved like any previous El Nino and basically tells us we still have a lot to learn about ENSO. It also throws the NOAA algorithm you referenced into question.
It’s almost like we don’t actually understand one of the biggest factors in global climate. /duh
If there is a step change after this el Nino (it kind of looks to be so, way early to tell though), looks to be smaller than previous ones.
“If by the early 2020s temperatures are at the level of the early 2000s, the alarmists are going to have a lot of explaining to do.”
Weird. Over on judithcurry site you said you don’t do prediction.
Also…If the 2020s..are warmer your story won’t change. ..cooler or warmer… you’ll spew the same junk
+10
Thanks, this is good info except for the fact it leaves out the AMO and its turn down. As in the case of quantum physics and the double slit experiment, it is the merging of waves and canceling of waves that matters for probabilities of maxima. In this case it is the convergence of very different cycles and cycle lengths that matters for the coming cold decade.
In case you didn’t notice my phrase starts with “if.” If I am not wrong that is a conditional. You should know as it is your language and you are an English major. Conditionals do not imply a prediction as the condition might come to pass or not.
I just follow the evidence, as any scientist should do. No significant warming since about 2001 except the one produced by a very strong El Niño, despite a very significant increase in CO2. I think that is the junk. Wasn’t CO2 supposed to have an instantaneous effect?
When the facts change, I change my mind. What do you do, sir?
So what.
In the southern US we are experiencing one of the coolest Springs in years and it looks like a replay of the unusual cool summer of 2009. In that year of solar minimum there were many more strong cold fronts sweeping across North America much like large-scale winter storm systems. Add three more spring and summers like this in succession to get to solar minimum and it will amount to more than mere weather.
Of course Lief will be throwing stones. That’s all he can do, lol!
Could the cold temperatures be due to the geoengineering being done by dispersing particulate into the upper atmosphere to deflect the sun back and away from Earth? They discussed/planned for it in 2012 and currently in Harvard they are currently participating in this global approach to lower Earth’s temperature.
The fishermen in Newfoundland can’t go out on the Grand Banks and ply their trade because the ice pack is much later breaking up this year.
And yet the ice coverage in the Artic is at the 4th lowest since records began.It must be low elsewhere like the Bering and Chutchi nd the Mackenzie.
Mr. Archibald,
In your Energy and Environment paper of 2006 you stated:
“Based on solar maxima of approximately 50 for solar cycles 24 and 25, a global temperature decline of 1.5°C is predicted to 2020. ”
In other words you predicted a decline of 1.5 degrees between 2006 and 2020. Since we are more than 80% of the way through that period, and surface temperatures are actually significantly higher than they were in 2006, is it time for you to declare that your predictions at that time are unfounded, and make some sort of assessment of why your 2006 work got things so wrong. Incidentally a 1.5 deg fall would lead to global temperatures lower than anything in the paleo record for the “Little Ice Age”.
Predictions about the future are always hard.
Bless you Bill. You remembered something I wrote over a decade ago. That is so flattering.
I predicted Bill would quote you ten years ago. I also predicted your response. 97% of climate scientists agree predictions work best when made after-the-fact. More/less snow? Exactly what we would expect!
Is this how you dismiss your own prediction?
We hear so often here how climate scientists predictions are 100% wrong. I have often asked for skeptical predictions. Here is one at last, and it is 100% wrong, whereas the climate scientists predictions of continuing warming are correct.
Is it time you all acknowleged this fact that is obvious to anyone that wishes to open their eyes?
I will make you the best, and most honestly skeptical prediction of all predictions:
I am highly skeptical of ANY predictions about the future! (and I questions those predictions about the past)
archibaldperth nice anti-scientific duck and weave.
Seaice1 you are wrong, climate scientists predicted “unprecedented” temperature increases of the surface air that would be exponential in nature that would overcome all natural variations and any stop the length of the pause would not happen. You don’t get to change that to predicted warming. Practically everybody predicted the 1000 year plus trend will continue. Archibald can defend his own short term predictions or based on his comment run and hide behind sarcasm on his own.
David, I’m sure you’d llike to tell us all what the flaw in your earlier paper was.
Why so much interest in what I wrote over ten years ago? I think I have it figured out. Displacement! You warmers are so ashamed of the decades of your hysteria and the wasted tens of billions that could have been spent on useful things instead. Now your weltanschauung ist alles kaput. You are thrashing around for an alternative belief system now that the global warming thing as failed. In the meantime you are blaming others who even years ago tried to point out the right path. I don’t expect gratitude, but your healing process will be slow until you admit much fault.
archibald. Predictions work by saying what you think will happen in the future, then we see if it does happen. To dismiss earlier predictions as unimportant because they happened in the past seems to be missing a very important point.
I feel that it is in everyone’s best interest that climate forecasters ensure that their track record is transparent and accountable, whether they are of a skeptical camp or otherwise. Imagine if one could immediately see at any self described climate expert’s web site what their track record is. This would benefit all, and should apply to all, from Gavin Schmidt and Michael Mann to Judith Curry and Archibald. When one is not proactive in disclosing the track record of their forecasts, they don’t build trust either, but rather are open to all sorts of challenges. disclosure: I do publish performance all forecasts of mine (at least to customers), and they are not bad so far, including this one of the AMO for no charge: http://www.abeqas.com/mwa-atlantic-multidecadal-oscillation-amo-forecasts-continue-to-score-high-accuracy/
In that example there are years to go. If the forecast gets worse, I’ll still disclose that in my annual updates of course. If the forecast remains highly accurate, then I can hope someday that others will notice.
Temperatures are significantly higher that 2006? Where?
If you are referring to the recent El Nino, so what?
Why would solar cycle 25 have anything to do with temperature trends between 2006-2020 when solar cycle 25 starts around 2020?
Now all you have to do is filter out a super El Nino from the temperature record to check the prediction. simple enough….
And he still has some years left. With Zharkova’s model showing the Sun going quiet the chances are good that Mr. Archibald will be much closer in HIS prediction that any priest of AGW has managed. 😀
Zharkova’s model is pure junk and has no predictive value.
“The last weak solar cycle was Solar Cycle 20 which caused the 1970s Cooling Period.” This is a claim and my claim is: the cooling in the 70s was due to a very weak AMOC in these years which generated a dip in the AMO: ?itok=1Kdwhlgn .
Exactly. If one little dip in a solar cycle was the cause back in the 1970s then we should be seeing a similar dip with cycle 24. Not happening. However, I suspect it was combination of both the AMO and PDO in their negative phases that let to the 1960s and 1970s cooling.
Frankclimate – what caused the dip in the AMO?
I answerd this question: a very weak AMOC!
So what caused the very weak AMOC!?
ian W: It’s your turn! If you believe it was the sun…show it!
Can you describe the 1970’s cooling please? When did it start and stop?
The cooling was mainly in the NH and can be clearly seen here.
It first started when the PDO went negative and then reached its peak cooling after the AMO went negative. We will likely see a similar effect when the AMO goes negative in the 2020s.
Richard, I have graphs out side the tropics in 10 degree latitude bands where I compare the change in land temps by day as it warms from maximum negative daily temp change to the maximum positive daily change in temp(warming), and the reverse (cooling), which cross zero ~ longest and shortest day + 2-4 weeks.
You can see all this here
https://micro6500blog.wordpress.com/2016/12/01/observational-evidence-for-a-nonlinear-night-time-cooling-mechanism/
And the other 2 pages there.
Richard M. This seems to be a 1940’s 50’s and 60’s cooling. It seems a little odd to call it a 1970’s cooling.
@ur momisugly seaice… your lower comment makes sense, “…Richard M. This seems to be a 1940’s 50’s and 60’s cooling…”. That slight cooling trend ended in the mid 1970s, ie 1946/47 to 1976/77.
It startet around 1960 and lasted to about 1977 as you can see here:
http://www.woodfortrees.org/graph/hadcrut4gl/from:1955/to:1990/plot/hadcrut4gl/from:1955/to:1990/mean:90
Do you know “wood for trees”? I like to help you out, the next time you can answer this question yourself.
Unbiased estimates of GAST from vetted, century-long land stations show a pronounced, persistent cooling from the late 1950s to a deeply negative trough in 1976. UHI-biased estimates show a plateau with only a slight dip into negative anomalies during that same period, with the coolest year varying from one trumpeted index to another. Take your pick!
Frank – I don’t see 1977 in your graph – the lowest point of the mean is about 1974. We could draw what appears to be straight line for cooling that ended in 1977, but we can also draw a straight line for warming that starts in 1974. However, I think it reasonable to say that the cooling lasted from the mid 1940’s to the mid 1970’s.
seaice: indeed… the mid 70s were cooler due to the natural variability mostly of the Atlantic. If one “tunes” model-temperatures with the help of the interval 1975…2005 ( just like many CMIP5 do) one gets an overestimated sesibility vs. forcing. And this is the case, plain and simple.
The cooling of the 1940s to 1970s was a natural cycle following the warming of the 1910s to 1940s and preceding the warming of the 1970s to 2000s.
David,
As much as I approve of your work, especially when you DON’T quote yourself,
I have to object to your phrase, “caused the 1970s Cooling Period”.
If you’re actually saying “accompanied the 1970’s Cooling Period.”, then I’m
right there with you.
We’re still waiting for the guy who loves to quote himself to log in.
I look forward to this coming winter with great interest. To my way of looking at the picture last winter’s heavy rains on the West Coast were the flood year that I had speculated would hit the region in comments which I originally first made in early 2014. The only question for me is was this the main event or will this upcoming winter see an even wilder stronger winter.
If this last winter was the main event, then from my outlook that means that solar minimum should be no further away than 2 years from the end of the 2016/17 winter. That would imply that the solar minimum would set in around late 2018. If this upcoming winter produces another flood, then that would point to 2019 as the latest point for the solar minimum. The basis for my reasoning on this stems from the historical floods of 1964/65, 1955/56, 1946/47, and 1937/38, a 9 year pattern which ended with the 1964/65 flood as it appears that when the 1970s came along the climate changed back to a warm trend, and that had something to do with why the 9 year flood cycle stopped.
Alternatively I have been wrong about his all along, but it has been educational for me since I started on this path back in Sept 2008. This all started when I viewed a low resolution solar chart for the first time, and immediately realized that there was some connection between the West Coast flood cycle and solar minima. That was about 6 months into my reading about AGW over at Newsvine. It was what hooked me into spending the many thousands of hours over the last 9+ years delving into climate related material.
I find your cyclical observations quite interesting, it will be fascinating to see how they play out. I’ve noticed something similar, but on a longer time scale, which I believe is linked to the ADO/PDO cycle, although I’m not sure how.
The American Southwest and especially Texas periodically suffer from terrible, multi-year droughts that cause great economic hardship. The most recent occurred in the late 2000’s, peaking in 2011, a year where over 90% of the state was in severe drought conditions. The last truly great drought before that covered 7 years in the mid-1950’s, virtually wiping out the cattle industry at the time. I have looked up records that show that there was also a great drought in the 1890’s that led to a wave of agricultural bankruptcies. This suggests that these great drought events operate on a 60 year cycle, which is an interesting number that keeps popping up whenever people discuss long term weather cycles. (btw, no good weather records exist for the region in the 1830’s, so we can’t be sure what happened then)
Great info, that ties in with the perspective which I have arrived at in my studies. I view the short cycle of 30+ years warm or cool as an important key for deciphering parts of the climate patterns.
So running backwards from where we sit now it looks to me like the last shift point for the climate was around 2006/07. Prior to that 1976/77. That has been this last leg of warming. Then 1946/47 1976/77 was cool. 1915/16 to 1946/47 was warm. 1185/86 to 1915/16 was cool. Now look at how that potentially correlates with the Texas droughts of which you speak, drought late 2000s early into the shift towards cooling, drought mid 1950s early in the cool trend, and drought in the 1890s which would have been in the first half of the cool trend from 1885/86 to 1915/16.
The droughts of the 1890’s ran all the way up into Canada, where I live. The record temp highs for Western Canada are in my area at 47C or 117F in 1897. The drought was probably similar to the 30’s if not worse. Most of the record cold temps are the early 1900’s or else in the 1960’s. Cycles, cycles, cycles. I believe Australia had some similar type drought conditions coincident with some of the N. American ones, so more global in nature perhaps. This is the kind of information the AGW types try desperately to never speak of. Like the extensive Antarctic ice conditions of a couple years ago while they were wetting themselves over low Arctic ice that was probably similar to the 1920’s.
I see no evidence that CO2 has anything to do with the weather and today’s weather looks identical to the mid 70’s to me.
Ah yes, all the hand wringing by the catastrophic climate change is killing us we need all your money to save your ass crowd over the California north to Washington drought. According to them it was the fault of all that toxic CO2, of course that would be the CO2 from industry, which is different than “natural” CO2. Of course, it had nothing to do with warm water temperature off shore promoting high pressure or cool water promoting a trough and normal cycles of “weather” as so pointed out. And right on que, the hand wringing was an excuse to promote their socialist anti human agenda.
And even if this becomes a full on Maunder style event, it won’t dent global warming by as much as a degree (even if there are regional winter impacts)
https://www.theguardian.com/environment/climate-consensus-97-per-cent/2013/aug/14/global-warming-solar-minimum-barely-dent
It really is amusing how much faith Griffie puts in liars.
Griff left off the part about how BAD BAD consequences can only be forestalled if we have a Climate Auto da Fe, and we pitch all of our gold and valuables into a bonfire while prostrating ourselves at the feet of the High Priests of Climatism.
@ur momisugly Griff… I have heard that claim from alarmists many times now. I have also heard many claim that it would only drop temps by around 0.1C. I think that is a ridiculous premise.
If your counting on a socialist global warming supporting newspaper telling you the truth then your in for a rude awakening.
Since when has the Guardian been Gods Word Incarnate?
Read the article Griff. Its a complete joke
The Guardian quoting a discredited paper?
Wow, that’s such strong evidence I will change my mind.
The Guardian, Griff! Such a reliable source. 🙂
Does it mean that Svendsmark’s hypothesis can be falsified within a decade? Or will the cooling hide in the deep oceans?
I think the cooling will hide itself in the ice-caps.
Excellent one Jones!!
As the heating hid itself in the deep oceans????
hidden in the code…
Svendsmark’s hypothesis is incorrect. The main factor affecting cosmic rays in the earth is the earth’s dipole, whose changes account for >90% of changes in cosmic ray intensity. Solar wind changes only produce a small <10% change in cosmic rays.
http://i.imgur.com/OBP3Nan.png
The upper panel shows the measured change in 14C production rates. This is the one that reflects changes in cosmic rays. The bottom panel has the earth's dipole effect subtracted. As we can see in the upper panel cosmic rays were much higher a few thousand years ago, with a warmer climate, than during the LIA. Just the opposite of what Svendsmark’s hypothesis predicts.
As climate evolution doesn't look like the earth's dipole evolution Svendsmark’s hypothesis cannot be correct.
http://www.spaceweather.com/images2017/12may17/radplot.png?PHPSESSID=k2dhod90nhncgut34o91t82vt1
There’s no d in Svensmark.
Sorry, I just copy/pasted it from the comment above by Steinar Midtskogen. That’s how mistakes are propagated, through laziness.
The theory is that high energy CR are the relevant cloud factor. Are these affected more by sun and less by earth?
High energy CR should be affected more by the stronger (here) magnetic field from the earth than by the interplanetary magnetic field carried by the solar wind.
https://www.researchgate.net/publication/308706780_The_Revised_Sunspot_Record_in_Comparison_to_Cosmogenic_Radionuclide-Based_Solar_Activity_Reconstructions
Others disagree…
RWturner,
But it is the wrong comparison. Only about 10% of the change in cosmic rays rates for the past few thousand years has been due to changes in solar activity. There is nothing there you can disagree with.
@Javier,
High energy CR should be affected more by the stronger (here) magnetic field from the earth than by the interplanetary magnetic field carried by the solar wind.
Why? True that the Earth magnetic field is stronger here than the interplanetary field, the Earth’s field is limited to just a few tens of thousand km. The sun’s interplanetary field may be weaker, but is significant over hundred’s of millions of km.
What determines the cosmic ray flux that reaches the Earth depends on the Earth’s magnetic field, just like how wet you get walking in the rain depends on if you are carrying an umbrella.
Leif, the sun also carries an umbrella. It is not as concentrated as the Earth’s, but order’s of magnitude larger and thicker.
Variations in the solar and solar wind magnetic fields make NO difference to the Earth?
Yes, it does make a difference, to the tune of 0.1 C
So all that remains is an explanation of the historic correlation between temperature and solar activity.
above and below 40 latitudes the energy from the sun in low periods is greatly reduced, while the southern mostly ocean, it’s the northern area that will cool faster with less warmth being shipped up there by surface waters too, it’s a double edged sword. Less energy less heat transport, growing cap.
Imo anyways and now we get to test the hypotheses and theories in the next decade so that is at least good 🙂
Interesting to see the data. Another proof is also easy to see. When solar gets as low periods. The sales of people trying to unload cb radios on sales market. But this is a trend of only last 40 years or so. Anyone today can look for themselves. When cycle was good. Everyone wanted one (1970s). When it all quits. Stick on eBay and get all money spent back (2016-?). Solar cycle is what drives the “bounce”-“skip” of radio waves. Highest.. hear people from all over world. Lowest. Think everyone left planet. And a lot more of not only that. Weather patterns change. Temps. Winds. Many connections that most never can understand..
RD,
Can you please write in simple English so that idiots like me can comprehend your message?
On the other hand, the advent of the cell phone altered the demand for CB for large numbers of people. Most CB use was for relatively local communication, not for long range involving “skip”.
!0-4 good buddy, keeping a handle on where the “smokies” are. Radar detectors made them obsolete.
You’d be surprised how many people used them as we use cell phones now for local calls. In the 70’s my wife worked nights. I had a CB base station and she a mobile CB in her car. Every night for years, I had contact with her for her 14 mile drive home. More than once her car had trouble and I was able to get help to her right away. They weren’t just used for avoiding speed laws.
“The strong asymmetry between the northern and southern hemispheres continues”
I take it these are the northern and southern hemispheres of the sun?
Sun can flips Gulf stream position at all too. Here is 2 pictures sunspots vs. heat content in left of Svalbard
http://static-sls.smf.aws.sanomacloud.net/tiede.fi/s3fs-public/styles/medium_main_image_no_upscale/public/discussion_comment_image/pilkut.png
http://static-sls.smf.aws.sanomacloud.net/tiede.fi/s3fs-public/styles/medium_main_image_no_upscale/public/discussion_comment_image/ap_index.png
Now situation at Atlantic ocean is cold, this will affect to Artcic ocean with a couple of years later :
http://static-sls.smf.aws.sanomacloud.net/tiede.fi/s3fs-public/styles/medium_main_image_no_upscale/public/discussion_comment_image/golfvirranpositio1_1.png?itok=loMwCOWu
When 2009-2010 solar activity was low , Gulf stream lost heat transfer power lots :
http://www.ccpo.odu.edu/~tezer/PAPERS/2015_GPC_AMOC_SL.pdf
How can “further climatic cooling” be in store during solar cycle 25 when there hasn’t been any climatic cooling at all during solar cycle 24 so far?
The opposite in fact. All the global temperature data sets we have, including satellite, indicate a rapid rate of warming since the onset of solar cycle 24 in December 2008. Granted this is a relatively short period and is weighted heavily towards warming by the recent El Nino; but let’s remember that it was the author of this article who set the start date for his dramatic cooling prediction as the onset of solar cycle 24, which is already ~80% complete.
If the global cooling forecast by David Archibald in 2006 and 2008 due to the (correctly) forecast decline in solar output can be so easily overcome by a natural ocean oscillation, then isn’t it time to admit that the overall forcing of slightly reduced (or increased) TSI on climate has been greatly exaggerated compared to other forcings?
DWR54, once again you ignore ENSO in your comments. While I agree the solar cycles effect are small you really need to factor out ENSO and other ocean factors before you can make any intelligent claims.
Richard M
From the very comment that you responded to:-
Once again you ignore that I didn’t ignore ENSO in my comment.
Since almost all the energy received by our planet comes from the sun, why is it so difficult to believe that small changes in TSI could have large affects? This is not uncommon in complex systems. I was just reflecting the other day on how very small changes in carburetor jetting on my motorcycle had very noticeable effects on engine performance.
Paul
I’m not suggesting that, in the absence of other forcings, even small changes in TSI could have large effects on climate. Presumably they could.
All I’m pointing out is that as far as observations go, and we have plenty of them, the current reduced rate of TSI has had absolutely no cooling effect on global climate. This strongly suggests that other forcings must be outweighing the expected cool forcing of reduced TSI.
If this was caused by a simple warm oscillation of the ENSO system, then so much for the primacy of solar output over other climate forcings, at least over the relatively short term.
DWR545 writes “Since almost all the energy received by our planet comes from the sun, why is it so difficult to believe that small changes in TSI could have large affects?” (should be corrected to “effects”).
There was a time in the chemical sciences when catalysis was being observed, but no explained. The magnification of effects such as rate of chemical reactions seemed far in excess of what was thought possible by such a small related quantity of catalyst. It took a few decades for the mechanism of catalysis to be explained and generally accepted.
Do you see an analogy between chemical catalysis and proposed amplification of solar effects?
Geoff
Catalysts are understood. TSI amplifications are not. They are ad-hoc in the sense that you need to invoke them to make your theory fit.
“How can “further climatic cooling” be in store during solar cycle 25 when there hasn’t been any climatic cooling at all during solar cycle 24 so far?”
Good question, and I do wish people were talking about this more in terms of Differential Equations. A key issue in modeling the Earth’s response to heating and cooling forces is how quickly it responds. In other words, “What is the impulse response.”
In layman’s terms, do we need to look at a 1 year average of, say, sunspots, or a 20 year average? It could easily be that it takes a couple of weak cycles in a row for the overall impact to accumulate to something significant.
Now, I’d guess that the result of the Differential Equation should be an exponential smoothing constant. Deriving that constant empirically is especially tough, with things like El Ninos acting as noise in the calculation, but that should be the goal of SOMEONE’s research.
Mike
By what mechanism do you consider accumulated solar warming is stored in the earth system for later release as surface warming? To me the most obvious would be within the oceans. It is conceivable that the oceans might store solar heat from previous decades and release it later, causing surface warming.
However, if that were the case then I would expect observations to show a concurrent reduction in ocean heat content. If ocean cycles releasing prior solar heat energy have truly been responsible for most of the warming observed over the past few decades then surely one would expect to see a concurrent reduction in ocean heat content to compensate for this.
The opposite is the case, in fact. Ocean heat content has been observed to ‘increase’ during the same few decades over which the surface and lower troposphere have also been observed to warm. This during a period of reduced TSI; less solar energy entering the system. Something doesn’t make sense with that model.
Just factor in that the oceans hold 1000 times the heat that the atmosphere can.
I say it’s a trifecta.
It depends on the sun, the ways oceans run and clouds in complexity forming.
Pop Piasa
Like I said above, heat transfer from the ocean over a period of decades might be a feasible explanation for the observed surface and atmospheric warming; but only if it was accompanied by a concurrent observed reduction in ocean heat content.
If the observed warming of the surface and atmosphere over the past several decades is the result of heat energy transfer from the ocean, then why has the ocean also been observed to gain heat energy over that period?
DWR54 — I think you’re on the right path; the heat content of the ocean could easily be key. If it is, then the impulse response of global temps to all drivers will be slow.
If the impulse response is slow, then the last half dozen or so solar cycles, being strong, should have raised both atmospheric and ocean temps. The recent weak cycle would be just beginning to push the needle in the other direction. In a few more years (which are sure to be weak) this effect should start to be noticeable.
If SC 25 is also weak, so we accumulate a couple of decades of low activity, then we’ve run a clear test and either we see a solidly noticeable effect or the “sunspots drive climate” theory is toast. Of course, if the impulse response is fast, we’ve pretty much refuted the theory already.
Some day we’ll know all the coefficients. When we do, we’ll understand what started the ice ages too.
http://milesmathis.com/cycle.pdf
shows the cooling
David,
You have exactly zero evidence that the 1970s Cooling Period was caused by low solar activity. Since 2006 we have had a lot less solar activity that between SC 19 and 21 and we have had zero cooling. It reflects badly on you such security on something that is contrary to evidence and for what you have zero evidence. That’s how Tarot or Astrology are proposed.
What do you mean by “further climatic cooling”? We haven’t had any. You predicted cooling and you were wrong. You didn’t carefully examine the evidence that temperatures do not follow solar activity closely enough to track the 11 year cycle. You haven’t learned that lesson yet. I believe the evidence is strong that solar variability affects climate but not in the direct way you propose. Perhaps if SC25 is as low as SC24 we might finally see some cooling to alleviate this climate craziness. The climate system requires time to respond to the small changes in solar output.
Javier,
When you turn of a radiator it does not immediately go cold. why should the impact be instant as you seem to imply.
Andrew,
I think you misunderstood what I said. The key is in my last phrase:
“The climate system requires time to respond to the small changes in solar output.”
It is David Archibald who defends the 60-70’s cooling was due to the 60-70’s reduction in solar activity (no delay), and the one that predicted a cooling from 2006 due to a decrease in solar activity (again no delay). Your message should be addressed to him.
I think what the issue is here in this argument is that the oceans are the predominant moderator of our climate. The Sun fuels the oceans, but is not the main climate driver except during the advent of a gsm, or other longer period Sun cycle.
Th early part of the 70s was influenced by La Ninas, especially the period 1973-1975. In 1976 the Great Pacific Climate Shift occurred (The PDO flipped with the onset of the 1976-77 El Nino). I believe the AMO was still in the negative phase in the late 70s.
“The last weak solar cycle was Solar Cycle 20 which caused the 1970s Cooling Period.” As much as I am an advocate of the solar hypothesis, I think that this statement is as bad as “CO2 causes global warming”. They happened at the same time, more or less. The 70s cooling period was also at the bottom of the AMO. The 72 year cycle appears to be synced with the solar magnetic maximum/minimum. There may be other natural causes that have not been excluded at this point. I suspect that when all is said and done, we will find that the solar activity pumps the AMO, cosmic rays modulate clouds and so albedo, and so forth and that CO2 has very little to do with any of the observed warming. Till then, I think it is reasonable to modify statements to note that they are a hypothesis, and not a statement of fact. The only factual statements that should be made are statements of rejection of a null hypothesis.
Excellent observation on your part. If it turns out that CO2 produced by human activity has very little to do with observed warming…… perhaps we can find a different mechanism for the formation of the huge Ice Age
Glaciers when fewer folks occupied the planet. But they did burn wood and coal and peat to heat their dwellings. No cars. No oil and natural gas. So why the ice ages? Those big digs which turned out to be the U.S. Great Lakes just didn’t happen by accident. And the rocks they deposited on the farm where I grew up didn’t just suddenly show up either……
William Sturm
Interesting to see reports from the southern and northern hemispheres including NAm, Europe and the Arctic. Here in Eastern Ontario except for a few days in May, we’ve had temperatures as much as 5-8C below normal and though I’d turned the heat off I’ve had to put it back on because of guests. My wife is in Moscow and she complains she had to buy some warm clothes. I think this is beyond just weather. The weather network here, to is over forecasting temperatures. The say it will be 25C today. Well see!
I think it would be a good idea to crowd source temperature from around the world with volunteers from WUWT regular readers, ensuring good distribution. Some months back there was a commenter from Capetown, South Africa who displayed a long temperature series that had the same pattern as US, Canada, Greenland, Iceland, N Europe, and Russia. Paul Homewood a year ago also revealed a similar pattern in Paraguay and other South Am countries. Apparently these records have been fiddled by climate folk but locally they remain as is. The fact they ALL display high 1930s/40s to me and other similar periods is corroboration that left alone with the warts and mistakes they are overall a better record than all the adjustments and fillins and extrapolations of guesstimated figures.
Gary – good idea, I have sometimes thought on similar lines about local monitoring of the differences between urban and nearby extra-urban rural temperature. In the UK, winter weather forecasts routinely predict a 4 and sometimes 5 deg C difference between London night-time temperatures and the adjacent rural ones (2-3 deg C for daytime) yet despite this the UHI adjustment used in producing ‘official’ temperatures is around 1.5 – 2 deg C. It would be good to put some real numbers to UHI to show how it can / does distort the ‘official’ temperature records towards ‘hotter’.
With your suggestion what first seemed like a problem on reflection was not necessarily an insurmountable problem. I was thinking that there would need to be standardised equipment / positions / screens for all those recording temperatures but then it occurred to me that it is not so much the absolute temperature that is important but the change from year to year from the same equipment in the same position. Also if there are a number of people recording in one area then perhaps these could be amalgamated and averaged.
Antony would be better placed to make suggestions and comment but it is something we ought to try and do – and do it in a way that stands any scrutiny and cannot be pulled apart by ‘climate scientists’.
regards
Roger
Yes–judging temperature relations to anything are a pain because the official record sets are stepped on. Actual historical records kept by real people show different history than the GISS, HADCRUT, etc data sets. So if one is trying to estimate solar effects on global temperature. . .
Apart from weather prediction models perhaps being tuned to the ‘warm side’ it has occurred to me that if you broadcast that the temperature is going to be ‘x’ degrees ‘hot’ there are now a majority of people who work indoors and may or will simply take away the ‘memory’ that they have had hot weather.
Perhaps I am being cynical – but given the machinations of the climate alarmist industry nothing would now surprise me where climate or weather claims are made.
Actually there are already thousands of reliable, independent personal weather stations (PWS) scattered thickly around the world that report observations continuously. I draw your attention to both the Weather Underground and Weather Bug networks. My PWS is registered and contributing it’s data every 60 secs or so to Weather Underground. There are more than 250,000 in the network worldwide. A trip to their website allows you to pick a geographic location and select which stations you want to follow to give you timely, accurate, hyper weather data. My own neighborhood has three and I can watch a gust of wind coming across the area as it hits the other two before reaching mine.
I have never understood why professional, well for it paid at any rate, never to seem the data points for their own purposes. To be in the network you have to use equipment that provides reasonably accurate data. My own unit is an Acurite 5-in One that tracks temperature, humidity, air pressure and wind direction.
There is some question about the accuracy of the measured temperature values from space….What are the + or – variance that must be used in conjunction with the reading? All kinds of things enter in. Round off error and other assumptions……….. And if someone tweaks the model the change may linger for decades which could affect the entire historical record. What do we do about that? Once the data is fed into historical record (and it contains some error) …this contaminates the entire climate data base for decades….. I know. I was in charge of a program which was being written by a contractor to ensure the data produced at the new location was on the same general level as that produced at the other. I was in charge of running the two programs to produce a proper transfer of the capability…..national defense depended on it. The contractors were not responsive and the time ran out for management to ‘certify’ a successful test had been conducted and we were operational. I was order to lie and state that we were operational. The next season it got extremely hot in one part of the world….they were cooking to death. These bogus readings entered the climatological data base. How to back em out? (Forget it…press on and ignore it.)
The one who ordered me to lie retired and joined the contractor responsible for the new code. Yup. that’s how it works folks. He was a nice guy and not hard on the contractor at all. I just smiled and walked away.
William Sturm
Thank you all for your interesting comments. MY previous comments are excerpted below.
I am quite confident about 9 of the 10 points in my 2015 Conclusions, included below. I am not positive about #6 – imminent (moderate) global cooling – like ~1945-1970, but I think it has a high probability of occurrence since solar activity has crashed.
We first published in 2002 that Earth will enter another natural cooling cycle that would commence by 2020-2030. I am now leaning towards a slightly earlier start time for cooling, by approximately 2017-2020. I really hope to be wrong – humankind suffers during cold periods.
Best, Allan
Post Script:
If global cooling does recommence, its exact starting time will be debated for years.
“It’s tough to make predictions, especially about the future.” – Yogi Maharaj Mahadev Berra.
https://wattsupwiththat.com/2015/06/13/presentation-of-evidence-suggesting-temperature-drives-atmospheric-co2-more-than-co2-drives-temperature/
Observations and Conclusions:
1. Temperature, among other factors, drives atmospheric CO2 much more than CO2 drives temperature. The rate of change dCO2/dt is closely correlated with temperature and thus atmospheric CO2 LAGS temperature by ~9 months in the modern data record
2. CO2 also lags temperature by ~~800 years in the ice core record, on a longer time scale.
3. Atmospheric CO2 lags temperature at all measured time scales.
4. CO2 is the feedstock for carbon-based life on Earth, and Earth’s atmosphere and oceans are clearly CO2-deficient. CO2 abatement and sequestration schemes are nonsense.
5. Based on the evidence, Earth’s climate is insensitive to increased atmospheric CO2 – there is no global warming crisis.
6. Recent global warming was natural and irregularly cyclical – the next climate phase following the ~20 year pause will probably be global cooling, starting by ~2020 or sooner.
7. Adaptation is clearly the best approach to deal with the moderate global warming and cooling experienced in recent centuries.
8. Cool and cold weather kills many more people than warm or hot weather, even in warm climates. There are about 100,000 Excess Winter Deaths every year in the USA and about 10,000 in Canada.
9. Green energy schemes have needlessly driven up energy costs, reduced electrical grid reliability and contributed to increased winter mortality, which especially targets the elderly and the poor.
10. Cheap, abundant, reliable energy is the lifeblood of modern society. When politicians fool with energy systems, real people suffer and die. That is the tragic legacy of false global warming alarmism.
Allan MacRae, P.Eng. Calgary, June 12, 2015
Hi Allan,
Number 5 is incorrect. You have no evidence that earth’s climate is insensitive to increased atmospheric CO2. Nearly all studies place the long term sensitivity to a doubling of CO2 at ≥1.5°K.
Number 6 is also incorrect. You have no evidence all recent global warming was natural. We don’t even have a clue about how much was natural and how much anthropogenic.
Javier – he has the evidence that the chart for specific energy or heat, of gases – shows clearly that a CO2 enriched mix will hold less heat than standard atmospheric mix. Go look it up since you obviously never have LoL!
http://www.engineeringtoolbox.com/specific-heat-capacity-gases-d_159.html
Furthermore you’re – obviously – not a climatologist but I happen to be, I specialized for several years in fact, in oceanic environmental and atmospheric chemistry, so I’m familiar with the fundamental tenets of your church.
For instance I know that the law of physics the atmosphere’s temperature is calculated, has as one of it’s five factors, a value called the specific heat per mole of any gas, or mix. In that law, when calculating an atmospheric temperature, CO2 and Nitrogen and Oxygen all get identical energy for ALL math problems related to temperature.
Furthermore Javier – if you decide to calculate that temperature using values for pure CO2, just multiplied by the fractional proportion it is? Yeah that’s what the chart above shows you Javier, if you knew how to do the math, you’d have known that – CO2 rich mix, holds LESS heat than standard atmospheric mix.
There’s more Javier: the entire thing is a scam anyway. Green house gases are insulation. There’s no such thing as insulation placed between any fire, and any rock, in any circumstances, causing more energy to emit from the rock it caused less energy to ever reach.
It’s not going to happen and it’s not happening now, and you’re not going to show me any instance in all recorded history where it did happen.
I’ll bet your reputation on that Javier. I just did and won because you’re not going to come up with an example of what your church claims,
happening. Not once. In all recorded thermodynamics, ever.
Good luck with your atmospheric studies
Gustaf
And what would be my church, Gustaf?
As I said, If you or Allan have evidence that supports that CO2 cannot cause warming you should get it published so it is debated.
Number 5 is correct. The known physics of gas molecules (albeit a bit deeper than some grasp) explains why the ghg CO2 has no significant effect on climate. Eventually it will become more widely realized ECS is not significantly different from zero.
Regarding number 6, IMO humanity might have a ‘finger on the scale’. The main factor countering temperature decline is the still rising trend of the ghg water vapor (1.5%/decade, about 3X expected due to feedback caused by temperature rise). The added warmth is welcome (and some will cling to the fallacy that CO2 did it) but the added WV increases the risk of catastrophe from precipitation related flooding.
Dan,
I am not going to discuss the very complicated physics that are over my head. That you think CO2 has no effect on climate doesn’t add anything to the debate. You are entitled to your opinion, but if you have proof you should get it published.
It does, it’s just at night under clear calm skies, water vapor only cares about air temp. And when rel humidity is low, cooling rates are high. So even if co2 made it a little warmer. Water vapor counter acts the effect, by cooling at the higher rate for longer, they both reach the same terminal temp as nights get longer. It’s obvious that the ratio of day to night alters surface temps. But energy stored in water vapor is released as water condenses, and it protects the surface from some of the cold sky. The optical window, a big middle chunk of surface temp spectrums, it almost straight to space, has one 10u water line. It’s frequently 100F colder than the surface, I’ve measured -85F. Even if the entire rest of the spectrum was completely blocked it’s still lose 50% or so, and conduction and convection would see a temp diff it would try to fill. But it’s not complete, but it also changes through out the night. Cools fast at first, then slows cooling as temps near the dew point temp.
Gustaf,
Thanks for sharing the link to specific heats, those seem like valuable data points to keep in mind. And, just to be clear, your point is simply that increasing the partial pressure of CO2 in air will naturally lower the specific heat capacity of air due to the lower relative values (Cp and Cv) of CO2 to air? If so, and I’m just thinking out loud here, then we can assume the following:
– The total atmospheric heat content potential (is there a term for this?) is lowered with an increase in CO2 relative to air
– If the total is lowered, then the insulative effects of our atmosphere is reduced
– Reduced insulative effects should speed the nightly cooling rate
Again, just idly wondering…considering the atmosphere from the perspective of total heat content potential, can the source of the heat (radiative or conductive) be considered immaterial? That is, does the additional CO2, absorbing LWIR in the narrow band that it does, provide a mechanism to add heat content to the atmosphere? (Through conductive and radiative transfer to higher heat capacity molecules.)
Or, do we assume that air and water vapor (and all the other relevant molecules) are already getting their full load of heat, and the excess heat absorbed by CO2 (in the form of IR) has nowhere to go but out. (Just reducing it to really simple terms here.)
Or, maybe it’s both? In some circumstances CO2 provides a mechanism to add additional heat to the atmosphere and in others it’s a limiting factor in the total heat content the atmosphere can hold. Maybe?
Hopefully my musings aren’t too ignorant, so if not, I’d be curious to hear your perspective.
Thanks,
rip
Hello Javier, and thank you for your comments.
Re my point:
“5. Based on the evidence, Earth’s climate is insensitive to increased atmospheric CO2 – there is no global warming crisis.”
I like full-scale test, when I can get one. No scale-up errors, etc. Here is one such test:
Global temperature declined from ~1940-1975, increased from ~1975-2000, and has stayed flat (or cooled slightly) since ~2000, all while atmospheric CO2 increased; so the correlation of temperature to increasing atmospheric CO2 has been NEGATIVE, Positive, and Near-Zero.
I suggest Near-Zero is the correct estimate of the sensitivity (ECS) of global temperature to increasing atmospheric CO2. There is and never had been a real manmade global warming crisis – there is no credible evidence to support this failed hypothesis.
Near-zero could include an ECS of about 1C/(2xCO2), but that would still mean that there is no real global warming crisis.
But there is more – also a full-scale test, as discussed in my next post.
Regards, Allan
Hi Alan,
Here’s one full scale test, all surface stations with at least 360 samples per year.
Min temp follows dew point at just under 98% correlation.
“Non sequitur.” You cannot conclude that CO2 has no influence based on lack of correlation. You might as well conclude that solar activity changes have no influence on temperatures, as they also show lack of correlation.
And he would be right.
Javier,
You can skip the fancy math, and look at a plot of CO2 vs. global temps during the “pause”. Realize when you do the amount CO2 has risen in that short period. P.S. The why don’t you publish it meme will get you no where on this site. Most here have read the climate gate emails which clearly establish why contrarian views, don’t get published. There is a section on this site for them read them yourself and draw your own conclusions.
Further to my points 5 and 6 above and my conversation with Javier, here is another full-scale test:
https://wattsupwiththat.com/2017/05/13/is-murry-salby-right/comment-page-1/#comment-2502282
[excerpts}
“Something” is causing an increase in atmospheric CO2 – this CO2 increase could be mostly natural or mostly humanmade. On top of this CO2 increase is a clear signal, that CO2 lags temperature by ~9 months in the modern data record. The causative relationship dCO2/dt vs. temperature T is incontrovertible.
http://www.woodfortrees.org/plot/esrl-co2/from:1979/mean:12/derivative/plot/uah5/from:1979/scale:0.22/offset:0.14
CO2 also lags temperature by ~~800 years in the ice core record. CO2 lags temperature at all measured time scales.
I suggest that the following conclusions are valid:
TEMPERATURE, AT ALL MEASURED TIME SCALES, DRIVES CO2 MUCH MORE THAN CO2 DRIVES TEMPERATURE.
What we see in the modern data record is the NET EFFECT = (ECO2S minus ECS). I suspect that we have enough information to make a rational estimate to bound these numbers, and ECS must be very low, so small as to be practically insignificant, far too small for there to be a significant risk of dangerous humanmade global warming.
Regards to all, Allan
https://wattsupwiththat.com/2017/05/12/surprising-nasas-global-visualization-in-3d-of-carbon-dioxide-in-earths-atmosphere/comment-page-1/#comment-2501415
[Excerpted]
It is incontrovertible that annual atmospheric CO2 flux (the Keeling curve) is dominated by natural seasonal temperatures – the cause of this seasonal flux is overwhelmingly natural and temperature-driven. It is also incontrovertible that atmospheric CO2 lags (in time) atmospheric temperature at all measured time scales (MacRae 2008, Humlum 2013 and others).
Since I wrote that conclusion in 2008, few climate scientists have wanted to even acknowledge this incontrovertible fact. To this day, the mainstream debate between climate skeptics and global warming activists continues to concern the sensitivity of climate to temperature (“ECS”) – or by how much the future can cause the past. 🙂
The following post attempted to focus the debate on what really matters – that based on the evidence, ECS is so small as to be insignificant, and the risks of CAGW are also similarly so.
Regards, Allan
https://wattsupwiththat.com/2017/04/12/perspective-needed-time-to-identify-variations-in-natural-climate-data-that-exceed-the-claimed-human-co2-warming-effect/comment-page-1/#comment-2477211
Excerpts from the following post:
All that really matters [in this analysis] is that CO2 lags temperature at ALL measured times scales and does not lead it, which is what I understand the modern data records indicate on the multi-decadal time scale and the ice core records indicate on a much longer time scale.
…
It also does not mean that increasing atmospheric CO2 has no impact on global temperature; rather it means that this impact is quite small.
…
What we see in the modern data record is the Net Effect = (ECO2S minus ECS). I suspect that we have enough information to make a rational estimate to bound these numbers, and ECS will be very low. My guess is that ECS is so small as to be practically insignificant.
Regards, Allan
Please excuse the pedantic nature of the following treatise – I am so often misquoted on this subject that I tried to make it very clear where I stand.
https://wattsupwiththat.com/2017/01/24/apocalypse-cancelled-sorry-no-ticket-refunds/comment-page-1/#comment-2406538
[excerpts]
I have stated since January 2008 that:
“Atmospheric CO2 lags temperature by ~9 months in the modern data record and also by ~~800 years in the ice core record, on a longer time scale.”
{In my shorthand, ~ means approximately and ~~ means very approximately, or ~squared).
It is possible that the causative mechanisms for this “TemperatureLead-CO2Lag” relationship are largely similar or largely different, although I suspect that both physical processes (ocean solution/exsolution) and biological processes (photosynthesis/decay and other biological processes) play a greater or lesser role at different time scales.
All that really matters is that CO2 lags temperature at ALL measured times scales and does not lead it, which is what I understand the modern data records indicate on the multi-decadal time scale and the ice core records indicate on a much longer time scale.
This does NOT mean that temperature is the only (or even the primary) driver of increasing atmospheric CO2. Other drivers of CO2 could include deforestation, fossil fuel combustion, etc. but that does not matter for this analysis, because the ONLY signal that is apparent in the data is the LAG of CO2 after temperature.
It also does not mean that increasing atmospheric CO2 has no impact on global temperature; rather it means that this impact is quite small.
I conclude that temperature, at ALL measured time scales, drives CO2 much more than CO2 drives temperature.
Precedence studies are commonly employed in other fields, including science, technology and economics.
Does climate sensitivity to increasing atmospheric CO2 (“ECS” and similar parameters) actually exist in reality, and if so, how can we estimate it? The problem as I see it is that precedence analyses prove that CO2 LAGS temperature at all measured time scales*. Therefore, the impact of CO2 changes on Earth temperature (ECS) is LESS THAN the impact of temperature change on CO2 (ECO2S).
What we see in the modern data record is the Net Effect = (ECO2S minus ECS). I suspect that we have enough information to make a rational estimate to bound these numbers, and ECS will be very low. My guess is that ECS is so small as to be practically insignificant.
Regards, Allan
*References:
1. MacRae, 2008
http://icecap.us/images/uploads/CO2vsTMacRae.pdf
Fig. 1
https://www.facebook.com/photo.php?fbid=1200189820058578&set=a.1012901982120697.1073741826.100002027142240&type=3&theater
Fig. 3
https://www.facebook.com/photo.php?fbid=1200190153391878&set=a.1012901982120697.1073741826.100002027142240&type=3&theater
2. http://www.woodfortrees.org/plot/esrl-co2/from:1979/mean:12/derivative/plot/uah5/from:1979/scale:0.22/offset:0.14
3. Humlum et al, January 2013
http://www.sciencedirect.com/science/article/pii/S0921818112001658
This has been known by scientists since 1970s. Look for R.B. Bacastow works in 1975-1985. The seasonal biological response to temperatures that determines seasonal CO2 flux is unrelated to the long term trend in CO2 increase that is without doubt anthropogenic.
Correct, but that doesn’t mean CO2 does not cause warming, and in the present situation CO2 is leading temperatures since we are producing it regardless of temperature changes.
Gustaf, your post is very difficult to understand, possibly as English is not your first language? Where it is understandable it is mostly wrong.
Specific heat at constant pressure (Cp) for CO2 is 0.844 KJ/Kg.K and for air it is 1.01KJ/Kg.K. This does mean that for a given temperature rise there will be less energy contained in a kg of CO2 than a kg of air. It also means that for a given energy input the temperature will rise more. It does not man that a CO2 enriched mix will hold less heat than a standard atmospheric mix.
However, the difference in heat capacities between CO2 free air and air enriched with 400ppm CO2 is so small that it makes effectively no difference. Whatever effect CO2 is having, it is not by virtue of its heat capacity. Heat capacity is a red herring.
” I know that the law of physics the atmosphere’s temperature is calculated, has as one of it’s five factors, a value called the specific heat per mole of any gas, or mix. In that law, when calculating an atmospheric temperature, CO2 and Nitrogen and Oxygen all get identical energy for ALL math problems related to temperature.”
I don’t know what you mean here. Her follows an aside on heat capacities which is interesting and may be what you are trying to get at..
An ideal, monotomic gas will have a Cv (heat capacity at constant volume) of (3/2)R per mole of atoms. That is, every monotomic ideal gas does have the same molar Cp of 12.5 J/Mol.K This is because there are only 3 ways the molecule can gain internal energy – the three coordinates of movement (often called x,y and z). Spinning does not add energy as an ideal gas is considered a point and spinning does not add momentum. As we are at constant volume there is no work done by expanding, which is why Cv is simpler than Cp in this instance. All noble gases do indeed have this Cv as they are very close to ideal gases.
All ideal diatomic gases at low temperatures have a Cv of (5/2)R or 20.7 J/Mol.K. (per mole of atoms). This is because they have an extra two ways to store internal energy – the two axis of rotation about their center. The third axis is along the line joining them and rotation about this axis does not add momentum. If O2 and N2 were ideal gases they would have the same value for molar Cv. We see that Cv of N2 = 19.9 and O2=21.1, quite close to theoretical.
A non-linear polyatomic gas can have a third degree of freedom – rotation about the other axis.
I said at low temperature. As temperature increases, internal energy can be stored as vibrational energy of the bonds. Thus we see that heavier diatomic gases have C closer to 7R/2, such as Br2 = 28.2.
Light gas molecules are mostly in the ground state vibrationally at room temperature, so vibration has little contribution to internal energy.
However, if we add photons to the mix, these can excite the vibration levels of the molecule. Thus the total internal energy of CO2 or H2O can be increased by absorption of photons.
There is nothing in this level of physics that contradicts the heating of the atmosphere by absorbing photons.
What gets simplified out is that you also have a lot of water evaporating and condensing in the atm every day, and that’s iirc 4.21KJ/Kg.K
The atm transfers energy into water vapor during the day, and on clear calm nights, it releases it to slow the cooling rate.
should have used this graph, has max temp as well
HI Javier,
Just to add one more thought on the ‘CO2 has little (or no) effect on global temperature’, I would refer you to a chart that Bill Illis has produced, showing 750 million years of CO2 vs Average Global Temperature (maybe we can sweet-talk a mod or Dr. Illis himself to post the chart again — — I have it stored on my hard drive, and would post it myself, but techy-stuff is NOT my strong suit).
What Dr. Illis’ chart shows is that CO2 and temperature are independent of each other. Earth climate is a coupled, non-linear dynamic system; that it should respond to (essentially) a single input is unreasonable at best, and impossible in such a system.
If CO2 was such a “powerful” greenhouse gas, then the Cryogenian glacial episodes should have been impossible: Geologic Time Scale publications (GTS 2004, GTS 2012, GTS 2016) by Gradstein et al, suggest that CO2 concentrations in the Proterozoic varied from a low of about 4% (NOT ppm!) up to some 13% (and some researchers believe it was even higher during the NeoProterozoic, the very time that the Cryogenian Period was in full swing). Further, in the Ediacaran Period, the Earth was generally warm (see “Ediacaran Fauna”) while CO2 concentrations were declining.
If this does not suggest that Earth climate is insensitive to how much carbon dioxide is in the atmosphere, I do not know what else could help you to see that ‘sensitivity’ is near zero. The “estimates” being bandied about are, in my opinion, based on junk science. From what I can see, the IPCC is the only organization holding to the 3.2 Celsius degrees per doubling. Published studies (2011 – present) are coming in lower, and the trend is towards Lindzen and Choi’s value of 0.7 Celsius degrees.
I do hope that helps; I know JoNova has a summary chart of the published studies of ECS; Anthony may have it also, somewhere. It was interesting to plot the data and run an LSR on it — — distinct negative slope.
And, finally, I am NOT trying to pick a fight with you, or anyone. If CO2 has any power as a “greenhouse” gas, it would have fried the Earth a few billion years ago. I am going to use a term to get a mod to look at this post: I’m a denier (h/t M4GW), and have been since my undergrad days in the 1970’s. That ‘global cooling’ scare and ‘new ice age’ was just hype, the same as ‘climate change’ is today.
Best regards to you, and yours,
The Mostest Deplorablest Vlad the Impalerest
Hi Vlad. I am aware of reconstructed CO2 levels and temperatures for the Phanerozoic. I do not think you can conclude from that data that CO2 does not cause warming. Let’s remember that CO2 has a logarithmic effect on temperatures and thus saturates, so from a certain point more CO2 does not cause more warming. Let’s also not forget that the sun is believed to have been cooler in the distant past.
The relationship between CO2 and temperatures is unclear. There is no evidence that supports that CO2 does not cause warming. Therefore saying that it doesn’t is unwarranted.
Well I disagree with all of you – Alan, Javier, Gustave, Dan on the effects of CO2.
In the laboratory CO2 absorbs certain wavelengths of IR and slows down exit of this radiation from a ceteris paribus atmosphere. In the real atmosphere, a number of factors confound what CO2 is actually capable of doing.Evaporation and rapid rise of this moist warm air bypasses the troposphere and the heat is readily emitted to space.
The rapid greening of the planet took climate science by surprise (14% increase in forest cover an example) and an even bigger analogue is taking place in oceans with phytoplankton + calccarb shell formation.
In both places, these sequestered atmospheric CO2 processes are exponential and endothermic (cooling! who would have thought? ) and in the case of the sea, this drives increasing dissolution of CO2 from the atmosphere into the sea. The carbon cycle formulae have to be altered to capture this unexpected magnitude of the biosphere’s productivity response.
All these things undo a simple highschool view of the adventures of atmospheric CO2. And there are clouds, and there is reduced demand for water by the rapidly growing plants… etc, etc.
While correlation is not necessarily causation, it’s certainly necessary to a high degree to establish causation. Although the 11-yr Schwabe cycle of sunspots is patently incoherent with estimates of GAST, there is significant coherence at much longer periods, as revealed by the envelope of solar activity.
That’s only true when you have a single main cause. Temperatures are likely to be affected by many factors and therefore should not be expected to track any of them. You cannot rule them out just because they don’t show correlation.
Temperatures are likely to be affected by water vapor content, clouds, greenhouse gases, solar variability, volcanic activity, internal variability, and who knows what else. Why should temperatures track any single one of them?
Allan:
TEMPERATURE, AT ALL MEASURED TIME SCALES, DRIVES CO2 MUCH MORE THAN CO2 DRIVES TEMPERATURE.
Which is true for the variability of ~5 ppmv/K over the seasons, for the year by year variability around the trend of ~4-5 ppmv/K and for the ~16 ppmv/K over glacial-interglacial transitions.
Which is absolutely not true for the >120 ppmv/K since ~1850, which can’t be caused by temperature, as that violates Henry’s law for the solubility of CO2 in seawater. Since ~1850, CO2 leads temperature.
If the lead of CO2 has much influence on temperature is an entirely different question, but one can’t deduce anything from the lead/lag between temperature and CO2 over the past 167 years…
In my opinion, the effect is small: if we may assume that most of the variability in temperature is natural variability, then the influence of CO2 should mainly be visible in the small difference in trend between the two full natural cycles: 1910-1975 and 1976-2030 (endpoint not exactly known), where 1945-1975 shows a small cooling, but 2000-current not.
Completely agree Ferdinand, as usual. I also think that the fact that the world has not cooled since about 2006 is because of CO2. In my opinion CO2 does not affect the rate of warming.
Here we can see that the rate of warming doesn’t go beyond +0.4°C/decade, however the rate of cooling has been decreasing from -0.4°C/decade in 1900 to 0°C/decade in 2000.
http://i.imgur.com/eiLcp2s.gif
Javier,
Met Office “data” aren’t fit for the purpose to which you’ve tried to put them. They are antiscientific packs of lies by bureaucrats. Just as economic “statistics” perpetrated by governments aren’t fit for any scientific purpose. Governments all lie.
=========================
“ripshin June 7, 2017 at 8:23 am
Gustaf,
Thanks for sharing the link to specific heats, those seem like valuable data points to keep in mind. And, just to be clear, your point is simply that increasing the partial pressure of CO2 in air will naturally lower the specific heat capacity of air due to the lower relative values (Cp and Cv) of CO2 to air?”
=========================
Rip what you’re seeing is what I’m saying: that there is a law of physics for calculating the temperature of any volume of atmospheric mix. Each time that mix has CO2 added, it’s temperature,
not ”may” or ”should” – must: it’s temperature must go down, if other things remain equal. Thats what the chart is about: you can see how much energy each gas, when pure, and atmospheric mix, hold.
This chart directly refutes the green house gas warming claim, from several directions, and it’s proven by the fact you have for the first time in history, a field of ”science” claiming it’s above proving it’s telling the truth.
One of the times you see people telling falsehood is that ”for years scientists back into the 1800s, Arrhenius, Fourier, whomever – have been telling us CO2 added to our atmsosphere makes it warmer.”
This is false. For awhile, until it was made possible to test, a few scientists thought this was potentially possible but when the specific energies or heats, of gases and the atmosphere, were solved sufficiently to write a law, the chart, I linked to, followed, and people stopped trying to claim CO2 enriched mix makes the mix warmer.
There’s the problem with people who can’t come to the right answer, when you simply ask them, ”Well, what would happen if there was a light warmed rock, and less light reached it?”
These people are simply interested in promoting the fraud independent of all science. Its their idea of fun things to think so to hell with reality and all science proving them utterly wrong.
The world has been brainwashed by profiteers swearing that in their best estimation, scientific analysis shows green house gases warm the planet.
The most direct way to show a whole room full of people how wrong that always was – always – is to step them through the steps of this, in simplified terms.
There’s a rock.
It’s warmed by light from a fire.
When more firelight warms it, it gets warmer.
When less firelight warms it, it gets cooler.
The claim about green house gases warming this planet,
is that a rock in vacuum of space receiving full sunlight from a nearby source,
has subsequently been shown or proven, to have a cold, turbulent, light blocking bath of compressible fluids, form around it: conduction stripping heat from the rock and to a lesser degree stopping light from ever even reaching the planet.
This is before addition of any green house gases at all. Oxygen blocks a trifling percent from reaching the planet through the characteristic scattering during daylight blue-sky condtions. The blue light we see doesn’t ever hit the planet. This surface energy density reduction is dwarfed many, many times,
by the light reduction, the surface energy density reduction that occurs when they stop 20% of total sunlight from ever reaching the earth. The claim of green house gas warming of the planet is that the
cold gases
stopping 20% total firelight from ever reaching a rock
which subsequently, conduction strip energy from the rock
and one of which creates an actual phase change atmospheric/surface refrigeration cycle
are a heater. The atmosphere is not a heater in any sense of the word whatever. It’s a cold thermally conductive, light blocking bath:
and suspension of more and more light blocking, refractive insulation into the bath,
such that less and less light reaches the light warmed rock,
can not make more and more light come leaking back out.
That’s simply a direct inversion of the actual process of energy gain and loss.
So it’s a scam in every direction you look. It started out – as a grants scam passed between government bureau supervisors, and when Al Gore’s movie exposed it, the lid blew off, and the government employee unions have been playing a game called ”let’s not get indicted for all our thefts and frauds perpetrated on the people paying us to do science.”
They haven’t been doing science.
They’ve been telling you and your children in school,
that less and less light, reaching a light warmed rock,
makes more and more light leave that less-light warmed, rock.
Hello Ferdinand,
I wrote and you quoted: “TEMPERATURE, AT ALL MEASURED TIME SCALES, DRIVES CO2 MUCH MORE THAN CO2 DRIVES TEMPERATURE.”
My following comments are in CAPS for clarity ( I AM NOT SHOUTING!!! 🙂 ):
You wrote:
“Which is true for the variability of ~5 ppmv/K over the seasons, for the year by year variability around the trend of ~4-5 ppmv/K and for the ~16 ppmv/K over glacial-interglacial transitions.” PROBABLY OK – BUT I HAVE NOT RECENTLY CHECKED ALL THESE NUMBERS.
You wrote:
“Which is absolutely not true for the >120 ppmv/K since ~1850, which can’t be caused by temperature, as that violates Henry’s law for the solubility of CO2 in seawater.“
AND I AM NOT CLAIMING THAT, WHICH YOU SHOULD KNOW BY NOW. AS I HAVE WRITTEN MANY TIMES, I AM AGNOSTIC ON THIS POINT (YOUR “MASS BALANCE ARGUMENT”, ETC.) – LOOK ABOVE, WHERE I WROTE: “THIS DOES NOT MEAN THAT TEMPERATURE IS THE ONLY (OR EVEN THE PRIMARY) DRIVER OF INCREASING ATMOSPHERIC CO2. OTHER DRIVERS OF CO2 COULD INCLUDE DEFORESTATION, FOSSIL FUEL COMBUSTION, ETC. BUT THAT DOES NOT MATTER FOR THIS ANALYSIS, BECAUSE THE ONLY SIGNAL THAT IS APPARENT IN THE DATA IS THE LAG OF CO2 AFTER TEMPERATURE.” IN SHORT, YOUR ABOVE-STATED ARGUMENT IS IRRELEVANT IN THIS INSTANCE.
You also wrote:
“Since ~1850, CO2 leads temperature.”
HERE WE CLEARLY DISAGREE – APPARENTLY ACCORDING TO YOUR DEFINITION, SINCE ATMOSPHERIC CO2 HAS USUALLY INCREASED SINCE ~1850, AND TEMPERATURES HAVE USUALLY INCREASED SINCE~1850, THEN CO2 LEADS TEMPERATURE OVER THIS PERIOD. BUT IT DOES NOT – THERE IS NO CLEAR CORRELATION AND THERE ARE CLEAR EXCEPTIONS.
FOR EXAMPLE, NOTE THAT CO2 INCREASED DURING THE 1940-1970 COOLING PERIOD! AND THERE IS ALSO THE “PAUSE”.
BUT ON TOP OF THIS INCREASING CO2 THERE IS THE CLEAR SIGNAL THAT dCO2/dt VARIES WITH TEMPERATURE, AND ITS INTEGRAL CO2 LAGS TEMPERATURE BY ~9 MONTHS. THIS SIGNAL, WHICH SURVIVES THROUGH WARMING AND COOLING PERIODS, IS THE KEY TO THE MAGNITUDE OF ECS, WHICH MUST BE QUITE SMALL – IF CO2 WAS A TRULY SIGNIFICANT DRIVER OF TEMPERATURE, THIS SIGNAL WOULD BE DROWNED OUT BY THE IMPACT OF CO2 ON TEMPERATURE – IN SUMMARY, IF CO2 WAS TRULY A MAJOR DRIVER OF GLOBAL TEMPERATURE, THIS SIGNAL WOULD NOT EXIST, AND YET IT DOES.
You also wrote:
“If the lead of CO2 has much influence on temperature is an entirely different question, but one can’t deduce anything from the lead/lag between temperature and CO2 over the past 167 years…”
I BELIEVE WE CAN DEDUCE CERTAIN VALUABLE INFORMATION. THE MODERN DATA RECORD SHOWS THE NET EFFECT:
~4-5 ppmv/K = (THE IMPACT OF TEMPERATURE ON CO2) MINUS (THE IMPACT OF CO2 ON TEMPERATURE)
WE MAY HAVE ENOUGH INFORMATION TO BOUND THESE NUMBERS, AND ECS WILL BE VERY LOW. MY GUESS IS THAT ECS IS SO SMALL AS TO BE PRACTICALLY INSIGNIFICANT.
FINALLY YOU WROTE: “In my opinion, the effect is small: if we may assume that most of the variability in temperature is natural variability, then the influence of CO2 should mainly be visible in the small difference in trend between the two full natural cycles: 1910-1975 and 1976-2030 (endpoint not exactly known), where 1945-1975 shows a small cooling, but 2000-current not.
YES, I AGREE, THIS IS MY FIRST ARGUMENT POSTED ABOVE.
FURTHERMORE, IT IS THE OBLIGATION OF THOSE WHO ADVOCATE A HIGH LEVEL OF ECS TO PROVE IT, AND THEY HAVE UTTERLY FAILED TO DO SO AND THERE IS AMPLE EVIDENCE THAT THEY ARE WRONG – THE NULL HYPOTHESIS STANDS – THERE IS NO REAL GLOBAL WARMING CRISIS.
REGARDS, ALLAN
Thank you all for your interesting comments – a most worthwhile discussion, and quite civilized. Very little throwing of sand, which is a refreshing change. 🙂
Micro: Fascinating data, thank you! Is this data all “before adjustments”?
Leif: There seems to be a fair correlation between THE INTEGRAL of solar activity and global temperature, moderated by the PDO – for example Dan Pangburn’s work and that of others. Steady now! Breathe deeply 100 times before replying. 🙂
Ferdinand, my reply to you is posted below – apologies for placing it in the wrong location. Please do not continue to drag in your Mass Balance Argument, which is interesting but irrelevant in this instance.
Javier, you cannot “completely agree” with Ferdinand that ECS is quite low, and disagree with me on the same point, without being “completely inconsistent”. 🙂
Gary, I expect we will soon experience natural global cooling due to the crash in solar activity – I hope to be wrong about this – but we really do NOT need to have the warmists switch sides and blame CO2 for this cooling, which would be the outcome of your hypo. How much cooling effect are you actually claiming? An ECS of negative what? Significance?
Some more evidence re very low ECS:
https://wattsupwiththat.com/2017/01/23/december-2016-global-surface-landocean-and-lower-troposphere-temperature-anomaly-update-with-a-look-at-the-year-end-annual-results/comment-page-1/#comment-2404993
“My work suggests that The Pause would extend back to 1982, were it not for two huge volcanoes in 1982 and 1991; Bill Illis’s work suggests The Pause extends back to at least 1958.
Since there was global cooling from about ~1940 to ~1975, one could conclude that there has been no net global warming since about 1940.”
I think this is the best discussion I’ve seen on this subject to date, and again I thank all of you. In time, we will “worry the truth” out of this question.
Regards, Allan
It is QA’d, but I have no info on whether other adjustments were made. But I recently found it was the Air Forces version of the data. And suspect they would be against post decadal adjustments.
Hi Allan,
Oh yes I can. There is a huge difference between saying that the evidence is consistent with a low equilibrium climate sensitivity, and saying that “Earth’s climate is insensitive to increased atmospheric CO2.·” While my position can be supported on published peer-reviewed scientific literature, yours can not.
Hi Javier,
Re: your post 07 June 1445 hours
Thanks for your discussion on this. I do agree: in the past, the sun that we know was somewhat cooler than now; best estimates are (compared to the time of formation of the solar system) the star we see now is about 30% more luminous; since Cambrian time, luminosity is about 3% higher now, compared to then.
As far as temperature and CO2 concentration(s), I still find it interesting that a relationship between the two cannot be established. The appearance of ice ages at times of high-CO2-concentration, and warm events regardless of CO2-concentration (and solar luminosity) suggests strongly to me that any “estimates” of ECS are probably very wrong. Even the name, “ECS” is wrong, by virtue of the probable INsensitivity of the climate to CO2 changes.
I only suggest that we discard any consideration of the climate having a response to some CO2 “forcing”, logarithmic or otherwise, because there simply isn’t one. Anything that CO2 might or could do, is completely swamped by the more powerful “greenhouse” gas, water vapor. If CO2 plays any role in global climate, it is much more observer than participant.
Best regards to all,
The Mostest Deplorablest Vlad the Impalerest
Hi Vlad,
In science you discard hypotheses when they are incompatible with the data and not when there is absence of evidence.
First physical principles indicate CO2 should cause some warming. How much? We don’t know because we don’t understand how the climate system responds to the increase in CO2.
My own personal opinion is that anthropogenic CO2 emissions responsible for the increase in atmospheric CO2 have contributed somewhat to the modern warming, and the evidence is that globally glaciers have retreated more than what they should have, to a point last seen about 5000 years ago. That’s why Ötzi, the iceman from Tirol was uncovered now. And this is just an example. Glacierologists have a clear understanding and the evidence to show that the present glacier retreat is unusual, specially for this late in the Neoglacial period.
I don’t think it is a sound scientific position to defend that CO2 causes no warming at all. How much warming is the question to solve.
The one that matters, heat retention through radiative processes?


Water vapor self adjusts to regulate cooling as air temp nears dew point. A 24 hr heat storage cycle.
A few random days.
Almost 80 million station days, dew point and min temp have almost a 98% correlation.
Dew points follow how warm moist tropical air is blown poleward to cool. So Ocean warm pools, moving around alter down wind air temperatures. Plus any albedo changes from differences in cloud cover.
We are dealing with a massive and complex system with all kinds of sinks for heat and cold. How that all comes into play is anyone’s guess. I possess a Master’s Degree in Meteorology and I think some of the thinks that happen are like dropping a pebble in a quiet lake and observing the effect on the steady-state system….observe the expanding ring on the surface. Not a very big deal.
I am not worried in the least about global warming. We will always have oscillations in climate. That’s just the way it is. I don’t think men are capable of pushing it very far in either direction. Now if we get a big volcano that puts a lot of dirt in the atmosphere for 3-4 years….we had better dig out those long johns…
William Sturm
The list of factors affecting LOCAL or regional temperatures is, of course, much longer than that affecting the GLOBAL average on a persistent basis. Most of those factors integrate out to effective ZERO contribution to the long-term values of GAST. I’m addressing the “climate science” claim that CO2 is the “control knob” for GAST–a claim wholly unsupported by cross-spectral relationships between the two variables. They are either incoherent or CO2 appreciably lags GAST. Despite Ferdinand Engelbeen’s claim to the contrary, this relationship is not confined to the seasonal cycle, but holds robustly when that cycle is removed.
You don’t know that. You assume that, and assumptions are very often wrong.
Javier:
You seem to assume that integral conservation laws of thermodynamics can be readily violated by complex systems. Time and again such assumptions prove grossly wrong.
Instead of assuming philosophical rectitude, try doing some brass-tacks “black-box” system analysis with validated climate data. You’ll find that the critical “forcing” claims of “climate science” are pure conceit.
1sky1,
I don’t assume such thing. You are letting your imagination run too free. All I am saying is that you cannot possibly know if all the factors that affect temperatures “integrate out to effective ZERO contribution to the long-term values of GAST.” GAST changes with time as we know, so it is very likely that the factors that affect temperatures are behind that, so they can’t possibly integrate out to zero contribution. There is a LIA, you know? changes in the factors that affect temperature must have caused it.
IMO albedo is liable to be an important feedback effect of centennial scale fluctuations in insolation, producing such cyclic variations as the Medieval WP and LIA. As ice grows, so too does earth’s reflectivity.
CO2 will also come in and out of solution with SST changes, but its effect is trivial.
javier: co2 does not lag temperature
when we are digging up fossil fuels and
burning them, regardless of any temperature
change.
do you honestly not understand this??
Of course I do. I was discussing naturally produced CO2, not anthropogenic CO2. If we are producing the CO2 then obviously it is not responding to a temperature rise. This is so obvious that doesn’t merit stating it.
javier, there is direct evidence that
co2 is causing modern warming — are
you aware of it?
ps: temp leading co2 isn’t always true
naturally, either — you should study the
paleocene eocene thermal maximum, where a
big slug of carbon preceded several degrees of
warming.
crackers345

I could not find any evidence that CO2 is causing any warming.
To give a summary of all my investigations into climate change starting ca. 2009/2010
Concerned to show that man made warming (AGW ) is correct and indeed happening, I thought that here [in Pretoria, South Africa} I could easily prove that. Namely the logic following from AGW theory is that more CO2 would trap heat on earth, hence we should find minimum temperature (T) rising pushing up the mean T. Here, in the winter months, we hardly have any rain but we have many people burning fossil fuels to keep warm at night. On any particular cold winter’s day that results in the town area being covered with a greyish layer of air, viewable on a high hill outside town in the early morning.
I figured that as the population increased over the past 40 years, the results of my analysis of the data [of a Pretoria weather station] must show minimum T rising, particularly in the winter months. Much to my surprise I found that the opposite was happening: minimum T here was falling, any month….I first thought that somebody must have made a mistake: the extra CO2 was cooling the atmosphere, ‘not warming it. As a chemist, that made sense to me as I knew that whilst there were absorptions of CO2 in the area of the spectrum where earth emits, there are also the areas of absorption in the 1-2 um and the 4-5 um range where the sun emits. Not convinced either way by my deliberations and discussions as on a number of websites, I first looked at a number of weather stations around me, to give me an indication of what was happening:
The results puzzled me even more. Somebody [God/Nature] was throwing a ball at me…..The speed of cooling followed a certain pattern, best described by a quadratic function.
I carefully looked at my earth globe and decided on a particular sampling procedure to find out what, if any, the global result would be. Here is my final result on that:
Hence, looking at my final Rsquare on that, I figured out that there is no AGW, at least not measurable.
Arguing with me that 99% of all scientists disagree with me is useless. You cannot have an “election” about science.
Crackers 345, I wait for you to prove to me, preferably from your own observations, that more CO2 causes [more] warming
No. As far as I know nobody has been able to measure it. All the calculations include assumptions and suppositions that we don’t know if they are true.
The PETM is estimated to have taken place ~ 55.5 million years ago. We lack the resolution to know more exactly when it took place, much less to know if temperatures preceded CO2 or not. Again it is a case of assumptions being made.
Hi Javier,
Re: 09 June at 0815 hours
At the risk of being pedantic, or worse, I will see if I can help you understand my position on the effect (or lack thereof) of CO2 causing any atmospheric heating, or temperature change.
You stated this: “First physical principles indicate CO2 should cause some warming. How much? We don’t know because we don’t understand how the climate system responds to the increase in CO2.”
I agree: in the open atmosphere, we do NOT have a good number for the so-called ECS or heating effect of a change in carbon dioxide concentration. You previously stated that the effect is logarithmic, which I also agree with, so any increase provides less additional heating (if it provides any at all), in an asymptotic fashion. So, we do not know how much heating it provides, and what ever it does provide is diminishing in effect, as the concentration increases. So far, we appear to be on the same sheet of music.
I think the evidence for the diminishing effect, and the lack of a firm value for how much temperature change can be expected, is Bill Illis’ chart. The lack of correlation between the two variables is strong evidence that CO2 does not even make a dent in temperature, or temperature change. There are too many other factors, of greater significance, than CO2. You even stated: “That’s only true when you have a single main cause. Temperatures are likely to be affected by many factors and therefore should not be expected to track any of them.” (at 07 June at 1452 hours) Temperatures and temperature changes are affected by MANY causes; I agree completely. Other factors are much more powerful than CO2. If CO2 has an effect, it is essentially minuscule. If CO2 is “forcing” in one direction, is it not possible that several other things are “forcing” in the opposite direction?
And you said: “Temperatures are likely to be affected by water vapor content, clouds, greenhouse gases, solar variability, volcanic activity, internal variability [!!!!! —-my empahsis], and who knows what else. Why should temperatures track any single one of them?” (same citation) I agree; why would temperatures track any single variable? If temperatures do not track a specified variable, then the “forcing” for that variable should tend to be considered insignificant or overwhelmed by other, more powerful variables. You mentioned quite a few things; water vapor alone swamps CO2’s supposed effect. I cannot see anything that shows that CO2 is even a minor player in global climate. You’ve even stated that temperatures have changed all the time. Where do we see that CO2 caused any of those changes? There’s too many other factors to consider.
There is also this: “My own personal opinion is that anthropogenic CO2 emissions responsible for the increase in atmospheric CO2 have contributed somewhat to the modern warming, and the evidence is that globally glaciers have retreated more than what they should have, to a point last seen about 5000 years ago. That’s why Ötzi, the iceman from Tirol was uncovered now. And this is just an example. Glacierologists (sic) have a clear understanding and the evidence to show that the present glacier retreat is unusual, specially (sic) for this late in the Neoglacial (sic) period.”
Anthropogenic CO2 emissions (and the increase in CO2 concentrations) have contributed to the modern warming. OK, fine; how much? Can’t quantify it? How much of the ‘modern warming’ is due to CO2? If you supply the hypothesis that CO2 affects temperature, then what part of the modern warming is due to the increase in CO2? As the concentration increases, the logarithmic drop-off comes into play, so as we add more CO2, there is less ‘CO2-forced’ warming.
I’m going to take issue with this statement, as a geologist (certified by my State of residence; evidence upon request): “Glacierologists (sic) have a clear understanding and the evidence to show that the present glacier retreat is unusual, specially (sic) for this late in the Neoglacial (sic) period.”
First, glaciologists know that a glacier is a mass balance: there is a zone of accumulation, and a zone of ablation. Whether or not a glacier changes its mass balance is a function of what happens in the zone of accumulation vs. the zone of ablation: if there is more accumulation than ablation, the glacier advances. If there is more ablation than accumulation, the glacier retreats.
Temperature is only one factor that glaciers respond to. Mass-balance is a larger influence than temperature alone.
You cite Otzi, who passed away in a meadow while transitioning a fairly high pass (evidence suggests that he was attacked, last I heard). That means the meadow was ice-free; subsequently, he was covered by snow, ice, and eventually, the glacier, which in our modern era, has been in retreat. Was the previously open meadow an ‘ … unusual retreat … ‘ of that particular ice field? How do you know?
Second, glacier retreat/advance is something that has happened any time we are in an interglacial episode, which is what the Holocene Epoch is. I do not have any familiarity with the ‘Neoglacial’ period; please elaborate, if you will.
We also know that the changes we are seeing today are NOT unusual. Before Vostok and EPICA (among others), the prevailing idea was that transitions between glacial and interglacial conditions were very slow. Retreating glaciers, particularly in Europe, led to the conclusion that transitions took place very fast — — — initially, the time frame was narrowed to a few centuries. Now, we have glaciologists who argue that the transitions are between three and six (or even seven) Celsius degrees in a FEW DECADES! Alley is even arguing that a decade is the more likely time frame.
We live in a ‘modern’ warming which is expressed as about a Celsius degree, in a time frame approaching one-hundred fifty years; this is vastly insignificant compared to glacial/interglacial transitions.
I would urge caution in trying to tie any of the modern warming to changes in CO2 concentration. The geological record says climate changes do not even notice CO2. There are too many other factors than can, and do, affect temperature changes.
Sorry for the overly-long post; there was a lot to cover. Bottom line: climate sensitivity to CO2 is near zero; there is insufficient evidence to suggest that CO2 is even a factor in ‘modern’ warming. If you disagree, then we must agree that we disagree.
Thanks for your posts; my regards to you, Anthony, and our unsung hero Mods,
The MOSTEST Deplorablest Vlad the IMPALEREST
Vlad, I can’t help but notice the contradiction between you agreeing that we don’t know how much warming CO2 causes and stating that climate sensitivity to CO2 is near zero. Either we don’t know or we know. And I say we don’t.
You appear to place the evidence in Bill Illis chart. Sorry, that won’t cut it.
Let’s start with paleo CO2. There are proxy measures only at certain times and they show huge differences. What you take as past CO2 levels is the output of a computer program Geocarb III that is believed to be the best info available, but that it has huge error bars.
Then we go to temperatures. Bill Illis chart is based on Veizer’s d18O data. This temperature reconstruction is contested by Royer et al., 2004 on the basis of changes on pH.
The bottom line is that Bill Illis chart DOES NOT CONSTITUTE EVIDENCE, and pretty much one can defend one thing or the opposite with the data we have from the distant past.
If the argument can’t be resolved with the data from the past few million years much less with the data from the distant past.
javier, about the PETM, see
‘Two massive, rapid releases of carbon during
the onset of the Palaeocene–Eocene
thermal maximum,’ Gabriel J. Bowen+
http://www.nature.com/ngeo/journal/v8/n1/full/ngeo2316.html
crackers345,
It doesn’t matter. We simply lack the resolution to say if temperatures or CO2 increased first at the PETM. The resolution we have at the time is at best on the millennial scale. Supposedly CO2 acts instantaneously once added.
Javier:
By putting words in my mouth, you’re letting your imagination run wild. I never said that “ALL the factors that affect temperatures integrate out effectively to zero…” All I said was that “MOST of the factors” [in your list] do so in the long run, having in mind those (such as ocean currents, winds, and convection) that merely redistribute thermal energy within a closed system, instead of changing its global integral value. To be sure, dry-bulb temperature is not a complete measure of thermal energy in the air, but their variations are highly correlated nevertheless.
Let’s not retreat into complete ignorance of physical fundamentals and widely observed empirical relationships. No matter how complicated the system or diverse its inputs, the dominant drivers produce responses that are significantly coherent and LAG in phase. That’s the challenge that CO2 has not been able to meet demonstrably in situ.
1sky1,
They are either incoherent or CO2 appreciably lags GAST.
That is the modern overconfidence in spectral analysis…
The problem is that we have two variables influencing CO2 in the atmosphere: temperature and emissions. The first has a lot of variability and a small trend, the second has a firm trend and no measurable variability (in the Mauna Loa measurements).
If you make a spectral analysis, you see all the variability caused by temperature, thus giving a nice coherence – with a lag – between CO2 and temperature and no coherence with human emissions.
The problem is that by looking at the variability only, one can’t see the influence of the emissions, as these have no measurable variability and in the derivatives one even has removed almost all of the trends of the emissions and CO2 increase…
That makes that a lot of skeptics are falling in that trap and declare that the coherence between temperature and CO2 rate of change is the cause of the increase, while all what the coherence shows is that temperature is the cause of the +/- 1.5 ppmv variability around the trend and that says next to nothing about the cause of the +90 ppmv trend with +170 ppmv human emissions over the same period…
The opposite is hardly measurable: in theory, the current 110 ppmv is good for an increase of ~0.5 K, only based on physics without any positive or negative feedback. The increase in temperature since Mauna Loa started is about 0.8 K in HadCRU4 (assuming for once that they are right). The problem is that one can’t make a differentiation between the natural and human contribution, except that it looks like that the increase rates 1910-1975 and 1976-current are only slightly different, while CO2 increased a fourfold and more over the second period. That means that the influence of CO2 is small…
Ferdinand:
That’s very far from the actual case! In yearly-average data, the emissions overwhelm the natural variations of CO2 at Mauna Loa and do vary appreciably year-to-year; they’re not simply a straight-line trend. Consequently the time series of yearly differences (what you inaccurately call derivatives) not only has a non-zero mean, but significant spectral content throughout the entire baseband range of frequencies (zero to half-cycle per annum). Proper cross-spectrum analysis between this time-series and unbiased estimates of GAST (obtained independently from vetted, century-long station records) clearly shows that the CO2 differences are either incoherent or FAIL to lead the phase of GAST estimates enough at significantly coherent frequencies to constitute a physically realizable driver of GAST.
Modern signal and system analysis methods have been instrumental in unraveling relationships between variables in virtually all of the sciences, but are strikingly unknown and/or misapplied in “climate science.” There is no “modern overconfidence in spectrum analysis,” as you surmise.
The heat capacities in the table cited by Gustav are per kilo not per mol. When you compensate for the higher molar mass of CO2 than that of air you should find that it has a higher heat capacity than air. Air is mainly composed of molecules with 2 atoms whereas CO2 has three atoms and so has at ambient temperature a significantly higher heat capacity per mol than air. That is simple thermodynamics.
Thus a given volume of 2 samples of air all other things being equal the one containing the most Carbon dioxide will have the highest heat capacity.That is per mol of gas!as Gustav you quote heat capacities per kg in the beginning and then go on to use heat capacities per mol!
Although I am not sure what heat capacity of CO2 has to do with global warming it is the spectroscopic characteristics of the molecule that is causing the warming effects.
Hi Javier,
Yes, I can see that you think it is a contradiction: we don’t know what the effect is. Since we can’t get a quanitification on the effect, then it COULD have a near-vanishing effect, along with the logarithmic decay, correct? If we cannot establish that there is some connection between two factors, then is it possible that there isn’t even a connection at all?
A quantifiable connection does not have to easy to discern, but it should be measurable to one degree or another. If, after thirty-plus years of searching, we still do not have anything close to reasonable value, then the evidence is pointing strongly to the conclusion that there is no connection, no correlation, no effect. You have agreed that we do not know the effect; with all of our ability to make measurements, calculations, etc, we STILL cannot nail down a number. Maybe, just maybe, that number is “zero”.
If you have something better than Berner & Kothavala (cited frequently in the literature), and Veizer (also cited frequently) then I know that the members of WUWT would eagerly accept it. Royer is a reference I rarely find being cited. If Dr. Illis’ chart is so in error (GTS 2004, 2012, and 2016 back up Bill), then publish a correction; point out specifically where Dr. Illis is wrong, and what the correct values are. If I were to publish something, and it was in error, I would welcome correction (it just makes the whole thing better in the long run). It is possible that Dr. Illis would welcome your corrections as well. I admire his effort; it speaks volumes for the idea that CO2 and global temperature are independent of each other.
If you choose to criticize it, then you should be prepared to replace it with a more ‘correct’ version. I note that the Veizer data Dr. Illis used ends in the mid-Ordovician, yet his chart extends to the very late Tonian Period. I suspect that in the next few years, we may even be looking at paleotemperature information from the Stenian Period, in the MesoProterozoic Era.
My regards to you and yours,
The Mostest Deplorablest Vlad the Impalerest
Vlad,
“Non sequitur.” You cannot reach any conclusion from a lack of knowledge.
Certainly zero cannot be ruled out, but it is a low probability value.
I don’t know if Bill Illis chart is wrong or not. It is based on published data, but there are other published reconstructions that differ. For example Royer et al., 2004

I cannot say which reconstruction better represents past temperatures (blue curve represents Veizer, red and dashed are Royer’s). Can you? The bottom line is that with available data one can defend one position or the opposite, so it is obvious that you cannot demonstrate CO2 lack of effect with phanerozoic data.
No it does not. That’s not the way that question is going to be answered.
1sky1,
I have responded href=”https://wattsupwiththat.com/2017/06/06/solar-update-june-2017-the-sun-is-slumping-and-headed-even-lower/comment-page-1/#comment-2524822″>down the whole list of discussions, as it gets too messy here…
Greetings Javier,
Then we just disagree; I see strong evidence for a small, or vanishingly-small, effect from CO2 on the Earth climate system. Paleodata are what geologists use. You make your own non-sequitur by saying that we cannot know something from ancient information. Oh, yes we can. This is the very essence of geology and related geosciences.
Carbon dioxide’s effect, if any, is insignificant, against a myriad of other effects. Not being quantifiable is powerful information. If we cannot discern a value, then the value may be too small to discern. It is far from a, ” … lack of knowledge … “. It is an indication of a very small value.
Do stay in good health; do live long, and do prosper, for that helps all of us to live better lives.
Vlad
Excess winter deaths are largely flu – they do not relate directly or mostly to cold homes.
Germany has the world’s most reliable electricity grid – and 32% non-hydro renewables. solar has not made it one bit less reliable.
People get the flu more easily when they are stressed. The colder they are, the more stressed they are.
Your attempts at diversion, as always, fail.
Germany’s electric grid is only reliable because it is tied into surrounding grids that are largely fossil and nuclear powered.
Your repeated attempts to pretend that the German grid stands alone is amusing.
The fact is, Griff, that cold air holds less moisture than warm air. The dryer, cold air, when heated, becomes even drier and dries out protective mucous membranes, making them more susceptible to invasion by viral and bacterial agents. That, and crowding people into those arid indoor environments, such as schools, shopping centers, warming centers and homeless shelters makes transmission more likely. As an elderly person, I prefer to stay in my warm, humidified, isolated environment during winter. Haven’t had the flu since I was a kid. As far as Germany, it is not renewables that are replacing coal-fired plants; quite the opposite, The renewables are creating increased coal burning to back up the intermittent renewables that were advanced as a replacement for nuclear — not coal. As a result of declining nuclear sources, the intermittent renewables are now backed up by MORE coal, not less.
In winter, people spend more time indoors, in close contact with others, breathing in their germs. In summer, people spend more time outdoors, at the beach, lake, playing tennis, etc. where they are NOT in such close contact with many others.
“they do not relate”
Once again your facts are shallow Griff.
https://www.sciencedaily.com/releases/2008/03/080330203401.htm
https://www.sciencedaily.com/releases/2017/05/170515111601.htm
https://www.sciencedaily.com/releases/2012/12/121204162125.htm
Griff
Pseudo facts as usual.
During both 2015 and 2016 winters under peak load conditions, wind and solar provided approx. 1% of Germany’s electricity.
During both those winters Germany at least twice came within the critical 1minute of a country wide black-out, bailed out by French, Czeck and Polish electricity.
Crocodile Tears Merkel’s decision to shut down nuclear [Fukushima was the fig leaf, the real reason being to undercut the surging Greens in the Hesse state elections] has had the remarkable effect of Germany bringing back on line six mothballed coal fired plants and building eight new ones to keep the lights on and make sure German industry does not further off-shore itself.
So far the “energiewende” caper has caused the disappearance of some 150,000 high paying jobs.
At consumer electricity prices of 33 Euro cents / Kwh, Der Speigel is referring to domestic electricity as a “luxury goods” and energy poverty is now undisputed in the lower income groups.
A Cold Nose makes a good breeding ground for viruses.
I don’t know if Germany’s electrical service is more reliable than others. But it is undeniably one of the most expensive to customers. When you are trying to choose between heat and food on a limited budget, it is not surprising that you will suffer from the flu.
The German grid has had several near-crashes due to an over-reliance on wind power.
https://wattsupwiththat.com/2016/10/01/south-australias-blackout-apparently-triggered-by-the-violent-fluctuations-from-the-snowtown-wind-farms/comment-page-1/#comment-2310685
[excerpts]
There was a near-grid crash in Germany due to wind power on Christmas Eve, 2004, as cited in my post below from circa 2005.
Naturally, our imbecilic politicians cannot grasp this simple concept: “The wind does not blow all the time.”
Some of them believe that grid-scale storage is a current solution – it is not.
Imagine if the grid actually crashed at Christmas in Germany, instead of a near-miss. It would have been a disaster, costing billions due to frozen pipes, etc., and much human suffering.
Imagine if that happened in a colder country, like Canada, or the northern USA.
Source: Wind Report 2005, by E.On Netz, then the largest wind power generator in the world.
http://www.wind-watch.org/documents/wp-content/uploads/eonwindreport2005.pdf
**************************
My post from circa 2005 follows:
Here is a quotation from Wind Report 2005 by E.On Netz for the German wind power grid. As you can readily surmise, wind power is a huge problem for grid operators.
Within just two days, the entire generating capacity of German wind power disappeared, necessitating the startup of the equivalent of TWELVE 500 megawatt coal-fired power plants.
During the steepest drop on December 24, 2004, they lost the equivalent of one 500MW power plant every 30 minutes!
The truth is that wind power requires 100% backup from conventional power sources, a duplication of resources that makes wind power entirely uneconomic.
The feed-in capacity can change frequently within a few hours. This is shown in FIGURE 6, which reproduces the course of wind power feedin during the Christmas week from 20 to 26 December 2004.
“Whilst wind power feed-in at 9.15am on Christmas Eve reached its maximum for the year at 6,024MW, it fell to below 2,000MW within only 10 hours, a difference of over 4,000MW. This corresponds to the capacity of 8 x 500MW coal fired power station blocks. On Boxing Day, wind power feed-in in the E.ON grid fell to below 40MW.
Handling such significant differences in feed-in levels poses a major challenge to grid operators.”
I want to address Don Perry….just a bit further on. I am amused by his comment “The fact is, Griff, that cold air holds less moisture than warm air.”
An expert in a letter to the editor on May 17, 2017 in our local paper in a deep article entitled: IT’S SIMPLE PHYSICS”
” It is physics. Our weather has been warmer. Warmer air holds more moisture.
When it rains, it pours.”
My response………..
“Wow. Most of the nation (U.S.) just came out of a rather severe drought. You
folks claim it has been getting warmer for a long time. What held back all that rain.”
William Sturm
javier, the most convincing paper is by Rolf Philipona
and his group,
published in 2004. it shows an increase in the
greenhouse effect precisely at the frequencies where the
human ghgs absorb
http://onlinelibrary.wiley.com/doi/10.1029/2003GL018765/abstract
Oh and Gustave, the heat capacity of CO2 is irrelevant in this context. Its absorption of LWIR wavelengths is something different.
Hello Ferdinand,
I wrote and you quoted: “TEMPERATURE, AT ALL MEASURED TIME SCALES, DRIVES CO2 MUCH MORE THAN CO2 DRIVES TEMPERATURE.”
My following comments are in CAPS for clarity ( I AM NOT SHOUTING!!! 🙂 ):
You wrote:
“Which is true for the variability of ~5 ppmv/K over the seasons, for the year by year variability around the trend of ~4-5 ppmv/K and for the ~16 ppmv/K over glacial-interglacial transitions.” PROBABLY OK – BUT I HAVE NOT RECENTLY CHECKED ALL THESE NUMBERS.
You wrote:
“Which is absolutely not true for the >120 ppmv/K since ~1850, which can’t be caused by temperature, as that violates Henry’s law for the solubility of CO2 in seawater.“
AND I AM NOT CLAIMING THAT, WHICH YOU SHOULD KNOW BY NOW. AS I HAVE WRITTEN MANY TIMES, I AM AGNOSTIC ON THIS POINT (YOUR “MASS BALANCE ARGUMENT”, ETC.) – LOOK ABOVE, WHERE I WROTE: “THIS DOES NOT MEAN THAT TEMPERATURE IS THE ONLY (OR EVEN THE PRIMARY) DRIVER OF INCREASING ATMOSPHERIC CO2. OTHER DRIVERS OF CO2 COULD INCLUDE DEFORESTATION, FOSSIL FUEL COMBUSTION, ETC. BUT THAT DOES NOT MATTER FOR THIS ANALYSIS, BECAUSE THE ONLY SIGNAL THAT IS APPARENT IN THE DATA IS THE LAG OF CO2 AFTER TEMPERATURE.” IN SHORT, YOUR ABOVE-STATED ARGUMENT IS IRRELEVANT IN THIS INSTANCE.
You also wrote:
“Since ~1850, CO2 leads temperature.”
HERE WE CLEARLY DISAGREE – APPARENTLY ACCORDING TO YOUR DEFINITION, SINCE ATMOSPHERIC CO2 HAS USUALLY INCREASED SINCE ~1850, AND TEMPERATURES HAVE USUALLY INCREASED SINCE~1850, THEN CO2 LEADS TEMPERATURE OVER THIS PERIOD. BUT IT DOES NOT – THERE IS NO CLEAR CORRELATION AND THERE ARE CLEAR EXCEPTIONS.
FOR EXAMPLE, NOTE THAT CO2 INCREASED DURING THE 1940-1970 COOLING PERIOD! AND THERE IS ALSO THE “PAUSE”.
BUT ON TOP OF THIS INCREASING CO2 THERE IS THE CLEAR SIGNAL THAT dCO2/dt VARIES WITH TEMPERATURE, AND ITS INTEGRAL CO2 LAGS TEMPERATURE BY ~9 MONTHS. THIS SIGNAL, WHICH SURVIVES THROUGH WARMING AND COOLING PERIODS, IS THE KEY TO THE MAGNITUDE OF ECS, WHICH MUST BE QUITE SMALL – IF CO2 WAS A TRULY SIGNIFICANT DRIVER OF TEMPERATURE, THIS SIGNAL WOULD BE DROWNED OUT BY THE IMPACT OF CO2 ON TEMPERATURE – IN SUMMARY, IF CO2 WAS TRULY A MAJOR DRIVER OF GLOBAL TEMPERATURE, THIS SIGNAL WOULD NOT EXIST, AND YET IT DOES.
You also wrote:
“If the lead of CO2 has much influence on temperature is an entirely different question, but one can’t deduce anything from the lead/lag between temperature and CO2 over the past 167 years…”
I BELIEVE WE CAN DEDUCE CERTAIN VALUABLE INFORMATION. THE MODERN DATA RECORD SHOWS THE NET EFFECT:
~4-5 ppmv/K = (THE IMPACT OF TEMPERATURE ON CO2) MINUS (THE IMPACT OF CO2 ON TEMPERATURE)
WE MAY HAVE ENOUGH INFORMATION TO BOUND THESE NUMBERS, AND ECS WILL BE VERY LOW. MY GUESS IS THAT ECS IS SO SMALL AS TO BE PRACTICALLY INSIGNIFICANT.
FINALLY YOU WROTE: “In my opinion, the effect is small: if we may assume that most of the variability in temperature is natural variability, then the influence of CO2 should mainly be visible in the small difference in trend between the two full natural cycles: 1910-1975 and 1976-2030 (endpoint not exactly known), where 1945-1975 shows a small cooling, but 2000-current not.
YES, I AGREE, THIS IS MY FIRST ARGUMENT POSTED ABOVE.
FURTHERMORE, IT IS THE OBLIGATION OF THOSE WHO ADVOCATE A HIGH LEVEL OF ECS TO PROVE IT, AND THEY HAVE UTTERLY FAILED TO DO SO AND THERE IS AMPLE EVIDENCE THAT THEY ARE WRONG – THE NULL HYPOTHESIS STANDS – THERE IS NO REAL GLOBAL WARMING CRISIS.
REGARDS, ALLAN
Allan,
I will reply here, as the above sub-discussion is far too lengthy,,,
The only signal that is apparent in the data is the lag of CO2 after temperature
Sorry, that is not true: indeed CO2 and temperature both go more or less up since 1850, but the correlation is rather low, as there are near as much periods with zero to negative slopes in temperature, while CO2 goes up unabated… Thus you can’t say that CO2 lags temperature for the full period 1850-current, no matter what caused the CO2 increase.
All what you can say is that the year by year variability in the CO2 rise lags the year by year variability in temperature with several months. But that effect is just the noise of ~1.5 ppmv around a trend of ~90 ppmv since we have accurate measurements at Mauna Loa. That says next to nothing about the cause of the trend or what leads and lags in the trends.
Regardless the mass balance, there is no physical reason that 0.8 K ocean temperature increase should cause 110 ppmv extra CO2 in the atmosphere. To the contrary: such an extra CO2 pressure in the atmosphere pushes more CO2 in the oceans and in vegetation, which is measured in both…
Hi Ferdinand,
Again you try to bring in your Mass Balance Argument, which is irrelevant.
Please read what I write, and do not assume it is the same position as others – it is not.
For the sake of this hypothesis, just assume SOMETHING ELSE is causing the base increase in atmospheric CO2 – just ASSUME it is primarily caused, for example, by fossil fuel combustion.
On top of this base increase in CO2 there is the clear dCO2/dt vs T signal. Now please explain how this clear signal can possibly exist if CO2 is a major driver of temperature – the signal would not exist in this hypo because it would be drowned out by the impact of CO2 on temperature (if ECS were high) – it can only exist if ECS is quite low. That is the observation.
Regard, Allan
,.
Allan,
I didn’t re-introduce the mass balance argument at all. I only looked at the CO2 and T variability where you go wrong:
On top of this base increase in CO2 there is the clear dCO2/dt vs T signal.
That signal is clear for the variability of T and dCO2/dt, but if you look at the graphs in detail, there is zero lag between these two, so you can’t deduce anything about which leads the other.
The real lag in the variability is from dCO2/dt after dT/dt or – again only for the variability – between T and CO2. That is for a variability of +/- 1.5 ppmv around a trend of 90 ppmv.
The trend of 90 ppmv can’t be caused by temperature, as that violates Henry’s law for the solubility of CO2 in seawater (and at the current CO2 pressure, the oceans are a growing sink for CO2). Neither by vegetation, as that is a proven, growing sink for CO2 too.
Moreover, most year by year variability is caused by the influence of temperature on (tropical) vegetation by Pinatubo and El Niño episodes. Opposite to the longer term influence of temperature – and more CO2 – on the extra sink rate by vegetation:
http://www.ferdinand-engelbeen.be/klimaat/klim_img/temp_dco2_d13C_mlo.jpg
The opposite CO2 and δ13C moves show that vegetation is the main reactant to temperature. If the oceans were the main reactant, CO2 and δ13C would move in parallel.
dT/dt has zero trend, only a small offset from zero, which integrates to ~0.8 K over the full Mauna Loa period or maximum 13 ppmv CO2 if we may assume that Henry’s law still is valid…
All I can say to your last post is nonsense Ferdinand – it makes no sense.
Allan, Ferdinand’s post makes perfect sense. Is English your 2nd language?
Allan, co2 clearly, clearly, clearly, clearly,
clearly, clearly leads temperature when humans
dig up carbon and burn it.
how can this not be completely obvious
to you? ? ?
Allan,
Have a good look at the influence of the two temperature extremes at the end of the last century: the 1991 Pinatubo eruption and the 1998 super El Niño:
http://www.ferdinand-engelbeen.be/klimaat/klim_img/wft_trends_rss_1985-2000.jpg
With a factor of 4 ppmv/K, the variability of CO2 lagging the temperature influence of these two extreme temperature events is already overblown. A fast temperature change of +/- 0.4 K, about half the total increase in temperature 1960-current, is good for only +/- 1.5 ppmv around the trend, but the full change in temperature of 0.8 K would give 90 ppmv CO2 increase? Sorry, but that is physically impossible. The more that the very long term (glacial-interglacial) transitions only give ~16 ppmv/K, as what Henry’s law gives for the solubility of CO2 in seawater…
The previous graph shows that the dominant fast reactant to temperature variability is (tropical) vegetation, but vegetation is a proven sink for CO2 over periods longer than 1-3 years, it doesn’t cause the CO2 increase. Neither do the oceans, as the CO2 pressure in the atmosphere is higher than the measured average CO2 pressure in the ocean waters.
Thus while CO2 changes lag temperature changes over almost all time periods, it leads temperature since ~1850.
Sorry Ferdinand, but you apparently cannot move away from your argument (with others, not me) about the “base increase” in atmospheric CO2, which is irrelevant to this discussion.
There are two phenomenon occurring here:
1. The base increase in CO2 which you allege commenced circa 1850,
You attribute this increase in CO2 to fossil fuel combustion (your “Mass Balance Argument”) and others attribute it to other causes. (We only have detailed CO2 data since 1958, so your pre-1958 conclusion is speculative.)
There is NO lead or lag relationship of CO2 with temperature in this relationship, as evidenced by the global cooling period from ~1940-1975. CO2 is just increasing, with a few exceptions in the latter years of the 1940-1975 cooling period, while temperature has increased, decreased, increased, and remained flat for decades at a time, and thus CO2 has little or no significant impact on temperature.
Repeating, for this discussion this base increase in CO2 is irrelevant.
2. The incontrovertible signal in the detailed data since 1958 (and probably extending back millions of years) that dCO2/dt varies with global temperature T and therefore CO2 lags temperature by ~9 months.
http://www.woodfortrees.org/plot/esrl-co2/from:1979/mean:12/derivative/plot/uah5/from:1979/scale:0.22/offset:0.14
This clear relationship tells us what is happening in the climate system between temperature and CO2 – the net result (of ALL the natural phenomena, both biological and physical) is that temperature drives CO2 much more than CO2 drives temperature – otherwise this clear dCO2/dt vs. T relationship would not exist.
I suggest that we can also infer from this dCO2/dt vs. T relationship and other data that ECS is very small, too small to be significant, and thus there is no real global warming crisis.
We also know that CO2 lags temperature by ~~800 years in the ice core record. This observation on a longer time scale further supports my hypothesis.
Precedence studies are commonly used on other fields to establish cause and effect. The climate science community, with a few exceptions, has avoided this debate since my 2008 paper, due to the dysfunctional political and religious aspects of their cause. I therefore very much appreciate our discussion, even though I cannot agree with all your points.
Best personal regards, Allan
Allan:
1. There is NO lead or lag relationship of CO2 with temperature in this relationship
Sorry Allan, it is difficult to discuss things out of you don’t see the difference in scales and periods…
All natural temperature – CO2 relations are within minimum 4 ppmv/K (seasonal, year by year) and maximum 16 ppmv/K (glacial – interglacial). The current increase in CO2 is >120 ppmv/K over the Mauna Loa period. Whatever caused that increase, it is NOT caused by temperature. That is my point.
Thus you can’t say that CO2 lags temperature on all scales, as CO2 leads with at least 80 ppmv the effect of the temperature increase over the past 58 years, whatever the influence of CO2 on temperature.
2. dCO2/dt varies with global temperature T and therefore CO2 lags temperature by ~9 months.
Sorry again, the 90 ppmv CO2 increase does not lag T, only the 1.5 ppmv variability in CO2 lags the +/- 0.4 K variability in T. That is all what your graph says.
There is no connection between the variability and the slopes of T and dCO2/dt, as most variability is caused by vegetation, while any slope of dCO2/dt caused by vegetation is completely flat or even negative. Variability and slopes are caused by different processes, no matter if the slope of dCO2/dt also may be caused by temperature or not.
There is no physical process on earth which can give a 90 ppmv increase in less than 60 years from a temperature increase of 0.8 K…
The only reason that this is not discussed in the scientific community is that every single observation points to a human cause of the CO2 increase and that it is physically impossible to have a natural increase of that order in such a short time frame without a clear cause or even a clear source…
And again Ferdinand, you cannot understand that your fixation with cause of the base increase in CO2 is irrelevant to my premise. That is your argument with others, not with me, as I have explained to you too many times.
I am agnostic to the premise proposed by Salby and others, to which you take strong exception. Your difference with Salby et al is summarized as follows:
You say the increase in atmospheric CO2 (allegedly since ~!850, although we only have detailed CO2 data since 1958) MUST BE primarily caused by fossil fuel combustion – aka your “Mass Balance Argument”. Salby and others say the CO2 increase is primarily driven by natural causes.
I am agnostic because it is irrelevant to my point. Kindly stop trying to enlist me in you argument with others.
My point it is NOT the same as your argument with others and you cannot see that. Please do not repeat your irrelevant points yet again. We are talking past each other.
Allan,
Your point is:
dCO2/dt varies with global temperature T and therefore CO2 lags temperature by ~9 months.
My reaction was:
The 90 ppmv CO2 increase does not lag T, only the 1.5 ppmv variability in CO2 lags the +/- 0.4 K variability in T. That is all what your graph says.
Nothing to do with mass balances or the cause of the CO2 increase or any dispute with others: you do conclude that the trend in CO2 lags the trend in temperature from a graph that only shows the lag of the noise around the trend… Your conclusion can not be made from that graph…
OK Ferdinand, now please re-read this:
Allan M.R. MacRae June 10, 2017 at 6:10 am
https://wattsupwiththat.com/2017/06/06/solar-update-june-2017-the-sun-is-slumping-and-headed-even-lower/comment-page-1/#comment-2524005
Excerpts:
1. There is NO lead or lag relationship of CO2 with temperature in this relationship, as evidenced by the global cooling period from ~1940-1975. CO2 is just increasing, with a few exceptions in the latter years of the 1940-1975 cooling period, while temperature has increased, decreased, increased, and remained flat for decades at a time, and thus CO2 has little or no significant impact on temperature.
Repeating, for this discussion this base increase in CO2 is irrelevant.
2. This clear relationship tells us what is happening in the climate system between temperature and CO2 – the net result (of ALL the natural phenomena, both biological and physical) is that temperature drives CO2 much more than CO2 drives temperature – otherwise this clear dCO2/dt vs. T relationship would not exist.
I suggest that we can also infer from this dCO2/dt vs. T relationship and other data that ECS is very small, too small to be significant, and thus there is no real global warming crisis.
Please do NOT infer that I am saying anything else or enlist me in your arguments with others. If you want more clarity, re-read my other posts on this page.
Regards, Allan
Allan: co2 isn’t the *only* influence on climate. for
the few decades after ww2, sulfate aerosols (air
pollution) are thought to have played a crucial
role in the tiny cooling.
come on, you should know
this
Allan,
One last time…
You wrote:
BUT ON TOP OF THIS INCREASING CO2 THERE IS THE CLEAR SIGNAL THAT dCO2/dt VARIES WITH TEMPERATURE, AND ITS INTEGRAL CO2 LAGS TEMPERATURE BY ~9 MONTHS. THIS SIGNAL, WHICH SURVIVES THROUGH WARMING AND COOLING PERIODS, IS THE KEY TO THE MAGNITUDE OF ECS
No, it is not the key to ECS, as the 9 months lag is from a different process than the 3 months lag of CO2 over the seasons (in opposite direction for CO2: higher T, less CO2!) or the 800 years lag between CO2 and T over a glacial-interglacial transition or the influence of any extra CO2 on T…
The 9 months lag between the variability of CO2 (and reverse for δ13C) after the variability of T only explains the cause of the variability and says next to nothing about the influence of CO2 on T. That is my point.
As far as the data show, the full 110 ppmv extra CO2 (90 ppmv since Mauna Loa) can be responsible for zero to the full 0.8 K temperature increase in the same time span, regardless of the decadal cooler and faster warming periods as these are caused by natural variability (probably ocean currents) as good as the short term temperature variability. The 9 months lag of the short term variability is of zero help to determine the height of the ECS…
Crackers – You state false allegations and then attribute them to me. This is a dishonest and foolish tactic.
Ferdinand, I understand your point, and it is irrelevant to mine. You have spent far too many words on your favorite topic, about the primary cause of increasing atmospheric CO2. I do not have a strong opinion on your topic because it is irrelevant to my hypothesis, and I believe that new CO2 satellite evidence will lead to more credible conclusions in due time.
My hypo is “Temperature drives atmospheric CO2 much more than CO2 drives temperature”.
There are two prevalent opinions on my hypo:
1. “Of course it is true Allan, we’ve known this for over a hundred years! Why are you stating the obvious?” =TRUE
2. “This cannot be true Allan, because we KNOW that CO2 primarily drives temperature. So it MUST BE a feedback effect”. = FALSE
Ferdinand, kindly state your opinion, in ten words or less, on my above hypo. TRUE or FALSE, based on ALL the evidence, or “we just do not know”?
I will not respond to any more diversions into your Mass Balance Argument or its clones – it is just irrelevant.
Regards, Allan
During the day it would add a little based on it’s radiative forcing, but at night water vapor self regulates to dew point, and co2 does not affect dew points.
Javier you wrote:
“There is a huge difference between saying that the evidence is consistent with a low equilibrium climate sensitivity, and saying that “Earth’s climate is insensitive to increased atmospheric CO2.·” While my position can be supported on published peer-reviewed scientific literature, yours can not.”
Really? A huge difference? I don’t see the huge difference you allege between “a low equilibrium sensitivity” vs. “insensitive”. I suggest you are being pedantic.
Regards, Allan
(six of one, half a dozen of the other)…
I’ll give you an example of the difference:
You say “Earth’s climate is insensitive to increased atmospheric CO2” and “Recent global warming was natural.” That means 0% anthropogenic 100% natural warming. With a low ECS we could very well have 40% anthropogenic and 60% natural warming. The difference between 0% and 40% is huge. Of course we don’t know what % each are responsible for, so your claim that for CO2 it is 0% is baseless and unsupported.
No Javier,
insensitive” does not mean zero, as I have clearly written elsewhere.
I do believe that ECS is within +/-1C, probably +/-0.5C and possibly +/- 0.3C – and so there is no real global warming crisis.
To allege that ECS is a precise value like zero excessively precise and would be would be pedantic.
Regards, Allan
SORCE Tim Total Solar Irradiance is still slightly above the low point of the last solar cycle.
The bottom on the last cycle was about 1360.7 W/m2 and the most recent 3 month plot is still at 1360.8 W/m2, We’re still not at the bottom part of the cycle which will then last another 2 to 3 years after it gets there.
http://lasp.colorado.edu/data/sorce/total_solar_irradiance_plots/images/tim_level3_tsi_24hour_3month_640x480.png
A nice graph, Bill. The difference between the top (1361) and the bottom (1360) is 0.074%. I applaud the accuracy of this measurement.
It is actually a hundred times better than that, so you can applaud much louder.
These graphics are only half the truth. In reality, the TSI is measured on top of the atmosphere. The overall TSI does not come in the composition of the bandwidth, mainly in the ultraviolet and infrared range. These bandwidths affect the processes in the stratosphere and also the warming of the oceans. Therefore, such mini-percentage games are pointless.
http://www.atmos-chem-phys.net/13/3945/2013/acp-13-3945-2013.pdf
lsvalgaard June 7, 2017 at 9:47 am
It is actually a hundred times better than that…..
Can you please provide a brief description of how the accuracy (not precision) of this instrumentation is measured? Do we, for example, have several independent devices of different construction working in parallel to show that the difference between them is less that (of the order of) 1 W/m2 ? In the operating environment, not in a lab?
I simply do not know.
Geoff.
You are confusing accuracy and precision. When you compute the difference between 1360 and 1361 and call it ‘accuracy’ you show the confusion. What matters as far as variation of TSI is concerned is the relative repeatability.The experimenters call that the precision. The accuracy is how well the absolute value is known: is it 1360-1361 or is it 1350-1351? The accuracy of the SORCE TSI is 0.5 W/m2, the precision is 0.007 W/m2. A starting point for understanding this may be: http://lasp.colorado.edu/data/sorce/tsi_data/daily/sorce_tsi_L3_c24h_latest.txt
lsvalgaard,
Thank you for the reference to SORCE TSI work & data on accuracy & precision
Definitional searches most often produce results like this:
“In the fields of science, engineering and statistics, the accuracy of a measurement system is the degree of closeness of measurements of a quantity to that quantity’s true value. The precision of a measurement system, related to reproducibility and repeatability, is the degree to which repeated measurements under unchanged conditions show the same results.”
https://en.wikipedia.org/wiki/Accuracy_and_precision
In the context of measurement of TSI, here is a figure from Butler et al (2008), “Sources of differences in on‐orbital total solar irradiance measurements and description of a proposed laboratory intercomparison, J. Res. Natl. Inst. Stand. Technol., 113, 187–203”, a figure that years ago I labelled as “The Problem”.
http://www.geoffstuff.com/toa_problem.jpg
Accuracy: Because a best value is not known, one can plausibly select any value between the highest and lowest TSI in this figure, state that accuracy is between (say) 1360 and 1374 Wm-2 or 1367 +/- 7 Wm-2 which equates to +/- 0.5%.
Precision: From the vertical spread of results from single sensors, the precision is about +/- 0.5 Wm-2 being the spread enclosing most (90%+) of the values over a short time in a 2-sigma analogy. Corresponds to +/- 0.04%.
You claim that “The accuracy of the SORCE TSI is 0.5 W/m2, the precision is 0.007 W/m2”. This might be so, but it is applicable only to the time period of its observations, 2003-17. My estimates are for data from the start of this satellite work.
My values are arrived at by a crude initial analysis that aims to set the gross parameters. They can be refined by adjusting for known, unequivocal errors, then by more adjustments that become more and more precarious. Climate research is often hindered by such encroachment of subjectivity onto objectivity.
Can we really determine whether TSI is positive, negative or zero from 1980 to now?
Geoff
.
Precision: From the vertical spread of results from single sensors, the precision is about +/- 0.5 Wm-2 being the spread enclosing most (90%+) of the values over a short time in a 2-sigma analogy. Corresponds to +/- 0.04%.
No, completely wrong. That spread is due to variation of the signal [the sun is rotating], not of the error or a measure of the precision. You can with confidence accept what I tell you. The offsets between instruments are due to influence of extra light scattered into the the sensors due to construction flaws of the ones before SORCE-TIM. Here is some info on that http://www.leif.org/EOS/2010GL045777.pdf
My values are arrived at by a crude initial analysis that aims to set the gross parameters.
The values quoted by the experimenters are arrived at by extensive, careful analysis. Beats ‘crude’ every time.
Although TSI after 1978 is well in hand, the value before is marred by political bias, see e.g.
http://www.leif.org/research/EUV-Magnetic-Field.pdf
Sometimes it can be good to go back, and remember folks like Jack Eddy, who originally set out to disprove the claims of Sporer and Maunder.
And Jack Eddy’s quote which, when paraphrased, said that basically the more we claim to know about the sun the less we actually know. Those in glass houses, who would throw stones, should know better…
Story @ur momisugly Briebart Trump wants to put solar panels on the Mexico Border Wall.
Trump buildt and ran Hotels and resorts, The Border Wall will pass through many of miles remote unpopulated desert area . So where they going to get the thousands of gallons of Fresh Water to keep the panels clean and be economic and maintain a low environmental impact.
This is why they don’t have Solar Panels in Africa,The Middle East or Las Vegas.
Rio Grande? For the first 1000 miles should do.
The solar panel comment is a joke. Seriously.
We need to plant the deserts with green growing things that can grow with little moisture. Then they will consume CO2 and give us oxygen. We get all the fresh water we need if we just capture all the ice bergs that are wasted and we would have all the water we need. Navy collect and deliver them. Something they could do while they were waiting for something else to do. Billions of new jobs would be created increasing our National Wealth by Trillions. Why have I not been called to come to Washington, D.C.?
William Sturm
In 2009 the NH experienced an unusually cool summer. Three or four years of that in succession will have global impact in combination with perhaps one more year of overlap cooling in the downturn from the last super El Nino. And over the three years we will have more time to watch the turn down of the AMO in the Atlantic. Now if we could just shake loose some more billions from Bloomberg, Soros, Ted Turner and others for wrong way bets on climate change it will make my day.
Global Warming’ Is a Myth, Say 58 Scientific Papers in 2017.
http://www.breitbart.com/big-government/2017/06/06/delingpole-global-warming-is-myth-58-scientific-papers-2017/
Our Climate is not quite so simple to understand. If all what we had to to was track the solar cycles and mix in a few Pacific and Atlantic teleconnection analogs, we wouldn’t need meteorologists. For instance, during the LIA (1315-1880), what happened to ENSO? The same could be said about the MWP. And the start of the LIA proceeded the Maunder Minimum by 300 years. What brought on the devastating storms of 1315-1317 (some farms in France recorded 40 day periods where it rained 30-40 days straight)? What brought on the catastrophic droughts in Chile and Central America during the mid-part of the MWP? To this day, thankfully, those droughts haven’t been replicated. What would cause such a radical and prolonged shift in the Southern Oscillation?
David’s solar data post fits very well with my recent paper which shows that the solar activity peak at 1991 +/-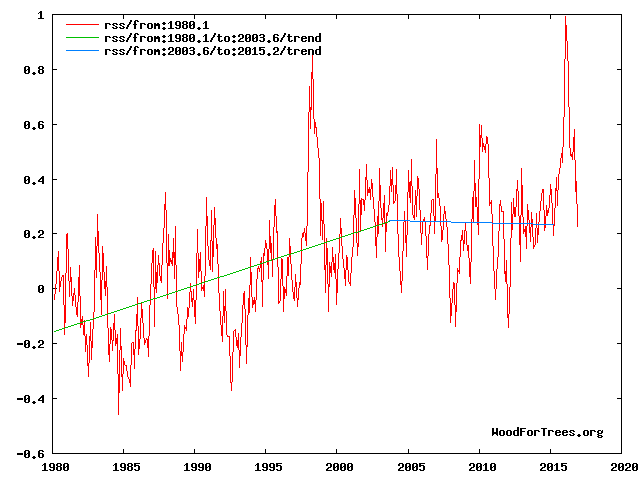

in the Oulu data is a peak in the millennial solar activity cycle which correlates ,with a delay of 12 years +/- ,with the RSS temperature trend peak at 2003/4.
Climate is controlled by natural cycles. Earth is just past the 2004+/- peak of a millennial cycle and the current cooling trend will likely continue until the next Little Ice Age minimum at about 2650.See the Energy and Environment paper at http://journals.sagepub.com/doi/full/10.1177/0958305X16686488
and an earlier accessible blog version at http://climatesense-norpag.blogspot.com/2017/02/the-coming-cooling-usefully-accurate_17.html
Here is the abstract for convenience :
“ABSTRACT
This paper argues that the methods used by the establishment climate science community are not fit for purpose and that a new forecasting paradigm should be adopted. Earth’s climate is the result of resonances and beats between various quasi-cyclic processes of varying wavelengths. It is not possible to forecast the future unless we have a good understanding of where the earth is in time in relation to the current phases of those different interacting natural quasi periodicities. Evidence is presented specifying the timing and amplitude of the natural 60+/- year and, more importantly, 1,000 year periodicities (observed emergent behaviors) that are so obvious in the temperature record. Data related to the solar climate driver is discussed and the solar cycle 22 low in the neutron count (high solar activity) in 1991 is identified as a solar activity millennial peak and correlated with the millennial peak -inversion point – in the RSS temperature trend in about 2004. The cyclic trends are projected forward and predict a probable general temperature decline in the coming decades and centuries. Estimates of the timing and amplitude of the coming cooling are made. If the real climate outcomes follow a trend which approaches the near term forecasts of this working hypothesis, the divergence between the IPCC forecasts and those projected by this paper will be so large by 2021 as to make the current, supposedly actionable, level of confidence in the IPCC forecasts untenable