On June 23 1988, NASA’s James Hansen testified before Congress and made very specific predictions about global warming. In this video I show how he got them exactly backwards, and how scientists and journalists continue to spread baseless misinformation.
This video could be better.
It comprises a litany of instances where the Warmists made predictions, followed by evidence that they got it wrong. Great watching for someone who doesn’t believe in the theory.
But we should be looking to take the message out to people who DO believe. And they won’t find this compelling viewing. Listening to a long list is boring if you don’t want to believe the argument, and provides a good reason to turn it off.
I would have started, for example, with a comment that we are told that there is extensive evidence for Global warming, and put up a graphic with 30 bottles on a wall. Then at every rebuttal I would have dropped a bottle. The video needs some simple visual like that, drumming home the fact that EVERYTHING is wrong with this theory, not just a few things…
Nice to see quite a few followers of Jordan Petersen’s thinking:
If you want to get anywhere, you must be ‘dis-agreeable’
IOW, appeasement as practised by skeptix around here: As in “Oh yes I understand the GHGE and Heat Trapping”
[digression] Frankly, I’ve you’ve spent your life eating sugar and drinking alcohol, optionally doing Dope, you are capable of ‘understanding’ anything. and nothing. simultaneously. Call in Type 3 diabetes.
[/digression]
Why don’t a lot of folks like Mr Trump? Exactly because he is dis-agreeable to them. They don’t like having to keep explaining their thinking and justifying their actions – being dis-agreeable gets appeasers & weak-thinkers sacked and gets things done.
So it is with ‘Heat Trapping’
Heat, of a gas, is the actual mechanical motion of the molecules. It means they are move more and faster with higher temperature. They stop at zero Kelvin.
But ‘movement’ is a time derivative. Movement is measured in (Metric System) metres per second. Distance is changing per unit time.
Optionally measured in root 3 bushels per anthrocene.
I’ll stay metric if that’s OK
By saying you have ‘trapped heat’ it means you have trapped a changing thing. Change, in olden terminology is ‘Flux’
IOW, GHGE theory calls into play something that traps (stores) change (flux)
Enter the Flux Capacitor – something thats stores ‘change’ = the thing of dreams.
Hello NASA. You do realise Flux Capacitors are the ‘working element’ of A (any/all) Time Machines?
So when you use the words ‘trapped heat’ to explain the GHGE, why (the expletive) are you still launching (and cinderising) conventional rockets?
I believe Hansen’s (and his ilk) greatest achievement was establishing CO2 as the principal meme for any discussion or explanation of how the Earth’s climate works. And getting us to ignore that elephant in the room — the oceans.
The mass of the atmosphere (5×10¹⁸ kg) is only 0.004% the mass of the oceans (1.35×10²¹ kg). And the specific heat of water (4.1 joule/kg) is over 4 times that of air (1 joule/kg). So, no one should be surprised that water (in all of its forms), not CO2, regulates and controls the global temperatures.
The specific heat capacity of seawater is 4000 joules per kilogram
The specific heat capacity of air is about 1000 joules per kilogram
Correct I meant joules per gram . But my point (that water has 4 times the heat of capacity of air) still stands.
And there is so much more of it. Het capacity of total earth ocean is 5.6 x10^24 joules /K
Heat capacity of total earth atmosphere is 5×10^21 Joules/K
a 1000 times less
“is only 0.004% the mass of the oceans”
Your clothes are only a small fraction of your weight, but they keep you warm. Mass and specific heat determine the time it takes to heat up, but not the fluxes.
The ocean temperature is determined by the exchange of heat with space, mostly by IR (at TOA, all). Between the oceans and space lie GHGs. They determine the resistance of the radiative pathway.
Your “clothing” is a SOLID, covering 80% of your body, not a GAS, covering 0.04% of your body !! Apples to Cherry pits !
In fact, warm clothing is mostly a gas. The insulation comes from confining pockets of air.
But the main thing is, its heat capacity, relative to you, is irrelevant to its function. A wet blanket has more heat capacity than a dry one, but does not work better. What counts is thermal resistance. And that is what GHGs in the atmosphere provide. And they don’t cover 0.04%. They cover 100%.
CO2 is 0.04% of the atmosphere !
And clouds are less than 1%. But if it is a cloudy day, you don’t see the sun. The sky isn’t 99% blue.
“In this video I show how he got them exactly backwards”
If this really was the case, wouldn’t it show how truly inept the skeptical science community are, in that they can’t make a dent in the science? Not even a little one.
Keep gnawing your phantom bone.
There’s no science to dent. There’s nothing more than an investment fund manager’s guess right now.
When religious dogma is involved, facts are impotent. Besides, the MSM denigrates the skeptics with terms like ‘de-Nyer’ and fawns over the likes of Hansen with flattering opinion pieces. It is surprising that we have done so much with so little. I would disagree that we haven’t even mad a little dent. You just can’t see it with your blinders.
Didn’t watch the video, did you.
From what I understand Jim Hansen and his granddaughter along with 21 children are suing the U.S. government for not doing more to curb Co2. His track recorded may come back to hunt him.
The mistake Hansen made was to assume that CO2 and GHG was the cause of the lapse rate. It is this lapse rate that provides the 33C surface warming using energy taken from the upper troposphere.
However, nowhere does CO2 appear in the equation for the lapse rate.
You cannot change the surface temperature without somehow changing the lapse rate. Otherwise, if you for example raise the surface temperature via back radiation this will increase the vertical circulation which will cool the surface.
The problem is “all things remaining equal” only works in theory. And computer models implement theory
In practice nothing remains equal which computer models are very poor at predicting. Mother Nature is much more inventive than the human mind because nature is infinite. Nature can always pull a rabbit out of a hat we didn’t expect or imagine.
Interesting looking back through Tony’s site for the gems-
“NOAA also said in 1989 that there had been no warming in the US from 1895 to 1989”
https://www.nytimes.com/1989/01/26/us/us-data-since-1895-fail-to-show-warming-trend.html?src=pm
“NASA responded to this challenge by corrupting the US temperature record and creating 0.5C US warming from 1895 to to 1989 – where previously there had been none”
“NOAA said in 1989 that there is “considerable uncertainty among scientific experts.” #ExxonKnew people focus on the testimony of crackpots like NASA’s James Hansen, who predicted nine degrees warming by 2050 – while ignoring the fact that actual scientists didn’t believe anything Hansen was saying”
https://realclimatescience.com/2016/06/noaa-didnt-know-and-james-hansen-is-a-fraud/
“NASA responded to this challenge by corrupting the US temperature record and creating 0.5C “
As so often there, just untrue. The trend of current NASA CONUS from 1895 to 1989 is 0.23°C/Century, and the change from 1895 to 1989 is 0.216 °C, not 0.5. And the t-value of that slope is 1.515; it is not even significant at the 90% level. Just as the three NOAA scientists reported in 1989. True then, true now.
“Corrupted” the data. I always laugh at the junior scientists when I read that.
Corrupted! Hoax!
Somehow I don’t think that the juniors want to use raw data. They clearly don’t understand adjustments.
30 years later. What was being said 30 years ago? Interesting.
In 1982, Arctic sea ice was in a natural retreat cycle, which swung to advance in 2012.
If CO2, supposedly well-mixed, were the cause of Arctic sea ice loss, then why did Antarctic sea ice grow from 1979 (when dedicated satellite observations began) until 2014?
Any time you see a graph of “percent of stations above 90°F” you know you’re being duped. There are several reasons that is a bad idea, and one is that most of the warming we are experiencing is at night. But more to the point:
Most stations have been moved at least once over the last century. And most have changed from using LiG MMTS or ASOS.
Observation times have shifted from afternoon to morning at most stations since 1960. If you don’t adjust for that simple fact, then the number of temps above a threshold becomes meaningless.
MMTS sensors tend to read maximum daily temperatures about 0.5 C colder than LiG thermometers at the same location. There is a cooling bias in the record associated with the conversion of most co-op stations from LiG to MMTS in the 1980s.
Any “cooling bias”, if it exists, would pale in comparison to the warm bias, due to UHI and station drop-out of the cooler, rural stations. But keeping on grinding those warming gears. If you want to know who is duped, look in the mirror.
Much of the “warming” is simply made up, both on land and sea. GISS is OK with a station representing a region 1200 km distant. And with “infilling” missing “data”.
It’s a kludge of giant cluster fudge.
Curry laughs at you.
Sorry that you dropped Curry from your list of approved scientists. She does one thing well: explain adjustments. You just don’t want to read what she has to say.
Sad.
Curry believes Mann , Schmidt and Hansen are frauds
And BEST, in which corrupt enterprise she herself participated in good faith, until horrified and disgusted by its crooked “results”.
Unlike Mosh, she actually is a scientist.
I love how “results” is a bad thing. Maybe if Watts had said he would believe the results of BEST no matter what…
Oh my.
Anyone can get results. Getting good results are harder.
And no, good results are not defined as anything you agree with.
I quoted Curry, and it was an easy guess that a bunch of Watts readers would not recognize real science when it hits them.
Very predictable.
And real climate scientists know that Curry is correct about a few things, one being adjustments. She won’t stoop THAT low.
The predictions (by Hansen and others) of global surface temperature warming under various emission scenarios was indeed specific, but it is not a unique prediction to CO2 GHG theory. One can argue about the magnitude of the surface warming, and all of the adjustments made to the raw station data over the decades, but there has been surface warming. The problem for Hansen is that there are other non-GHE explanations that cannot be ruled out for those observations.
CO2 GHG theory does make one very unique and specific prediction that is an emergent property from all the major climate models:
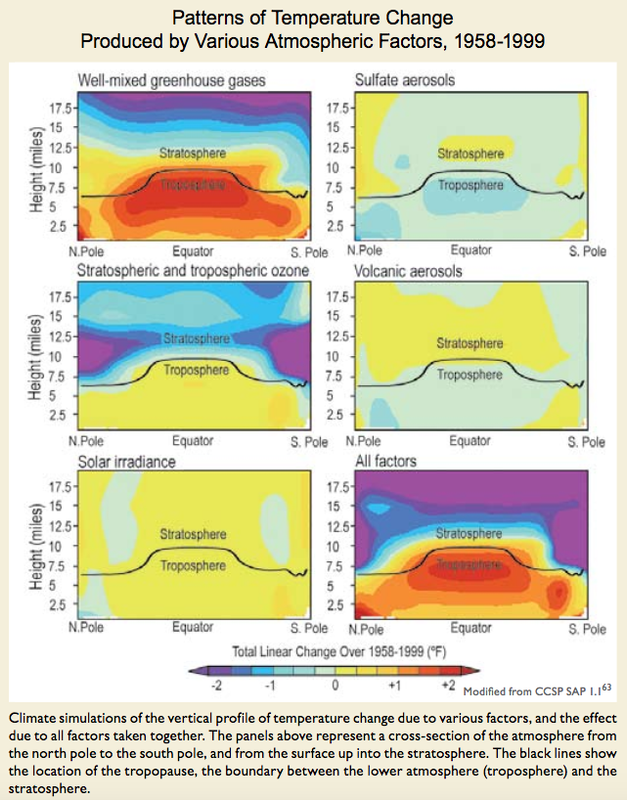
The tropical mid-tropospheric hot spot. (see upper left panel of this image)
Source: Global Climate Change Impacts in the U.S., 2009. Cambridge University Press, page 21.
The CMIP3 model ensemble predicted about a 1.3 ratio of mid-tropospheric warming to surface warming in the tropics. The observational records (balloons and satellites) puts it at 0.8. The near inverse.
It has not been observed despite much hand waving and attempts by Alarmists to re-analyze the balloon and satellite observational records to bring it into existence.
CO2 likely has warming effects but +-tive feedbacks and thus total climate CO2 sensitivity cannot be anywhere near as high as both the CMIP3 and CMIP5 ensembles suggest. They are wrong.
Application of the rationale scientific method demands rejection of the strong CO2 GHGE theory.
Not only have their climate predictions failed, they fail to acknowledge that their predictions have failed.
Even worse, they continue to claim that their failed projections were actually accurate. It’s just that we aren’t squinting properly.
Well, I finally watched the video. It’s about what I expected from Tony Heller, mostly good, many points worth sharing, but also several things that make me cringe.
Hansen got everything backward? Well, I won’t go through all the points and score them (that would require a lot more time than I care to spend on it), but here are a couple.
Hansen said the Arctic would lose ice or become ice free by now or something like that. Heller displays a graph of ice mass from 2012 to now. He doesn’t mention that 2012 was the record low year for arctic ice. Here are graphs of sea ice extent (not mass) from 1978 (the satellite period of record):
The 2012 minimum sticks out well. Note that the Y-axis doesn’t start at 0. Don’t bet that the longer term decline will continue – things may get interesting when the AMO flips to its positive mode.
Heller mentions Hansen’s off-the-cuff forecast that Manhattan’s West Side Drive would be underwater in 20 years. That 20 turns out to be bad recall on an article author’s part, we may have to wait 40 years post-prediction. I don’t know how Heller missed that, see https://wattsupwiththat.com/2009/10/22/a-little-known-but-failed-20-year-old-climate-change-prediction-by-dr-james-hansen/
Either way, for Hansen to have gotten things backward, sea levels would have to have dropped as much as Hansen said they’d have to rise. No one I know of has claimed that has happened or has any chance of happening in +/- 10 years.
All in all, typically one-sided, holier-than-thou, and with errors that will never be admitted to. A bit of a pity, as a lot of it is quite good.
IMO it’s improbable that the 2012 low will be taken out any time soon. Last year was the first time since 1979, when the dedicated satellite record began, in which a new, lower low was not registered within five years.
It appears that Arctic sea ice is indeed in a growth cycle, as would be expected from the historical record. It’s possible, if not probable, that the cyclical decline from a near record high in 1979 to the 2012 low has been reversed. The longer trend since 2007 is roughly flat, but still slightly positive as well.
As you say, the AMO flip could reinforce this apparent trend.
At present rate of MSL rise, the now non-existent West Side Drive level will be nowhere near flooded in 22 years. So Hansen’s prediction might not technically be “backwards”, but is almost sure to be badly wrong.
Sounds like a personal problem to me.
I love Tony’s work. He is fully ingrained in the craw of the CAGW crowd.
He gets a lot of stuff wrong. That allows the Alarmists to dismiss him on everything, including on the stuff he gets right like exposing many of their failed predictions.
Yeah, Tony lives rent-free in a lot of Alarmist’s heads.
I notice not many of Tony’s critics take the time to go over to Tony’s website to voice their disagreements. They just like to take pot-shots at him from other websites. Strikes me as a little cowardly.
If you cross Tony, things can get ugly pretty quickly. He made a new post, just for me, one day.
https://stevengoddard.wordpress.com/2014/06/30/reading-comprehension/
Yes, that is a typical case of trying to get to the truth with Heller/Goddard. His headline said:
“One Fourth Of The North Pole Season Gone – With Almost No Melting So Far”
So Ric very reasonably said that it was a pretty normal Arctic melting season. So the reply:
“Are you familiar with where the North Pole is located?”
Switches to a claim that the actual NP has not melted. But, of course, at June 30 it was not 1/4 way through the season for melting the actual North Pole. The original post was accompanied by a graph of temerature N of 80° lat.
And then he made a special post to boast of this put-down. Who needs this stuff?
Apparently Hansen is unaware of much of the stuff discovered about CO2: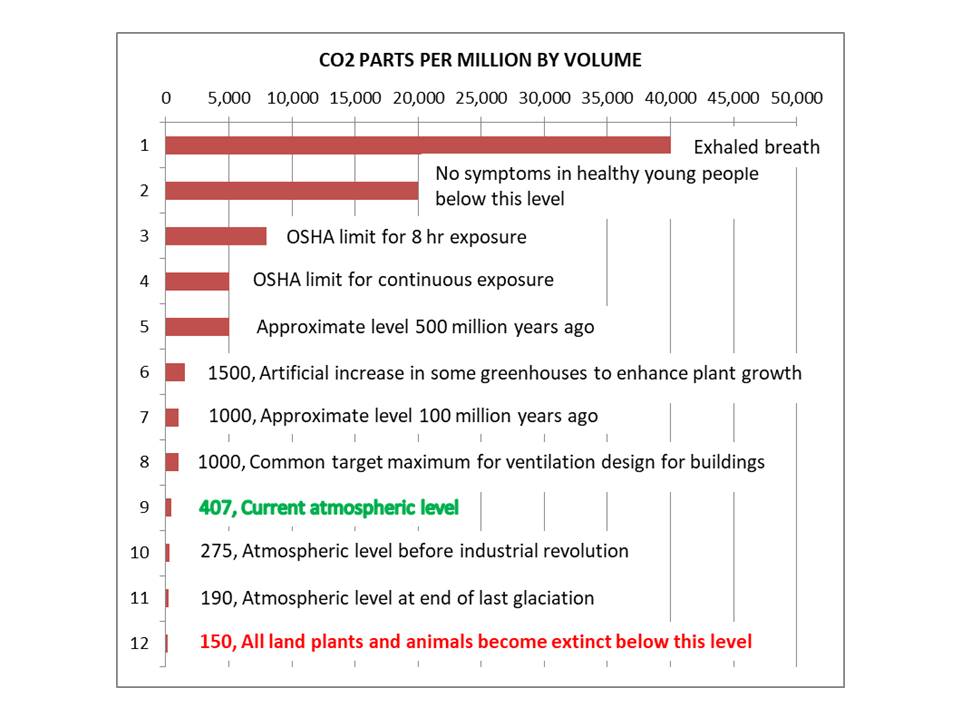
Not all land plants. C4 and CAM can get by on much lower levels, but don’t flourish as under CO2 enrichment.
But they are unable to reproduce.
Dan,
C4 and CAM plants can conduct photosynthesis at remarkably low CO2 levels, ie 10-50 ppm. I’ve not read a study on their ability to reproduce at 50-150 ppm, but think that they can.
I’d be obliged for a recent study showing my supposition false.
Maybe too much research at elevated levels and not enough at under 150 ppm.
Thanks!
For C3 plants, CO2 compensation point is 25-100 ppm. For C4, it’s 0-10 ppm.
True, there is very little interest re very low CO2.
It has been at least two years since my research for this chart and original sources are lost. I found this on a Google search using key words ‘plant reproduction vs CO2 level’. There are references to other papers there.
“…modern C3 plant genotypes grown at low [CO2] (180–
200 ppm) exhibit severe reductions in photosynthesis,
survival, growth, and reproduction, … “
shttps://nph.onlinelibrary.wiley.com/doi/pdf/10.1111/j.1469-8137.2010.03441.x
The C3 and C4 plants don’t necessarily die but they are unable to produce viable seed. Without land plants, land animals starve.
C4 plants make viable seed at very low levels of CO2, well under 150 ppm.
Reference to a credible demonstration?
For the Radiative GreenHouse Effect theory to function as advertised the surface of the earth must radiate as a black body.
Because of the thermal transfer properties of the contiguous participating media, i.e. atmospheric molecules, the surface cannot and does not do that.
No RGHE means no GHGs means no man-caused climate change.
How’s that for outside the scientific consensus cell block?
Nick Schroeder, BSME, PE
Over 14,300 views of my six WriterBeat papers and zero rebuttals. There was one lecture on water vapor, but that kind of misses the CO2 point.
Step right up, bring science, I did.
http://www.writerbeat.com/articles/21036-S-B-amp-GHG-amp-LWIR-amp-RGHE-amp-CAGW
(The modest experiment that demonstrates the effect of a contiguous participating media.)
http://writerbeat.com/articles/14306-Greenhouse—We-don-t-need-no-stinkin-greenhouse-Warning-science-ahead-
http://writerbeat.com/articles/15582-To-be-33C-or-not-to-be-33C
http://writerbeat.com/articles/19972-Space-Hot-or-Cold-and-RGHE
http://writerbeat.com/articles/16255-Atmospheric-Layers-and-Thermodynamic-Ping-Pong
http://writerbeat.com/articles/15855-Venus-amp-RGHE-amp-UA-Delta-T
This is regarding my post of June 24 at 2;57 pm.
In it I show that all climate change since the Roman Warm Period can be explained simply by the varying amounts of SO2 aerosols in the atmosphere, which regulates the intensity of the sun’s rays striking the Earth’s surface. There is no need for, or evidence of, any additional warming due to greenhouse gasses.
This fact seems not to have been understood by 100% of those reading the post–NO votes, or any understanding comments.
What am I missing?
I want to see how many people will be left in believing in AGW theory by 2020, as the climate is now transitioning to a cooling trend.
Can you imagine a cooling climate trend with not only these so called high CO2 levels but maybe CO2 still increasing as the climate cools.
AGW theory has hi jacked naturally occurring climate changes. It is unfortunate that naturally occurring climatic changes were in a warming mode from 1850-2005 but that has ended in full force in year 2018 and I feel the lag times are now sufficient. A period of 10+ years 2005-2017.
If one looks at the historical climatic records what stands out is this period of time in the climate is in no way unique in regards to the rate of warming or the magnitude of warming ,and that the climate has done this many times before.
Not to mention the lack of correlation of the global climate versus CO2 concentrations and worse yet CO2 following the temperature not leading it.
My theory suggest this year is the transitional year because the two solar requirements necessary for cooling are now in which are 10+ years of sub solar activity in general (2005) and following that , a period of time of very low average value solar parameters(2018) which are equal to or exceed typical minimum solar values between sunspot cycles both in degree of magnitude change and duration of time.
My theory is simple which states very low minimal solar conditions will achieve cooling by causing the overall oceanic surface temperatures to cool, while at the same time causing the albedo of the earth to increase slightly.
Less UV/NEAR UV LIGHT translating to lower overall sea surface temperatures which by the way have been in a down trend for many months now.
An increase in explosive major volcanic activity ,global snow/cloud coverage translating into a slightly higher albedo.
The case for an increase in major explosive volcanic activity tied to an increase in galactic cosmic rays, while global cloud cover ,snow cover increases tied to atmospheric circulation changes which are tied to changes in EUV light and an increase in galactic cosmic rays, due to low average value solar parameters such as the low solar wind, AP index, solar flux etc.
All given solar activity moderated by the geo magnetic field which can act in concert or opposition to solar activity . What makes this period of time so much more potent is the fact that the geo magnetic field (weakening) and solar activity are in concert with one another.
Salvatore,
You might enjoy my observations on emissivity in this WB paper. It includes a couple of Excel plots that illustrate why SURFRAD and USCRN IR data are junk.
http://www.writerbeat.com/articles/21036-S-B-amp-GHG-amp-LWIR-amp-RGHE-amp-CAGW
This LinkedIn link is my Modest Experiment report (in the style of R.W. Wood et. al.) demonstrating why a surface with contiguous participating media, i.e. the earth and atmosphere, cannot radiate as a black body.
https://www.linkedin.com/feed/update/urn:li:activity:6394226874976919552
Several other papers posted at both sites.
Regards,
Nick S.
What is most telling about the 1983 Hansen paper on his model is that there is no mention of back radiation. To this day NASA are still not measuring back radiation properly, so how can we be confident of the exact amount of greenhouse effect? NASA seems to measure back radiation with pyrgeometers set to emissivity =1 that of a blackbody. CO2 and H2O are not blackbodies. If this isnt true then what is the emissivity that NASA uses for these devices?
The facts in this video need to be edited into a punchy shorter video, max about 5 minutes. If I try to share this with some of my skeptical friends, they won’t watch past 45 seconds.
This video is horrible. It ignores all the things Hanson got right, and cherry picks things he didn’t (30 years ago it was very hard to see exactly how things would shake out.) In fact, the video seems fixated on June 22nd, and makes all the charts based on that date. Hanson never made a prediction about June 22nd.