Guest Post by Willis Eschenbach
There’s been some discussion of the rate of sea level rise lately, so I thought I’d take a look at some underlying data.
I started with a 2016 paper by the modern master of failed serial doomcasting, James Hansen. It has the frightening title of “Ice melt, sea level rise and superstorms: evidence from paleoclimate data, climate modeling, and modern observations that 2°C global warming could be dangerous” … yikes! Be very afraid!
In Figure 29 of that paper, Hansen claims to show that sea level rise has been accelerating, from 0.6 mm/year from 1900 to 1930, to 1.4 mm/year from 1930 to 1992, and 2.6 mm/year from 1993 to 2015.

Now, as is far too common with this charming fellow, James Hansen is playing fast and loose with the facts. First, he’s taken the data of Church and White from 1900 to 1992 and multiplied it by 0.78. This has the effect of flattening the record and thus reducing the prior sea level trends … which of course makes it seem like there is more acceleration than might actually exist.
Next, he has cherry-picked the Church and White (C&W) data shown in blue. The C&W data actually goes from 1860 to 2009, and Hansen and his merry band have chopped off both the early and the late part of the data.
Finally, post-1992 he has spliced the satellite data (with a trend which differs from Hansen’s specially flattened tide gauge data) on to the end of the tide gauge data. They are measuring different things, and thus cannot be directly compared. This is the reason for the “knuckle” in Hansen’s Figure 29 at the year 1993.
In any case, as those who know me are aware, I prefer to go to the original data. I don’t believe anyone until I’ve run the numbers myself … and this is another example of why I do that. As my beloved grandmother used to say, “You can believe half of what you read, a quarter of what you hear … and an eighth of what you say” … and Hansen’s claims seemed unbelievable.
In this instance I went to the Church & White (2011) paper cited by Hansen above, entitled Sea-Level Rise from the Late 19th to the Early 21st Century. (I guess C&W didn’t get the memo about how scientific papers now require terrifying titles.) I digitized the C&W Figure 5 and analyzed it. This is their Figure 5:

(Notice that because this data has not been subjected to the special Hansen flattening, the trends of the tide gauge and the satellite altimeter data are similar … but I digress.)
In particular, I wanted to look at the trends. Since Hansen had used a 31-year trend from 1900-1930, I looked at the same length trends. Here are all of the trailing 31-year trends, indexed by the final year of each trend, including of course the 1900-1930 trend referenced by Hansen et al.

I’m sure you can see the problem with making any general statements about whether or not there is any acceleration in the rate of sea level rise during the last hundred years or so …
You can also see why Hansen cherry-picked the 1900-1930 trend as his data to try to show acceleration … because if he’d used 1930-1960 instead, there wouldn’t be any acceleration to show.
Here’s my conclusion in all of this. Until we can say why the rate of sea level rise:
• decelerated from the start of the C&W record until 1930
• accelerated rapidly until 1960
• decelerated for the next ten years
• stayed about the same from 1970 to 2000
• and then started accelerating again,
… until that time, I say that making just about any statement about sea level acceleration is premature. However, one thing is clear:
There is no simple relationship between CO2 levels and the rate of sea level rise …
My best to all on a lovely spring day. Fog in the morning, sun in the afternoon, and now a foggy night. When the fog rolls in like this in the evening, on nights like tonight it sometimes traps the sound of the foghorn on the Bodega Bay breakwater six miles (ten km.) away, and carries that mournful wail up the hill to draw my mind away, away to the eternal sea …
w.
As Always: When you comment, please quote the exact words you are discussing so that we can all understand your exact subject. Misunderstandings are the bane of the intarwebs—please avoid them by being crystal clear about the topic of your comment.
Data: The digitized C&W data is below:
Year Sea Level (mm)
1860 -189.26
1861 -188
1862 -181.91
1863 -190.25
1864 -183.17
1865 -195.65
1866 -173.16
1867 -165.84
1868 -165.97
1869 -178.11
1870 -185.01
1871 -188.48
1872 -176.14
1873 -183.09
1874 -186.54
1875 -194.25
1876 -173.47
1877 -157.7
1878 -142.53
1879 -160.14
1880 -156.5
1881 -151.98
1882 -167.18
1883 -163.06
1884 -142.54
1885 -143.86
1886 -145.98
1887 -150.93
1888 -149.59
1889 -148.08
1890 -146.2
1891 -147.32
1892 -144.44
1893 -140.21
1894 -148.15
1895 -138.29
1896 -144.3
1897 -140.22
1898 -130.42
1899 -123.61
1900 -128.64
1901 -128.78
1902 -124.68
1903 -117.49
1904 -125.51
1905 -131.25
1906 -124.66
1907 -126.68
1908 -128.87
1909 -125.03
1910 -125.02
1911 -116.97
1912 -119.44
1913 -118
1914 -111.49
1915 -103.77
1916 -105.22
1917 -109.45
1918 -111.33
1919 -110.29
1920 -108.7
1921 -106.76
1922 -107.55
1923 -106.2
1924 -113.18
1925 -111.98
1926 -105.11
1927 -105.62
1928 -109.52
1929 -108.45
1930 -105.16
1931 -105.19
1932 -100.24
1933 -95.73
1934 -99.6
1935 -95.54
1936 -97.99
1937 -93.5
1938 -90.97
1939 -85.54
1940 -90.15
1941 -78.75
1942 -78.74
1943 -78.26
1944 -84.11
1945 -82.05
1946 -75.11
1947 -71.97
1948 -66.46
1949 -67.77
1950 -65.8
1951 -56.29
1952 -58.63
1953 -54.39
1954 -56.98
1955 -55.69
1956 -60.77
1957 -47.21
1958 -46.93
1959 -46.46
1960 -44.06
1961 -37.11
1962 -40.57
1963 -42.94
1964 -50.72
1965 -39.43
1966 -44.65
1967 -43.95
1968 -43.36
1969 -36.39
1970 -38.3
1971 -33.01
1972 -24.35
1973 -29.12
1974 -18.55
1975 -19.64
1976 -20.5
1977 -22.17
1978 -16.03
1979 -20.79
1980 -15.65
1981 -3.64
1982 -7.17
1983 -0.27
1984 -0.67
1985 -10.31
1986 -10.55
1987 -9.99
1988 -6.51
1989 -1.08
1990 0.43
1991 2.78
1992 6.46
1993 2.45
1994 4.85
1995 8.76
1996 12.28
1997 22.09
1998 15.39
1999 20.05
2000 21.88
2001 26.62
2002 26.53
2003 34.82
2004 34.47
2005 34.04
2006 35
2007 37.88
2008 44.69
2009 52.43
Thanks Willis for doing some proper ‘peer review’ that was obviously lacking before your keen eye!
I’m an interested CAGW (now intangibly described as ‘Climate Change’ [nobody likes change!]) observer, often denigrated as a ‘denier’ for denying ‘irrefutable facts’ I never seem to be presented with… I think in the climate world, ‘facts’ are synonymous with ‘made up numbers based on opinions’.
Keep up the good work!
Adrian
The graph provided by James Hansen is a pure case of climate fraud. How anyone can get away with publishig a graph showing an inflexion point of increased SLR from around 1990 that is not supported by a single tide global gauge, is indeed a great mystery.
http://www.psmsl.org/data/obtaining/rlr.annual.plots/12_high.png
It is a NEW YORK tide gauge (THE BATTERY, southern tip of Manhattan). There is no acceleration whatsoever since 1856. That’s either because land is moving in sync with water or Hansen is silly. The former option is extremely unlikely, so…
I just finished an article on this topic.
Multiple Sources Now Confirm; Climate Data “Adjustments” are Obvious Fravd to Anyone Choosing to Look
https://co2islife.wordpress.com/
AGW Cultists like to defy the laws of physics. Any time this comes up and I show Tide & Current’s graphs showing no acceleration, they claim those are individual locations, but GLOBALLY there is acceleration. So let me see if I have this correctly. 1000 individual cars are moving at a constant speed on the highway, but collectively they are all accelerating in speed. Got it.
Nonsensical to use data that claims to be “global sea level” to the nearest 100th of a millimeter (as in “1860 -189.26”) — even last years sea level can not be calculated to anything near that degree of accuracy or precision. Thus the whole exercise is just “sea level taxonomy” — fooling around with numbers and calculations — none of which adds to our knowledge or understanding of the real world.
Not Willis’ fault — he is just playing their game — and a game is all it is.
In relation to “the game”. 1) Just how do tidal gauges measure “sea level”? It seems that if the land is rising or falling (either above or below the water level), then all they measure is some relationship of water level to land, not necessarily “real sea level” above the center of the earth. 2) If they are only measuring a relative level at any location, how do you combine them and say “this is the global sea level”? Measuring different things with different instruments is just not amenable to averaging and obtaining a true answer. 3) We have hundreds of years of paintings and photos that should have unique physical characteristics (buildings, rocks, sea port heights, etc.) at various locations throughout the world to see how relative levels have changed over time. Am I the only one who wonders why a forensic database of the changes has not been established in order to check these so-called “scientific” projections against?
Paintings and photos are practically useless since they will only tell you what the state of the tide was at the time. Even in areas where there is no tide sea level varies 3-4 feet depending on wind and air pressure. Only by taking continuous measurements and averaging them over months or years is it possible to measure the true (relative) sea-level. And even then it takes decades before a trend is visible.
I don’t think that is totally true. I am not talking about absolutely accurate measurements. But a painting from hundreds of years ago or a more recent photo can give relative differences. If a rock that has been visible for hundreds of years is now submerged one could make a conjecture about the reason. Likewise a building right at the oceans edge is now yards away, should generate some questions.
James Hansen does seem to be trying to be the Harold Camping of climate predictions.
When you have Ellison, a converted Muslim, being elected Senator in 2006, just prior to Obama being elected, , one gets the idea that the stage was being set for further action.
When Sovereignty is lost, there is no where for Law Abiding citizens to turn to for redress, as they no longer have elected leaders, only Appointed ones..Re: California.. Here, We are being governed by Environmental and Social NGOs, who have fought up all the Elected Officials, along with the Unions. An UnHoly alliance if there ever was one.
How are you? It would be fun to get together for a lunch or a talk. Love to all, Clark >
I have a graph showing the sea level rise in Sweden.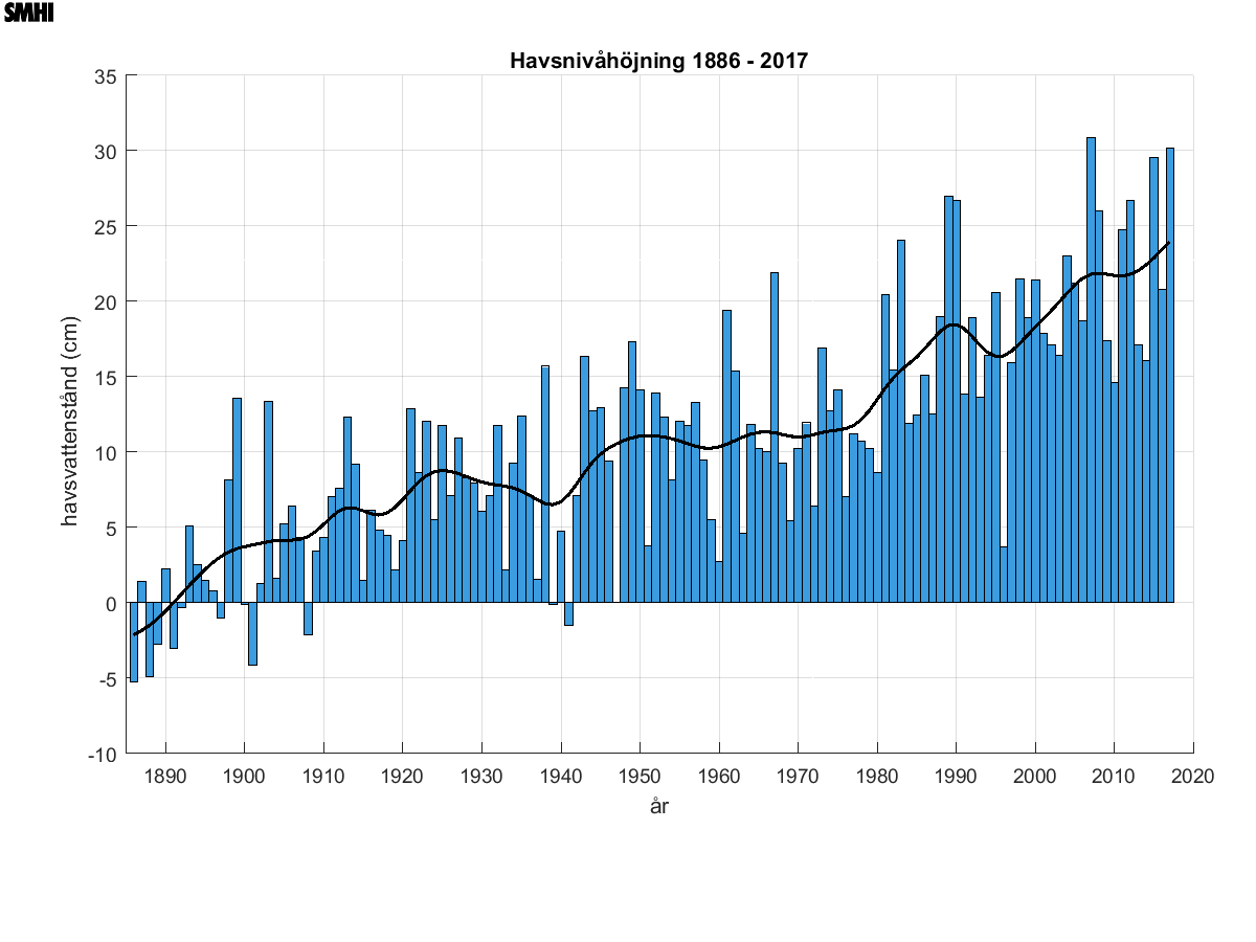
Between 1995 and 2016 the slope is 3 mm/year (20 Years)
There are 3 more periods showing this rate of rise:
1896-1926 (30 Years)
1960-1988 (28 Years)
1975-2005 (30 Years)
The average slope is 1,85 mm/year.
Yet the SMHI(gov) are confident to say -We see an acceleration to 3 mm/year due to global warming.
That is funny especially since the land is rising in Sweden since it got free of ice at the end of the ice age…
http://www.psmsl.org/data/obtaining/rlr.monthly.plots/68_high.png
One can pick their favourite tide gauge from here:
http://www.psmsl.org/data/obtaining/
The graph above from SMHI is adjusted for land rise.
Lars, same is true for the Great Lakes region. Rising land due to glacier pressure now rebounding, lake levels lower. See my questions below.
Actually one pmsl data is enough to debunk the acceleration hypothesis.
How would this tide gauge show this continuous trend and be exempt from acceleration? Did the land started to accelerate the rise to counterbalance the accelerated sea level rise?
How on earth can this work if overall sea level rise is accelerating?
Just so…it takes very little to debunk erroneous assertions.
SMHI is extremely politicized, if anything it is worse than NOAA.
Beautifully accurate analysis, Willis. Today’s Wall St Journal has letters in response to Fred Singer’s previous article on CO2 and sea level rise – including one from Michael Mann. I’ve quoted your article in rebuttal, accurately I hope. Hope your analysis will sway some taken in by Hansen’s ilk.
Just an out-of-curiosity question: how much is it possible to determine whether some of the sea level rise data is due to coastal subsidence as opposed to just a rise in sea level? I’m thinking about this because in parallel, there was concern about lake level lowering in the Great Lakes region some years ago, and it was apparently determined in that case that land adjacent to the Great Lakes was still rebounding from about 10,000 years of glacier pressure on top of that land. This meant the lake levels were not lowering, they were staying the same while the land was actually rising slowly. Is is possible the converse is true with ocean levels? Another example of course is the Tohoku earthquake next to Japan. Coastal land levels sunk about 3m after that quake. How much is the data affected by events like earthquakes in general?
Willis, your thoughts are welcome.
Nowadays it is possible by locating a sensitive GPS receiver nearby. This will measure the height of the ground in geocentric coordinates. However it takes a number of years to get good data.
Normally lake levels are not affected by glacial rebound, since both the land around and under the lake and the lake water rebound together. However if the lakes are very large the rebound will be greater at the northern end (which deglaciated later) and you get a phenomenon kalled “sjööverstjälpning” in Swedish,which translates as “lake overtipping”, i e the water in the lake will tip over towards the southern end where the relative water level will rise while it sinks in the north. I would guess that this effect should be quite noticeable e. g. in Lake Michigan.
Thanks to everyone for a very interesting discussion and to Willis for starting it off. What I did not see was the way in which Willis was able to detect or determine where the data from Hansen was derived from different data sets, adjusted, and then patched together? I love the forensic work, but was it listed in their Materials and Methods, or did you just figure it out by deduction?
A high school science student would get an F for combining data in this way. My brother in law is a high school science teacher, and believes strongly in AGW, and yet as I remind him, he would never allow one of his students to change their data to fit their hypothesis. I just cannot understand how rational educated adults accept this stuff as scientific or authoritative. He also cannot countenance the idea a scientist would act in any way unethically to advance their career. Yet he believes that every business person is a greedy schmuck.
I look forward to future neuroscience experiments that determine how and why our world views are so rigidly fixed at some early period such that facts become irrelevant. And what kind of psychic shock is needed to alter those thought patterns, as sometimes (but rarely) occurs. I wonder if studies on psychedelic drugs would convert any of these AGW believers in the same way as they can treat opioid addicts?
Cold in Wisconsin May 23, 2018 at 9:31 am
Thanks, Cold. It’s all listed in the caption under his Figure 29, shown in the head post.
w.
In Eschenbach’s Figure 5, there does seem to be a “knee” (inflection point?) in the curve at around 1930, but little acceleration (or deceleration) since then. If we use -105.16 mm in 1930 and +52.43 mm in 2009, then the average rate of sea level rise (per Eschenbach) would be (52.43 + 105.16) / (2009 – 1930) = 1.99 mm/year, or about 7.85 inches per century.
Raise your hand if you think it’s possible to build an 8-inch high seawall around your coastal city in the next 100 years!
I’m also wondering–how did Church & White (or those whose data they quoted) measure sea level to the nearest hundredth of a millimeter as far back as 1860, when the tide normally rises and falls twice a day by over a full meter in some places? Shouldn’t the data be rounded to the nearest full millimeter to account for imprecision of the measurements?
Willis said that he digitized the chart, so it’s the precision of his program only.
Did you know that the maximum height of tide in the Bay of Fundy (Nova Scotia) is 16 meters?
sorry, 16,000.00 mm
Tidal gauges are just that. They measure the tides. When you subtract the tides, what is left is sea-level change. Most of this is due to weather. Over a sufficiently long time this will average out.
Also if you look at fig 5 you will see that the uncertainty is much larger in the early part of the diagram when there were fewer stations.
And don’t underestimate nineteenth century instrument makers. Here is a swedish tidal gauge from 1886:
Sea level is measured continuously by a float and mechanically transferred to a pencil which draws a curve on a paper roll driven by the clock while a second pencil, driven by the same clock, marks each full hour.
Hypothesis:
The change in trend since the LIA is all manmade.
1) Improved irrigation and hydro power plants (like the Boulder dam) became prevalent at the start of the 20th century. This slowed the loss of water from the land to the sea and allowed vegetation to tie up more moisture. The sea level rise slowed.
2) Nuclear tests after WW2 caused small areas of the sea to hold far more thermal energy than before. Ths caused some thermal expansion but also allowed local warm water pockets to survive long enough to circulate round the world. This increased Arctic ice loss. The sea levekl rise spikes.
3) Early 1960s, Khruschev and JFK ban nuclear tests. The change in trend disappears. The rest of the graph is just measurement noise.
Nuclear testing is utterly insignificant in this context
Yeah, probably.
But I’ve found a correlation.
That’s more than enough for climatology.
Nice article Willis! One small clarification. Hansen attributes the multiplying the Church and White data by .78 to Hay, et al 2015. In this paper the Church and White data is adjusted in order to close the sea level rise budget from various inputs (heat expansion, ice melt, and land water storage changes, etc.). So there may be some rationale existing for the adjustments since these factors are presumably are being considered in more recent papers. However, it should bring attention to adjustments in general as years ago surface temperature record trends were adjusted down in part because of low levels of recorded sea level change not to speak of tossing some early Argo data on ocean warming trends due to sea level change. Having those adjustments then lead to adjusting sea level change downwards because of a lower warming trend speaks to creeping bias in the whole program.
Changing actual data to conform with theory is an extremely dubious practice. Nobody knows what the ice melt in Antarctica was in 1901 for example (or in 1950 for that matter). If you have sea-level measurements that don’t fit your modelled sea-level budget, I submit that there is probably something wrong with your budget. And how likely is it that tide gauges all over the world were consistently wrong by a constant 22% over a 90-year period? And apparently this problem then disappeared just as satellite measurements started.
moving averages is a very average argument.
I am unmoved by that assertion.
Church paper itself states:
The linear trend from 1900 to 2009 is 1.7 ± 0.2 mm year−1 and from 1961 to 2009 is 1.9 ± 0.4 mm year−1. Note the error estimates.
Willis…my man!
Keeping it real and taking names!
Willis, pardon my ignorance, but I don’t understand your digitized C&W data. What does it mean to say that sea level in 1860 is 189.26 mm? Or that in 1960 it was 40.06 mm? Surely sea levels were higher in 1960 than 1860. So maybe the numbers refer to annual sea level rise–but obviously they don’t, otherwise Al Gore’s 20 foot wall of water would have washed over us long ago.
Marlo, the only stupid questions on my planet are the ones you don’t ask. Those always come back to bite you in the differential housing … you’ve simply missed the minus (-) sign. In 1860 it was -189.26 mm. All of these numbers are anomalies around a specified zero point.
Best to you,
w.
Willis,
Is there some reason why one would not just run a standard F-test to see if the addition of a quadratic term in the expression for sea level would be significant?
The reason is the presence of autocorrelation and a high Hurst exponent. You can’t use standard statistics on highly autocorrelated datasets.
w.
Having been interested in this topic since John Daly’s time, I am perplexed as to why the papers of the expert, Nils-Axel Mörner are completely ignored? The paper: “Glacial Isostasy: Regional—Not Global” has a detailed account of the Fennoscandian region’s glacial rebound and the Netherland’s sinking with the location of the ‘hinge.’ [http://dx.doi.org/10.4236/ijg.2015.66045]
Other of his papers also discuss the problems of tide gauge and satellite data. The above paper has references to many of his papers. If not located, ask him for a copy.
Church & White made a curious/odd selection of tide gauge sites leading to questionable conclusions, especially when they tack on the satellite data, which in turn supposedly relates to a ‘spheroidal surface,’ not necessarily the ocean surface. My guess is that the “additional spatially uniform field” mentioned above, is to make the satellite data ‘match’ the greater-than-a-global average rise of about 1.4 mm/yr, of the USA coastal data (around 3 mm/yr) due to slight sinking of the USA part of the continent as the Canadian part rises. Was this to be parochially correct?
Church & White conveniently ignored their “home” long-term tide gauge, Fort Denison in Sydney Harbour with a rate of rise <1 mm/yr.
As to short-term changes in rate of sea level rise, when ocean basins are subject to cyclical lunar tide changes, atmospheric pressure changes, prevailing wind flow and storm surges it is not surprising that such fluctuations are seen. Thermal expansion is a doubtful factor as changes in continental shelf gauges are no different to those on stable islands surrounded by deep ocean.
prcgoard May 24, 2018 at 10:49 pm
I ignore him because he claims over and over that the sea level is not rising anywhere on the globe … which contradicts the tide gauges everywhere.
I also ignore him because he claims he is able to determine historical sea level rises in Fiji from the cuts made by waves in the tropical islands. Having lived in Fiji, I know that is simply not possible at the level of precision and accuracy that he is claiming.
I’ve met him, he’s a charming guy, but he truly doesn’t understand sea level.
There’s a discussion of his other … well … eccentric claims here … read’m and weep.
w.