Have you been keeping an eye on Sol lately? One of the top astronomy stories for 2018 may be what’s not happening, and how inactive our host star has become.
The strange tale of Solar Cycle #24 is ending with an expected whimper: as of May 8th, the Earthward face of the Sun had been spotless for 73 out of 128 days thus far for 2018, or more than 57% of the time. This wasn’t entirely unexpected, as the solar minimum between solar cycle #23 and #24 saw 260 spotless days in 2009 – the most recorded in a single year since 1913.
Cycle #24 got off to a late and sputtering start, and though it produced some whopper sunspots reminiscent of the Sol we knew and loved on 20th century cycles past, it was a chronic under-performer overall. Mid-2018 may see the end of cycle #24 and the start of Cycle #25… or will it?

The story thus far… and the curious drama that is solar cycle #24. Credit: David Hathaway/NASA Marshall Spaceflight Center.
One nice surprise during Cycle #24 was the appearance of massive sunspot AR 2192, which popped up just in time for the partial solar eclipse of October 23rd, 2014. Several times the size of the Earth, the spot complex was actually the largest seen in a quarter century. But just as “one swallow does not a Summer make,” one large sunspot group couldn’t save Solar Cycle #24.

The partial eclipse of the Sun, October 23, 2014, as seen from Jasper, Alberta, shot under clear skies through a mylar filter, on the front of a 66mm f/6 apo refractor using the Canon 60Da for 1/8000 (!) sec exposure at ISO 100. The colors are natural, with the mylar filter providing a neutral “white light” image. The big sunspot on the Sun that day is just beginning to disappear behind the Moon’s limb. The mylar filter gave a white Sun, its natural colour, but I have tinted the Sun’s disk yellow for a more pleasing view that is not just white Sun/black sky. Image credit and copyright: Alan Dyer/Amazing Sky.net
The Sun goes through an 11-year sunspot cycle, marked by the appearance of new spots at mid- solar latitudes, which then slowly progress to make subsequent appearances closer towards the solar equator, in a pattern governed by what’s known as Spörer’s Law. The hallmark of a new solar cycle is the appearance of those high latitude spots. The Sun actually flips overall polarity every cycle, so a proper Hale Cycle for the Sun is actually 11 x 2 = 22 years long.
A big gaseous fusion bomb, the Sun actually rotates once every 25 days near its equator, and 34 days at the poles. The Sun’s rotational axis is also tipped 7.25 degrees relative to the ecliptic, with the northern rotational pole tipped towards us in early September, while the southern pole nods towards us in early March.

An animation of massive susnpot AR 2192 crossing the Earthward face of Sol from October 17th to October 29th, 2014. Credit: NASA/SDO.
What’s is store for Cycle #25? One thing’s for certain: if the current trend continues, with spotless days more the rule than the exception, we could be in for a deep profound solar minimum through the 2018 to 2020 season, the likes of which would be unprecedented in modern astronomy.
Fun fact: a similar dearth of sunspots was documented during the 1645-1715 period referred to as the Maunder Minimum. During this time, crops failed and the Thames River in London froze, making “frost fairs” along its frozen shores possible. Ironically, the Maunder Minimum also began just a few decades after the dawn of the age of telescopic astronomy. During this time, the idea of “spots on the Sun” was regulated to a controversial, and almost mythical status in mainstream astronomy.
at least it is a testable idea. If we go through 5 years with reduced solar activity and that correlates with 5 brutal winters the idea of AGW will probably be dead.
‘and that correlates with 5 brutal winters the idea of AGW will probably be dead.’ – along with the rest of us as we freeze because we can’t afford to heat our houses thanks to renewables!
If you don’t starve before you freeze.
Don’t you just love a good scary story?
@joegremlin – What you think causes brutal winters?
What is bad weather, Alex?
Brutal Abominable Snowmen?
That reply was supposed to be to meteorologist in research
“the idea of AGW will probably be dead” – joegremlin
HAHAHAHAHA! The idea of AGW will NEVER be dead with the warmists – unless they all freeze to death (and even then I’m not sure).
Trust me, we could have dry ice snowstorms in Miami and the Hockeystick team would be warning us that 59 of the hottest 60 years have been in this decade.
If they freeze, you can bet yer booties that it was caused by too many people on this fragile little planet. That’s the sole cause of all their troubles. Just ask ’em.
“The idea of AGW will NEVER be dead with the warmists”
You are right there. Remember the asteroid that killed off the Dinosaurs? Now you would have suspected that the asteroid would have thrown up dust, blotting out the sun causing catastrophic cooling, would’t you? Not so! It caused Global warming, which killed off the Dinosaurs. The lesson we have to learn from this is, according to MacLeod, we are drastically underestimating the warming to come due to our evil ways and the wrath to come.
https://www.newscientist.com/article/2170015-asteroid-that-killed-the-dinosaurs-caused-massive-global-warming/
“Back in the 1950s three social psychologists joined a cult that was predicting the imminent end of the world. Their purpose was to observe the cultists’ response when the world did not, in fact, end on schedule. What they discovered, and described in their classic book, “When Prophecy Fails,” is that the irrefutable failure of a prophecy does not cause true believers — people who have committed themselves to a belief both emotionally and by their life choices — to reconsider. On the contrary, they become even more fervent, and proselytize even harder.”–Paul Krugman (ironically)
https://www.nytimes.com/2012/12/24/opinion/krugman-when-prophecy-fails.html
Except that a return to facts-be-damned executive over reach before the five years is up gives hope to the advocacy forces of settled science and debate has ended monologue.
Let’s hope the minimum is deep enough to cool the overworked and high watts/synapse brains of the AGW alarmists: http://www.breitbart.com/london/2018/05/23/global-warming-makes-politicians-stupid/
plenty of good weather for ice ‘hockey’ then
Better to use the Hockey sticks for what they were designed for than silly charts!
The way things are going, it’s hard to imagine the idea of AGW will die. Brutal winters, like any out-of-average weather phenomenon, will be attributed to man-made climate change, and the music will keep playing.
And the explanation is simple. Warming causes Freezing! Do you see?
BernardP -“Brutal winters, like any out-of-average weather phenomenon, will be attributed to man-made climate change, and the music will keep playing.”
What do you think is causing the long-time winter records to be broken? Or is it too early in the sequence of brutal winters to conclude anything?
“at least it is a testable idea. If we go through 5 years with reduced solar activity and that correlates with 5 brutal winters the idea of AGW will probably be dead.”
huh?
Let’s see if I can make it simple for you.
AGW theory:
T = F(X,Y,Z)
The temperature of ANY PLANET is a function of The
X: solar input
Y: The GHGs
Z: Aerosols
If we experience a minimum, theory says temperature (ON AVERAGE) will be lower.
Now if we have a minimum and temperature goes up… Skeptics will ignore the busting of their “theory”
“If we experience a minimum, theory says temperature (ON AVERAGE) will be lower.”
Not with the ocean modes acting as negative feedbacks to solar variability.
@joegremlin wrote:
If we go through 5 years with reduced solar activity and that correlates with 5 brutal winters the idea of AGW will probably be dead.
If the Sun causes 5 brutal winters, that won’t say one iota about anthropogenic GHGs, only about the Sun.
Does the question even need to be raised? A deep solar minimum with correlated cooling temperatures is a given at this point. Fortunately, I’m old enough that I probably won’t be around for the worst of it, but my grandchildren will be.😢
Isn’t a longer term and more significant solar minimum cycle assessed to take place around 2050, of similar scale and duration as ‘The Little Ice Age’?
Imo, there is some probability that after the end of this cool trend in the early 3030s that we will then see a double dip second 30+ year cool trend. That would end around the mid 2060s, and that would mean a deeper cold for the interim. As for the likelihood of such an occurrence I would say 50/50. Looking back at the history of gsm’s it does look like they alternated between a single 30+ year period which is then doubled in the following occurrence. That is speculative.
Thank You!
I realize we had a Bray and Eddy minimum around 1350 yBP so we should not expect a grand minimum at this time. Possibly a Dalton minimum for Cycle 24 25 26. Is there a cycle longer than the 2450 year Bray cycle that could allow a grand minimum to start at this time?
Sandy, Minister of Future
Should be 1450 CE for Bray and 1650 CE for Eddy. Blurry screen, heh. Sandy.
Go here for perspective:
http://www.sidc.be/silso/spotless
Don’t which sunspot numbers they are using, the old or the revised.
Just as a sidebar, I’ve been comparing the revised count with magnified SDO/HMI/ Continuum images and I seldom disagree, only seems to be that I see them disappear sooner than the official count.
Might just be that I use Helioviewer.
Why are you looking at sunspots as a proxy for solar irradiance, when it’s directly measured every day by satellite?
http://lasp.colorado.edu/data/sorce/tsi_data/daily/sorce_tsi_L3_c24h_latest.txt
Okay so the next logical set of questions would be, 1) Where are the science measurements of the shrinkage of the stratosphere in response?, 2) Where is the research and measurement of effects on the NH jet stream in response to that shrinkage?, and 3) How are the changes in the jet stream measured on summer temps and weather patterns and winters in the NH? These are important questions that go beyond the chart watching of solar minimum and do relate to actual observations of the 2009 solar minimum on summer temps and weather.
Something has caused the surface wind patterns to undergo an obvious shift in patterns around 24 months ago.
Since at least the summer of 2017 the jet stream has become more unstable.
With increased activity in the Eastern Pacific and now in the Arctic. lf this remains in place then the swings in weather we saw during the LIA could make a return.
This Summer cooler temps are most likely to be seen in northern central Russia and the NE corner of N America. Also expect an early start to the winter in these area’s as well.
Humm, I would have guessed the word stronger for jet stream not “more unstable.” And stronger would imply more winter-like storm fronts in the summer making for unseasonable weather patterns and temps.
lts not so much stronger, more a case of becoming more “busy” and spread over a wider area.
There been a increased in activity in areas of the globe that are normally quiet jet stream wise (eg) eastern Pacific and the Arctic. lts this change in the Arctic that is getting my interest.
Do you mean more meridional (I.e. loopy) vs zonal (straight west to east flow)? Meridional flow is responsible for extreme cold snaps and heat waves. Zonal flow is responsible for ‘boring’ weather.
Richard Patton
What l mostly mean is that its splitting and looping more and in general has been more messy looking.
Rather like its been spread over a wider area rather then in a single stream.
Yes we are getting looping but where the change has been is in the increase in branching and offshoots coming from the main jets. So in general just looking more unstable. This is causing increased activity within the Arctic, Which means its flushing more cold air out of the Arctic and largely over the same areas.
lts this change is what l think is most important.
It’s geoengineered with microwave transmitters – both from earth and space
I wonder what would happen if the temperature gradient between the equator and the poles flattened?
Oh wait, it has.
zazove May 23, 2018 at 10:41 pm
Mmmm … sorta. Per CERES, the difference between the tropics (20°N/S) and the North polar region (60-85°N) is ~34°C. From the tropics to the South polar region is ~44°C, because the Antarctic is colder.
You are right, per the UAH MSU, since 1979 the difference between the North polar regions and the tropics has narrowed by about half a degree, or 1.5%. However, the difference between the tropics and the South polar region has actually increased, by just under half a degree, or 1%.
Go figure … in either case, the change is quite small, a mere one percent or so.
w.
Arctic amplification may make the jet more meridional sending cold air into bible belt and warm air to the pole. So many here get all frothy and indignant when that happens but thats exactly what climate scientists predict will happen more frequently. A positive feedback.
http://iopscience.iop.org/article/10.1088/1748-9326/10/1/014005/pdf
Highly likely that alone would swamp any effects of a few missing sunspots.
zazove: “but thats exactly what climate scientists predict will happen more frequently.”
So if it doesn’t happen more frequently you will admit that the theory has failed?
Let’s say the next ten years?
zazove on May 24, 2018 at 1:01 am
“Arctic amplification *may* make the jet more …”
—-
Yes zazove, but easter bunny and santa have said they will prevent that via talking to Tinka Bell about speading fairy dust into the jet steam with santa’s ride.
That link above suggests it (a wavier vortex) may already be happening.
I admit, that’s compelling.
I know WXcycles, expressing uncertainty on WUWT is an anathema.
taxed , regarding flushing more cold air out of the arctic in summer,are you sure about that ? http://ocean.dmi.dk/arctic/meant80n.uk.php
zazove see above post. does the theory regarding warm air intrusion to the arctic only work in winter ? if so why?
bitchilly May 25, 2018 at 2:55 pm
“zazove see above post. does the theory regarding warm air intrusion to the arctic only work in winter ? if so why?”
It’s complicated, but the cold core lows energized by the jet stream level flow pull the denser cold air south and warmer air fills in behind it. Sometimes they’re called polar vortices.
Sorry, I was thinking of the subtropical jet.
The timing of this descent into solar minimum was correctly predicted by the planetary orbital resonance model we produced and published in 2013. Many said at the time that we were wrong because low cycles are long cycles, and anyway the planets can’t affect the Sun because they are too small and far away. While it’s not proof, correct forecasts are valid supporting evidence for a hypothesis.
I’ve added the 2013-2018 data to the 2013 plot/forecast below in faint red.
Full paper here:
http://www.pattern-recogn-phys.net/1/117/2013/prp-1-117-2013.pdf
That 4.5-year bump is going to be a hypothesis killer, I’m afraid. It already creates an alignment problem in figures 5-7 in the paper.
But if it does take place, I’m in. We haven’t seen anything remotely similar in 350 years.
I beg to disagree. The ‘missing cycle’ at the start of the Dalton minimum is comparable. See for example https://agupubs.onlinelibrary.wiley.com/doi/full/10.1029/2002GL015640
Hi, Tallbloke.
The missing cycle hypothesis is not supported on hard evidence. If a minicycle takes place in a few years, with everybody looking, no doubt the hypothesis will get a lot of support, but I am very skeptical. I don’t think it is going to happen.
Tallbloke, how about let’s settle this Julian Simon style. I will bet you $100 right now that there will be no 4.5 year sunspot cycle before 2035. Heck, I’ll bet $100 that there won’t be a sunspot cycle shorter than 6 years before then. Anthony can hold the stakes. Payable to your favorite charity if you wish … my favorite charity is WUWT.
You claim that you have great faith in that forecast … now’s your chance to prove it.
Or not … your choice.
w.
Willis. Look again at the plot. Do you see that in large black friendly letters, it says: “10.5yr or 15yr cycle” ?
Can you see that the black double ended arrow under the words covers that 4.5year blip? Are you aware that at the start of the Dalton minimum there was a 15 year long cycle which some eminent researchers say had a short cycle buried in the tail end of it?
Go and read the I. G. Usoskin K. Mursula and G. A. Kovaltsov paper and then return for sensible discussion.
https://agupubs.onlinelibrary.wiley.com/doi/full/10.1029/2002GL015640
some eminent researchers say had a short cycle buried in the tail end of it?
The currently accepted view is that there was no such short cycle, your ’eminent’ researchers not withstanding.
In addition you got the amplitudes wrong [as well as the time of the previous minimum].
My comment of the many people trying to make fools of themselves turns out to be quite accurate, it seems.
tallbloke May 23, 2018 at 11:36 am
Thanks, tallbloke, and yes to all (except the “eminent researchers”).
I also see that you defended the existence of the 4.5-year cycle, viz:
… to which you replied …
I also see that in the Usoskin prediction there is undeniably a 4.5-year cycle, no matter how you try to spin it as a 15-year cycle.
However, now it appears that you are unwilling to put your money where your mouth is regarding the short cycle … funny how that works …
w.
PS—on another subject, are you ever going to un-ban Joel Shore (and by extension myself) from your website? It puts you into the same league as other cowards like Gavin Schmidt over at RealClimate who are unwilling to listen to opposing voices …
Willis, I’m sure Usoskin, Kovaltsov and Mursula will meekly accept your judgement that they are not eminent researchers, what with you being such a great solar expert and all.
I’m not “trying to spin it as a 15-year cycle”. That’s simply what it was thought to be until Usoskin et al added in the data which showed it to be a ~10 year cycle plus a ~5 year cycle, similar to what our model predicts for the next 15 years or so. I expect it will be sometime after the event before it’s sensible to come to any firm judgement on the issue, as the sun doesn’t pay any heed to our imperfect sunspot counting methods and imperfect models.
Relax and enjoy the ride. I’ve put my money where my mouth is by buying a property with some growing land Eight degrees of latitude further south from my current location. That’s a much better bet than arguing over sunspot numbers. It’s a lovely, peaceful rural location near a fabulous ancient forest and several beautiful medieval villages.
PS. no, thanks.
tallbloke May 23, 2018 at 1:04 pm
Rog, you defended the 4.5 year cycle until I offered to bet on it, and now, suddenly you are ducking and dodging. As we used to say on the ranch I grew up on, you’re all hat and no cattle … you are willing to spout off, but you don’t have the albondigas to stand behind your strongly-expressed opinions.
Congratulations on your purchase. As someone who likes rural living, it sounds like a wonderful place, and I sincerely wish you great enjoyment there.
Finally, I’d said:
To which you replied …
Hey, if you want to be in the same class of scientific cowards as Gavin and Tamino, that’s up to you … regardless, you’re still free to post here. Unlike you, Gavin, and Tamino, here we don’t censor people who have differing scientific ideas …
w.
Willis: As someone who likes rural living, it sounds like a wonderful place, and I sincerely wish you great enjoyment there.
Thanks. It’s around 4C warmer than my current location on average. Global warming just wasn’t happening fast enough for my liking. Also, being out in the sticks in the unfashionable end of France, it has wonderfully dark night-time skies, perfect for astronomy and stargazing or watching meteor showers. And the beach is under an hour’s drive away.
Unlike you, Gavin, and Tamino, here we don’t censor people who have differing scientific ideas
[Cough]
https://tallbloke.wordpress.com/2012/01/15/the-massacre-at-cowboy-corral-a-bad-day-for-science/
tallbloke May 23, 2018 at 2:13 pm
Man, you’ve got some nerve. You ban me from your website and then invite me to read a post there … ah, well, I’ll bite, hang on … oh, of course, you’re trying to claim that I censored people with differing scientific ideas.
In fact, in that post I said that I wanted people to stay on topic, and I warned them that if they strayed off topic they would be snipped. You protested, saying:
Rog, you were clearly warned that if you went off into side issues, your response would be snipped, NOT BECAUSE IT DISAGREED WITH MY SCIENTIFIC VIEWS, but because it was OFF-TOPIC. Despite that, you kept trying to sidetrack the conversation, viz:
tallbloke January 14, 2012 at 1:48 pm
So no, Rog, you were NOT snipped for holding a different scientific view, that’s a load of bulldust. You were snipped for trying to derail the conversation just as I warned you that you would be.
Censoring people who disagree with you on scientific matters is what YOU do, just as Gavin Schmidt and Tamino do. It is not what WUWT does, nor is it what I did, and it is a cowardly and underhanded action on your part.
w.
[Snip] You were snipped for trying to derail the conversation just as I warned you that you would be.[snip]
Actually I was snipped for giving a concise and logical reason why your crit of Jelbring’s paper was a non-starter. But never mind, the principle is good, so where were we?
Oh yes, solar minimum and grand minima.
Here’s our model’s 4000 year hindcast matching the TSI reconstruction from 10Be. Presumably the funded mainstream solar scientists have something as good or better than this? No?
Here’s our model’s 4000 year hindcast matching the TSI reconstruction from 10Be.
Since we now know that 10Be was not the correct proxy for solar activity in the past, it is quite a feat to ‘hindcast’ the wrong behavior…
Orbital resonance in the solar system affects Earth’s climate in several ways, not solely via solar variation, so it’s not surprising to see a strong correlation between our model and 10Be based indices.
Is that Steinhilber et al., 2008 ¹⁰Be reconstruction?
If so yes, it is very surprising to see such strong correlation. Steinhilber’s 2008 reconstruction uses only NGRIP data for the 7363 BC to 850 AD period from Vonmoos et al. 2006.
The problem is that Greenland ¹⁰Be and Antarctica ¹⁰Be data must both be used to correct for differences in transport and precipitation. Steinhilber et al. 2012 reconstruction deprecated Steinhilber et al., 2008 reconstruction, and the new reconstruction by Wu et al., 2018 is even better through the use of a Bayesian approach to redate the wiggles in ¹⁰Be to match ¹⁴C data whose dating is more precise.
I recommend you update your solar reconstruction as the improvement since 2008 has been very important.
Thanks Javier. It’s the 2012 data. We haven’t got around to working with the 2018 data yet. I disagree with Leif when he says 10Be isn’t a proxy for solar activity. It’s long term variation matches the long term sunspot record reasonably well. Mind you, Leif has been trying to iron the long term solar record flat for years.
Thanks Tallbloke. Steinhilber et al. 2012 reconstruction is not ¹⁰Be data. It is ¹⁰Be + ¹⁴C, which is much better.
http://www.pnas.org/content/109/16/5967
“Here we combine different 10Be ice core records from Greenland and Antarctica with the global 14C tree ring record using principal component analysis.”
It is the one I’ve been using so far, as it is the correct approach to minimize climatic contamination. My only objection is that none of the reconstructions uses IntCal13, not even the one from 2018. So there is still significant room for improvement.
I don’t care what Leif says. He is promoting his views. The general view is that cosmogenic records, when properly corrected, represent fairly within uncertainty the past solar activity.
I am open to alternative hypotheses to explain past solar activity and climate, but to be minimally convinced I require a level of evidence that hasn’t been reached yet. Being able to predict future solar activity would be a good start.
I think the relevant cycle whereby we can predict the next solar cycle is the GB cycle
e.g.
http://iie.fing.edu.uy/simsee/biblioteca/CICLO_SOLAR_PeristykhDamon03-Gleissbergin14C.pdf
https://www.nonlin-processes-geophys.net/17/585/2010/npg-17-585-2010.html
That is why I said that the most probable prediction for the strength of SC 25 is that it will be equal to SC 17.
My own results lead me to believe that the latter report putting the GB cycle at 86.5 years is the more correct one.
Now, as it appears from the reports there is an anomaly. It seems that every time so often at the end or in the middle of every GB cycle (i.e. that would be DeVries cycle ) there is either a grand minimum or a grand maximum leading to either some prolonged cooling or warming. That is probably why some reports keep to an average 88 year GB cycle.
In this particular case I checked and found correlation between the positions of Saturn and Uranus and the relevant turning points on (my) 86.5 year GB sine wave.
Obviously, I have been thinking about what causes the ‘grand’ Minimum or – Maximum and in the end it seems the most likely explanation is that somehow the planets did not arrive in time or there is some imbalance in gravity so that we don’t have the [electrical] switch on the sun putting us in the ‘normal’ cycle.
Instead we have a delayed Hale cycle.
Must say, I have been praying that we won’t have a grand Minimum. That would be a disaster.
Anyway, all indications are that we did not miss the switch.
Never mind all of that.
All of this leads me to the direct question to Javier/Tallbloke:
Do you think the position of the planets is cause to the climate on earth?
I personally don’t see evidence of a ~ 87-year cycle in sunspot records for the past 350 years. In my opinion the Peristykh paper is not convincing.
Yes, but not in the sense you are implying. The planets, and particularly Jupiter, are responsible for the orbital changes that produce the coming and going of glacial periods. As such the planets are cause of the most important climate changes on Earth in the 10⁴-10⁵-year time-frame. Whether they also rule over solar activity changes, there is insufficient evidence for me to support that hypothesis.
Javier
Many thanx.
I cannot respond now. I will respond later.
Tallbloke?
Javier
SSN is not my favorite but even here you can draw a binomial [representing the average SSN] from 1927 coming to a dead end stop in 1971. From 1972 you can draw a binomial again down to 2014 representing the average SSN. Those two binomials are like mirror images.
It appears that a double pole switch on the sun occurred in 1972 and 2014, i.e. in the middle and at the end of each GB cycle.This is the ‘electrical switch’ being pulled (at the maximum and minimum on the sine wave)
possibly by the planets, IMHO.
I first stumbled on the GB cycle checking maxima in Alaska, going back to 1940s.
It also became visible when I looked at minima, as explained before
(just click on my name to go to my report on that)
I think for anyone wanting to see the GB cycle I would recommend looking at maxima and minima, and how this changes. Best is to set out K/annum versus time, i.e. the derivatives of the least square equations over at least 4 periods versus time. See how the speed of warming/cooling changes over time.
Sorry Henry, I am not following you. Looking at data since 1940 means you can only have one oscillation, so you won’t see a cycle.
The way Gleissberg defined the cycle (7 solar cycles, 78 years), does not exist. Since then each author defines it differently, and any periodicity in the ~ 50-100-yr range gets named Gleissberg. Not a very good sign.
Then every short solar periodicity, 11, 52, 104, and even 208-year periodicities can be clearly seen in the sunspot record, but not the 87-year one.
Whatever it is that you are finding at ~ 87-year, it does not appear to be a periodicity in solar activity. At least as we currently understand solar activity.
http://oi60.tinypic.com/2d7ja79.jpg
true enough. I don’t have a whole sine wave cycle….but the overwhelming evidence is on my side? Note that this investigation was done quite a few years ago and I assumed the 88 year mentioned in the P. report was the correct wave length. It turned out that we had the double solar polar switch in 2014, suggesting to me the cycle is 86.5 years, as also mentioned in the 2 report that I quoted earlier.
Anyway, even looking at the solar polar field strengths, don’t you see that you can draw a binomial from 1971 to 2014 representing the average field strength? That would be exactly half the GB cycle, i.e. ca. 43.5 years
just to clarify my last remark
http://oi63.tinypic.com/2ef6xvo.jpg
note that the straight line drawn by Leif is of course incorrect. It shows a trend but it does not represent the average measured figures. I say that you can draw binomials top to bottom (hyperbola) and bottom to top (para bola) to give you the correct average north and south polar filed strengths.
Dead end stops are 1971/2 and 2014.
henryP, thanks for the papers. I always wonder what the patterns would look like if they were totally random. Fluctuations right down to the smallest scales in the sun, building up and dissipating.. The continual rotation of the Sun… Is the Sun’s rotation slowing?
Many a child has made a model of the solar system. If you take a penny as the size of the Sun then Jupiter is about the size of the O in the ONE CENT on the tail’s side. At this scale this Jupiter is 5 feet away from the penny. Of course space is very ‘empty’ and any small effect is not blocked (opposed) generally speaking, and the effects are endlessly stronger and weaker with resonances.
HenryP, thanks for the papers.
sorry, too many typos in that earlier post —
I always wonder what the patterns would look like if they were totally random. Fluctuations right down to the smallest scales in the Sun, building up and dissipating.. The continual rotation of the Sun… Is the Sun’s rotation slowing?
Many a child has made a model of the solar system. If you take a penny as the size of the Sun then Jupiter is about half the size of the O in the ONE CENT on the tail’s side. At this scale this Jupiter is 5 feet away from the penny. Of course space is very ‘empty’ and any small effect is not blocked (opposed) generally speaking, and the effects are endlessly stronger and weaker, with resonances.
Willis, while you’re accusing RealClimate of banning you, note that WUWT bans plenty of people because they accept and communicate the AGW consensus.
Thanks for the link TB. It will be interesting to see if that “stunted” cycle happens. That type of prediction is in the “spooky action at a distance” category and we know how that one turned out 🙂
I’m not sure how much further forward we are with general relativity. What, exactly, causes space-time to curve around massive objects such as planets and stars? An ‘intrinsic’ property of mass?? Aristotle’s not a dead dog then…
The larger problem with your prediction for SC25 there is that your SC23/24 minimum date of 2018 is too early.
Sorry 24/25 minimum…
In the last sentence, should “regulated” be “relegated”?
The 2008-2009 solar minimum was a surprise to astrophysicists at it was deeper and longer than anything seen previously by modern scientists in the satellite era. The 2018-2019 solar minimum could also hold some surprises.
The number of spotless days correlates very well with solar activity.
http://www.sidc.be/silso/IMAGES/GRAPHICS/spotlessJJ/SC25_SCvsNumber.png
Unless the correlation is to be broken, there are a lot more spotless days in store for current solar minimum.
I would guess somewhere between 600-800 more spotless days for current solar minimum. That’s over 2 more years of solar minimum.
With a WUWT article about the issue every couple of weeks, that’s about 50 more articles. Save some ammo, Leif.
So plenty of chances for people to make fools of themselves…
Already several in this very post.
By then we will all have post traumatic svalgaard disorder (ptsd… ☺), not just Javier!
Test…
My impression is — There is something fascinating about science. One gets such wholesale returns of conjecture out of such a trifling investment of fact. h/t Mark Twain
I love that quote.
Here is the full quote from Mark Twain, as a geologist (by training) I dearly love this quote:
“In the space of one hundred and seventy-six years the Lower Mississippi has shortened itself two hundred and forty-two miles. That is an average of a trifle over one mile and a third per year. Therefore, any calm person, who is not blind or idiotic, can see that in the Old Oolitic Silurian Period, just a million years ago next November, the Lower Mississippi River was upwards of one million three hundred thousand miles long, and stuck out over the Gulf of Mexico like a fishing-rod. And by the same token any person can see that seven hundred and forty-two years from now the Lower Mississippi will be only a mile and three-quarters long, and Cairo and New Orleans will have joined their streets together, and be plodding comfortably along under a single mayor and a mutual board of aldermen. There is something fascinating about science. One gets such wholesale returns of conjecture out of such a trifling investment of fact.”
– Life on the Mississippi, Mark Twain
Instead of the length of the Mississippi, I can imagine substituting “global warming.”
Just 19,000 years ago, this past November, it was freezing cold and the ice over Manhattan was a mile thick. One can easily see that 72 years from now we will be broiling in heat as the oceans boil. Sea food will be dirt cheap as fully cooked fish pop out of the ocean onto your dinner plates.
“One gets such wholesale returns of conjecture out of such a trifling investment of fact.” Thanks for that, Andy. I was wondering where the Twain quote was located.
I also love the complete quote. Specially the part about “just a million years ago next November”
What a great writer and person.
That is truly a golden quote by Mr. Clemmons.
Andy May, thanks for the whole quote. Copied & saved.
Javier, you appear to be using the old sunspot numbers in your graph above … I can’t replicate your graph with the SILSO daily sunspot numbers.
w.
It is not my graph, Willis, It is SILSO’s graph.
 )
)
http://www.sidc.be/silso/spotless
The caption is: “The graph above shows the evolution of the total number of spotless days per cycle minimum transition and the yearly international sunspot number (Sn) since 1818. Note the values for Sn are in reverse order. The number of spotless days has been set in the year of the cycle minimum. For example, there were 817 spotless days during the SC23-24 transition, and this data point has been set in 2008, the year of the solar cycle minimum. There are some missing data for the period 1818-1849, and the data for SC10-11 are under revision, but all in all this graph conveys pretty well that -in general- a low amplitude cycle is preceded by a solar cycle transition with a high number of spotless days, and vice versa. Nonetheless, there are some notable exceptions, such as SC16 and SC20. The blue dot to the lower right represents the number of spotless days (176) for the current cycle transition. It is obviously too early to conclude anything about the amplitude of the next solar cycle.”
I trust they have used the correct sunspot number and procedure. If you believe they have not, you should inform them.
Thanks, Javier. I’ve figured out what they’ve done. They are comparing spotless days with the yearly average spot count, and I was comparing spotless days with the daily spot count.
In addition, they only counted spotless days during the year which contained the solar minimum, and I counted spotless days during the entire solar minimum, which seems like a more logical method …
Much appreciated,
w.
There are a number of theories afoot, with just a few centered on mechanism while most others are centered on cyclomania. I hang my hat on mechanism, not references back to a previous low activity period. Given the way the Sun gets somewhat bound up and gives us hints about that based on surface activity, the previous cycle should tell us a bit about the coming cycle. The Maunder Minimum would not be able to inform us about our next cycle.
Pamela Gray – that’s right, if I look back at the old patterns and find a pattern similar to this one in the much-to-be-desired-old-data, it’s a great feeling.
A few years ago we had something similar going on here at the weather station. Farmers came in with reams of old records and tried to find patterns in the surface reflections of our 700 mb/height charts. They found quite a few. But when we actually looked at the causes of the patterns – all the causes (and lifecycles) were different. No two causes were the same, This was quite disappointing, but quite understandable.
Gee, it would be nice if we could just pop the sun into a nice little lab somewhere and try all our theories on it.
I spent a good part of my career trouble shooting and inventing solutions. A lot of it involved dreaming up mechanisms that fitted the facts. I paid particular attention to the inconvenient facts, the bits that didn’t fit. These were the most important clues because they indicated that the current thinking needed to be modified. But these were the ones most often ignored by others because they were inconvenient.
Pamela is right. Consider every possible mechanism and explanation. If you have every possible one, then know that one of them is right. It may not be the one that you initially expected.
In 1949, Frankie Laine had a hit song with “That Lucky Old Sun” ( had to look it up).
The lines included “Nothing to do but roll around heaven all day”.
Now he is doing less of it.
CAGW has been fraudulent from the beginning. Can you imagine coming from a science background and confecting a theory with only one influence on climate change–CO2?
In this case, the passion to control people overwhelmed the need for probity. Also, there is the money side.
Medieval troubadours had it figured out “His bread I eat, his song I sing.”
In the early 1800s, Goethe made a pertinent observation that included that men of science would “worship error if it afforded them a living.” From memory, but it is close.
As Kepler was discovering that planetary orbits were elliptical, his government paid him for casting horoscopes. He needed to make some money.
When he was a student his tutor taught that the solar system rotated around the Earth. He had to make a living. Privately, he was a Copernican.
The only way for governments can be made to stop funding bogus science is to run out of money. Or by the will of the people as this popular uprising continues to become more influential.
The last such uprising turned astrology into astronomy and alchemy into chemistry. In the late 1500s, the biggest bank at the time published a newsletter and in one of them noted that only governments were foolish enough to fund alchemists.
Today’s form of alchemy also serves the state. Interventionist central banking whereby credit is confected out of “thin air”.
The state has employed in economic and “science” the only theories that will add to its power.
The next recession will take apart the notion that central banks with trillions of taxpayer money can prevent bad things from happening.
As solar activity continues to diminish, cooling will disprove that the state can set the “perfect” temperature of the nearest planet.
Another Great Reformation will be advanced. The last one began to become successful in the early 1600s. England had the best experience in it. Europe with the “Thirty Years War” had a bad time reforming unlimited government.
Bob Hoye
For those who are unfamiliar
This is from the Zharkova press release 2015 …
A new model of the Sun’s solar cycle is producing unprecedentedly accurate predictions of irregularities within the Sun’s 11-year heartbeat. The model draws on dynamo effects in two layers of the Sun, one close to the surface and one deep within its convection zone.
Predictions from the model suggest that solar activity will fall by 60 per cent during the 2030s to conditions last seen during the ‘mini ice age’ that began in 1645. … Results will be presented today by Prof Valentina Zharkova at the National Astronomy Meeting in Llandudno. … Zharkova and her colleagues derived their model using a technique called ‘principal component analysis’ of the magnetic field observations from the Wilcox Solar Observatory in California. They examined three solar cycles-worth of magnetic field activity, covering the period from 1976-2008. In addition, they compared their predictions to average sunspot numbers, another strong marker of solar activity. All the predictions and observations were closely matched. “Combining both waves together and comparing to real data for the current solar cycle, we found that our predictions showed an accuracy of 97%,” said Zharkova. “Effectively, when the waves are approximately in phase, they can show strong interaction, or resonance, and we have strong solar activity. When they are out of phase, we have solar minimums. When there is full phase separation, we have the conditions last seen during the Maunder minimum, 370 years ago.
*So, a 60% reduction coming to a star near you.
Sandy, Minister of Future
Prof Zharkova!
Quick, get Flash Gordon!
^¿^
Yes; and the Earth’s spin axis is tilted 23.5° with respect to its orbit around the Sun.
A third axis may be imagined perpendicular to the plane of the Earth’s orbit.
No two of these three axes need be colinear, nor are they.
Zharkova’s model has already been shown wrong by Usoskin. It doesn’t properly hindcast, so it is nearly impossible that it can properly forecast.
@Javier- could you give me a pointer to the Usoskin document that refutes the Zharkova model? Also the fact that we are moving into new solar regime suggest it would not be that important to hind cast accurately if the forecast was accurate.
Sandy, Minister of Future
Usoskin, I. G. (2017). Comment on the paper by Popova et al.“On a role of quadruple component of magnetic field in defining solar activity in grand cycles”. Journal of Atmospheric and Solar-Terrestrial Physics.
https://arxiv.org/pdf/1710.05203
@Javier- Thanks for the link. The main complaints by Ilya Usoskin are they introduce ‘new stuff’ and they missed the Sporer min. However, the Zharkova hind cast does predict the Dalton, Maunder and Wolf minimum. It also covers the conventional LIA. It does not show the big Sporer minimum but it is possible the Sporer minimum might have been due to another cause.
All in all, to me, sounds like ‘sour grapes’ or NIH ( not invented here).
In 600CE a Zen Master said, “Dont let your ego prevent enlightenment.”
The progress of canonical science is often held back by torchbearers, until their torch goes out.
Sandy, Minister of Future
Well, no doubt evidence can always be interpreted in different ways. Personally, Zharkova’s model is incongruent with my analysis of historic cycles, so either she is wrong or I am wrong. Or as Leif would say both are wrong in different ways. We’ll see.
@ur momisugly interzonkomizar… I would say very unlikely because this Warm Period is not over by any means. That will make the difference as to how deep the cool trend can go. When this cool trend finally ends the warming will resume through the next century from my outlook.
@Goldminor- what I have seen of Bob Weber’s Figure 10: F10.7cm flux shows ocean cooling since 2004, ond Ole Humlums chart showing North Atlantic cooling, I expect after the coming cold cycle, whether it’s 20 or 80 years long, the heat left in the ocean will not bring the air temperature back up to what it is now, 14.5 C. Mabe 13.0.
Sandy, Minister of Future
I don’t expect to see higher temps than what has already occurred either. I think that we have just lived through the peak of the Modern Warm Period. The analog in my opinion is what the JG/U 2K tree ring study shows. It clearly shows both the MWP and the RWP, but one aspect stands out when studying the graph. That is that in both Warm Periods, temps ramp up to a peak somewhere during the 500+year length of the WP and then trail off.
So I expect the current warm period to last somewhere around the year 2200, before giving way to the next Cool Period. That Cool Period is likely to be the drop off into the next glaciation. That means that mankind should have plenty of time to sort out its future energy needs, hopefully. …http://www.uni-mainz.de/eng/bilder_presse/09_geo_tree_ring_northern_europe_climate.jpg
What do you expect in the short term as to ocean conditions, ssta/sst?
Based on models. We will see if this holds up any better than the CAGW models.
“The Sun’s rotational axis is also tipped 7.25 degrees relative to the ecliptic, with the northern rotational pole tipped towards us in early September, while the southern pole nods towards us in early March.”
WR: Is there anything known about an eventual precession or obliquity of the sun’s axis?
A good and pertinent question to which I too would like an answer. There is a 974 year cycle of angular momentum in the solar system, driven by the outer planets, which hold 98% of the system’s angular momentum. If the planets do have any effect on the Sun, we might expect its polar axial orientation to precess at that frequency or a resonant multiple of it.
@ur momisugly tallbloke… never heard of that. Note how that could well fit with the 550 +/- warm followed by 400 +/- cool pattern which I see when looking at long term graphs.
The Earth’s poles are more ‘flat’ than the Earth is at the equator because of the centrifugal force. Being a gaseous object, the Sun must have a similar form, probably even more pronounced. We always think about the sun as radiating equally in all directions, perpendicular to its surface which is (was) supposed to be perfectly round. But what, if the Sun is not exactly ‘round’ and what if there is a certain precession of her axe? The sun will not shine equally in all directions and in case of obliquity or precession variations there might be a ‘wobble’ in radiation, for example into the direction of the Earth.
@Tallbloke- could you provide a link to a chart or post re the 974 yr angular momentum cycle? I would like to check for climate effects. Thanks.
Sandy, Minister of Future
@Tallbloke- could you provide a link …
Never mind, goog got it. Just have to ask right question, heh.
Sandy, Minister of Future
Is the Sun’s rotational axis REALLY tipped 7.25 degrees relative to the ecliptic? Or is the Earth’s orbit (and thus what we call the ecliptic) tipped 7.25 degrees?
~¿~
It’s tipped 7.25 degrees relative to the plane of invariance, not the ecliptic.
Yes; and the Earth’s spin axis is tilted 23.5° with respect to its orbit around the Sun.
A third axis may be imagined perpendicular to the plane of the Earth’s orbit.
No two of these three axes are colinear.
Tallbloke! You gave me a new orbital mechanics concept to study!
Thank You! ^¿^
Now, the plane of invariance sounds like it is based just on the orbits of the planet’s (and their effect on the barycenter) but if one of the planet’s (especially Jupiter) had its orbital tilt changed, that would change the plane of invariance too.
I wonder, if you really wanted to set an ‘True’ 0° up for the Solar System, to compare everything else to, whether you wouldn’t be best useing the Solar Systems ‘Direction of travel’ as it orbits the Galaxy?
I have read article after article about sun spots. Honestly, it is one of the things that brought me here to this site a decade ago. From what I have seen, as much as I want there to be, there seems to be little correlation between sun spots and temperatures on earth.
This doesn’t come as a shock to me as it is a secondary driver, not a primary. What I mean by this is that, according to theory, less sunspots are indicative of lower solar activity, meaning more cosmic rays strike the earth. More cosmic rays are supposed to make for more clouds, which makes for less sunlight reaching the surface (read ocean) which slightly decrease the temperature of the earth.
That takes two steps, each one caused by the previous but not interrelated.
Meanwhile TSI is a primary driver. Now TSI does go down slightly in a minimum and up slightly at maximum. My personal theory, for which we have no data so it is only a guess, is that during the Maunder minimum the same forces causing such a long minimum also caused a further drop in TSI. It wouldn’t take much of a drop to greatly affect earth’s temperatures. But that is just a silly guess.
TSI is the primary driver of the baseline situation, but it is unlikely to be the primary driver of climate change, because it is nearly constant, with a change of only about 0.1%. If the Sun is responsible for a significant part of climate change, it is unlikely to be only through changes in TSI. Focusing only on TSI is like refusing to consider any other solar change that might affect climate.
@Javier- it is true that total TSI may only very 0.1% , that is for the total Spectrum from EUV to Far Infrared. The EUV up to Blue Light may vary 6% by itself which is more inclined to warm the oceans, since it penetrates much deeper and carries more energy. This is often overlooked and I don’t understand why.
Sandy, Minister of Future
Yes, spectral variation is quite different from TSI variation.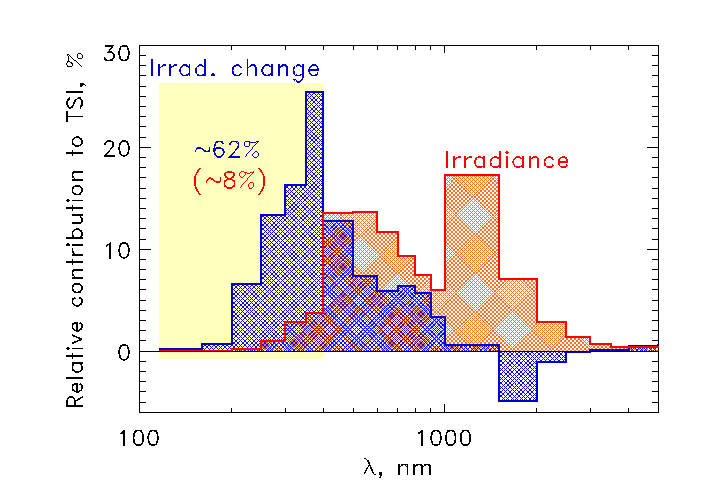
This is Natalie Krivova’s graph on solar spectral irradiation:
What changes with the solar cycle is the lower part of the spectrum. The higher part of the spectrum is actually anti-cyclic.
If you want to disregard a solar effect you choose TSI because that is what shows less variability.
I understand what you are saying Javier, but, as much as I want there to be, I have yet to see any real correlation between sun spots and temperature. Meanwhile, I see a lot of correlation between global temperatures and the ocean cycles, which are affected by changes in temperature of the water.
This is a bit of simplification, and I hope that we can find proof of sun spot activity influencing temperature but as much as I want it to be, we have yet to find the smoking gun.
The problem is probably your initial assumption. Why should there be a correlation between sunspots and temperature? Changes in solar activity should correlate better with changes in temperature (ΔT), not with temperature. And don’t forget that since several things affect temperatures, you should not expect a very high correlation. Just that temperatures do generally move up when there is a long period of above average solar activity, and move down when there is a long period of below average solar activity. That works quite well.
~smoking gun courtesy of Javier
All I can do is stubbornly insist TSI doesn’t tell us everything there is to know about the Sun’s affect on the Earth’s climate. GSN doesn’t tell us everything there is to know about the Sun’s affect on the Earth’s climate. 10.7 cm flux doesn’t tell us everything there is to know about the Sun’s affect… But it has to be the Sun, there is no other source of energy available to our Earth, and you can’t get a change of temperature unless or until you change the amount of energy that reaches the temperature measuring location. And in this case I don’t care about the minor mild difference between a mythical average temperature of today and one calculated in 1930s, I’m talking about the difference between our current productive climate compared to an Ice Age climate that is not only cold but also with greatly reduced precipitation because so much of the moisture is locked up in Ice Sheets.
I like the basis of the Svensmark hypothesis… picture a sphere of solar output around the Sun, forming a sort of bubble (with no definitive boundary but a rapid drop off at its outer limits) of protection that drops off at about the distance of the Earth’s orbit. At higher levels the Earth is completely enveloped by the bubble and gets maximum protection. It would take only a minor decline, that is shrinkage of the bubble, to leave the Earth completely exposed receiving minimum protection. And that’s how a 0.1% reduction of the Sun’s output could produce a much larger swing in temperature (used as a proxy for climate). Now I don’t know what makes up that bubble nor what it protects the Earth from, I leave that to those of you who research such things. But that’s the kind of theory that could fit the facts.
But that’s the kind of theory that could fit the facts.
Except that there isa bubble, but with a boundary at 100 times the distance from the sun to the Earth.
So, your theory does not fit the facts.
Then we’re looking for a different bubble. And since we not only don’t know what we’re looking for, we’re not sure where we lost it, either, so currently we’re gazing around over here under the street lamp cuz that’s where the light is better, hoping we recognize when we see it. The fact there is a bubble, even though it’s the wrong diameter, I think lends credence to the idea, it’s just that we’re looking for something else, at the correct radius. Possible?
Is there somewhere I can easily access solar data? I’m looking for things like sunspot and TSI data, on a monthly basis, as far back as possible. How is TSI known back to 1800? How consistent are these data? How reliable? Thanks… I’m a meteorologist and climatologist… still clueless about astronomy. When I went to school, it seemed mostly irrelevant to my fields of study. Now I wish I knew more.
You might try nasa solar physics which is where the sunspot graphic at the top of the page comes from. (not sure if that’s exactly what you’re looking for)…
If you run a search Silso should come for the sunspot data, and PMOD for TSI data.
http://www.sidc.be/silso/
https://climatedataguide.ucar.edu/climate-data/total-solar-irradiance-tsi-datasets-overview
Mary,
For an on-line starter kit I’ll recommend:
http://www.solen.info/solar/
http://www.sidc.be/silso/ssngraphics
You’ll find lots of charts and graphs. As you follow some of
the links down the rabbit hole, you’ll run into actual sunspot
counts, usually by month, back into the 1750’s.
There’s still a certain uncertainty in how reliable the past is
in predicting future solar activity.
Some folks treat the “old” data as little more than signs and
portents along with the reading of entrails as predictors of what’s
to come.
Good hunting.
Mary, despite the presence of plenty of self-proclaimed solar experts on this page, somehow none of them have the reference handy. Funny how that works … here is the data:
daily spots: http://sidc.be/silso/DATA/SN_d_tot_V2.0.txt
monthly spots: http://sidc.be/silso/DATA/SN_m_tot_V2.0.txt
yearly spots: http://sidc.be/silso/DATA/SN_y_tot_V2.0.txt
group spots: http://www.sidc.be/silso/DATA/GroupNumber/GNbb2_y.txt
TSI is NOT known back to 1800, it is only estimated. The most reliable estimate I know of is
TSI = 1360.5 + (0.0304 * yearly_spots^0.7 + 0.239 *group_spots^0.7)/2
Best regards,
w.
Can the 2 recent Cyclones in the Arabian Sea be attributed to climate cooling or ocean cooling due to a quiet sun?
Sandy, minister of future
Yes, they can. If it is a valid attribution or not is another question. 😉
Absolutely not! It is clearly from localized CO2 output, given the oil comes from there anyway… All climate change has to be attributed to CO2, dontyaknow?
I thought Lief earlier had said we are already in cycle 25, based on the polarity of some of some the spots we have been seeing, and that there is usually an overlap of the cycles. Do I mis-remember?
L-E-I-F
No. But, you mis-remember how to spell Leif! Just think of it like a leaf (on a tree)…
my name is not pronounced as ‘leaf’, but as ‘life’.
We know that Svalgaard. i’m just trying to get ’em to spell it like leaf with the e coming first. (gotta start somewhere)…
yearbut Lie-f produces correct prononsi … pronowns … proneunx …. it makes us say it righter-er.
All the big issues.
WXcycles May 24, 2018 at 2:08 am Edit
Dear heavens, could you get more childish? You can’t fault the man on his science, so you sink to this ugliness? For shame.
w.
No, you don’t ‘mis-remember’. solar cycles do, in fact overlap. Each lasting some 16-17 years. A new one starting some years before the old one slowly peters out. For convenience, an artificial ‘minimum’ can be calculated as the time where the sum of the number of sunspots for the overlapping cycles are at a minimum. One can ague that the influence of sunspots would depend on that sum, but for studying [and forecasting] solar activity each cycle must be treated as a unit.
Think of Leif Erikson, the Norse who discovered North America.
Just the way I discovered New York. It wasn’t important until I got there.
Tell me, How did you find America?
https://youtu.be/X4jW32cQn6k
“Are we headed for a deep solar minimum?” Short answer: certaintly not, the polar fields point to a SC25 similiar to SC24, not as strong as the average but no sign of “Maunder”.
Anthony stated in the article that the new cycle may start this year. (Can’t quote on my phone for some reason). Per another article here posted a couple of weeks ago I had gathered that the new solar cycle had already started as sun spot polarities had changed. Did I misunderstand the previous article? (Highly likely as a lot stuff here doesn’t simply go over my head but is at an altitude I can’t even see it)
I keep repeating: sunspot cycle started in March 2018…
http://gsjournal.net/Science-Journals/Research%20Papers-Astrophysics/Download/7246
The solar flux is again increasing and will keep doing it… We will know for sure in 2 months that march is indeed the low…
Thank you.
The solar flux in April was 70.5 against 70.0 in February
The solar flux in May will be at least 71 against 67.8 in January…
Hot linked Journal! Impact factor?
I have 4 (!) theories for the start of cylcle 25… The other 2 are at an official journal… Don’t say which one, because Leif will want to keep it unpublished!
4 theories… one hit would be enough…
His wrong expectations started with following Skeptical Science’s views. From the rest of David Dickinson’s article: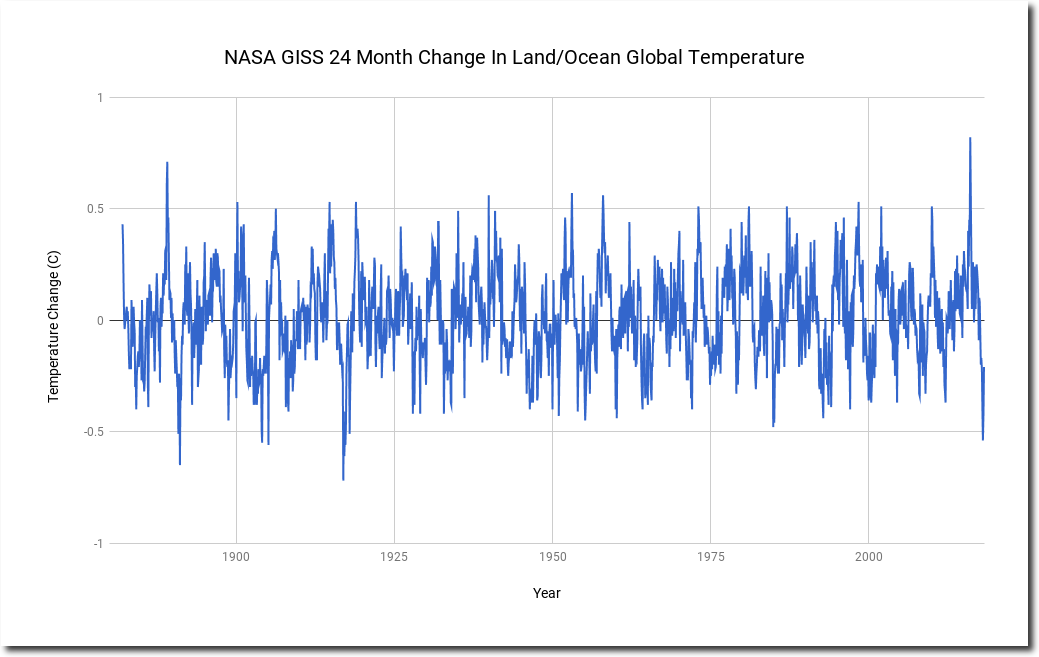
 ?dl=0
?dl=0
Many a climate change-denier will at least concede that the current climate of the Earth is indeed changing, though they’ll question human activity’s role in it. The rather ominous fact is, taking only current solar activity into account, we should be in a cooling trend right now, a signal in the data that anthropogenic climate change is working hard against.
He could have recognized the reality that earth has cooled going into the solar minimum. It’s hard to deny the cooling change so far from the 2016 El Nino peak:
He could have also recognized the cooling change was driven by the drop in TSI:
The problem is Dickinson doesn’t recognize reality.
Bob, I fear that a mere two years of data shows very little and in this case is actively misleading. Here is the scatterplot of UAH MSU (orange in your graph) vs. SORCE TSI (red in your graph):


As you can see, once we look at all the data the correlation falls apart. The TSI data is NOT related to the sea surface temperature.
The same is true for SORCE versus the HadSST sea surface temperature.
And finally, as we might expect, sea surface and lower tropospheric temperatures ARE well correlated, viz:
Sorry, but your claims about the solar connection to SST and lower troposphere temperatures fall apart with a deeper look …
w.
Willis, there is no accounting for the rise and fall of solar cycle TSI-driven ocean heat accumulation-depletion in your plots. SST is a function of TSI powered ocean absorbed solar energy accumulation/depletion over time. ?dl=0
?dl=0
The heat in the atmosphere is a function of heat released by the ocean, per your third figure. The heat in the equatorial ocean is modulated by solar cycle TSI, and overall SST is modulated by equatorial ocean heat content.
Figure 18 with data links from here gives the proper view of the solar cycle effect of TSI-insolation warming-cooling on OHC, SST, and other indices over the four most recent solar cycles. Equatorial ocean heat content accumulation/depletion follows solar cycle TSI-insolation, with the climate following the equatorial ocean:
Looks like I’ll have to make a set of TSI-UAH and OHC-UAH cross correlation plots, ie figures 18.1 & 18.2, to further make this point.
So, Willis, an honest question for clarification. Is the temperature of the lower troposphere a result of SST or is SST a result of lower troposphere temperature? It appears that the heating of the top ocean layer by the sun is what regulates our temperatures on this planet.
If SST is not related to TSI, then what heats up the ocean? Honestly? What other options are out there?
Andrew Cooke May 23, 2018 at 12:20 pm
Andrew, the ocean temperature is increased by two sources of energy:
1) absorbed downwelling solar radiation
2) absorbed downwelling longwave radiation
However, this is far from the complete picture. The amount of downwelling solar radiation that gets absorbed is affected by such things as clouds and wind. The amount of downwelling longwave radiation is affected by clouds and total precipitable water.
And this is only one side of the equation, the gains. The ocean loses energy in a number of ways, including radiation, conduction/convection, and evaporation. These in turn are affected by wind speed and temperature. Finally, thunderstorms act as giant refrigeration units delivering cold air and cold water to the ocean surface. Also, surface temperature is a function of the rate of overturning of the “mixed layer”, which in turn depends on winds and the balance between solar and longwave radiation.
So it is nowhere near as simple as “it’s the sun” …
Finally, the usual claim is that the ocean temperature or other surface variables (sea level, air temperature, etc) are affected by the changes in solar output (TSI, EUV, magnetic fields) related to the ~11-year sunspot cycle. I’ve never found any solid evidence for that.
Best regards,
w.
the usual claim is that the ocean temperature or other surface variables (sea level, air temperature, etc) are affected by the changes in solar output (TSI, EUV, magnetic fields) related to the ~11-year sunspot cycle. I’ve never found any solid evidence for that.
By visual examination alone, the statistical significance of so many highly correlated indices for 37 years (the length of the CDR TSI record I used in my Figure 18 above), as all the climate indices are with solar cycle TSI (dark red), and obviously with each other, can be estimated to be in the .95-.995 range. TSI is highly significant to climate.
The only way you can deny this is to block it out.
Notice I’m not denying you and your thunderstorms, because they’re all there in with the ocean, precipitation, and water vapor CC plots with TSI (each plot is for 12 years) in figure 18. 😉
This must be demonstrated experimentally: Hypothesis – downwelling infrared radiation of the frequencies expected from Carbon Dioxide molecules ‘increases the temperature’ of the oceans.
Precisely the opposite should happen as evaporation would be increased and the surface of the oceans would get cooler due to the loss of latent heat of evaporation.
Nobody will attempt this extremely simple experiment of course as to do so would result in falsification of ‘global warming’. As 75% plus of the Earth’s surface would be cooled by downwelling radiation not heated by it and the evaporated water vapor would convect up and release the latent heat higher in the atmosphere as it changes state to water then ice. As you repeatedly point out Willis.
“thunderstorms act as giant refrigeration units delivering cold air and cold water to the ocean surface.”
Refrigeration is not an accurate description of the process. Cooling tower is more like it. Refrigerators are a heat pump. They transfer heat from cooler body to warmer body thus violating the 2nd law of thermodynamics by doing work. The work is done by the compressor. Cooling towers obey the 2nd law by transferring heat from warm water to cooler atmosphere by evaporation and convection. Much like thunderstorms
Dr. Strangelove May 24, 2018 at 4:42 am
Thanks, Doc. As a man who has actually built refrigeration units from the component parts, I can assure you that thunderstorms are indeed operating on the same cycle as your household refrigerator.
A refrigerator uses a “working fluid”. The working fluid evaporates in the area to be cooled, say the inside of your home refrigerator. The evaporation cools that area.
Then the working fluid, now in the form of a vapor, is moved to another location, where it is cooled until the fluid condenses. Finally, the working fluid is returned to where it started, completing the cycle. The power is provided by electricity.
Note that this is precisely what happens in a thunderstorm. The working fluid is water. It evaporates at the surface, cooling that area. Then the water vapor is moved to the troposphere, where it is cooled until it condenses and is returned to the surface where it started in the form of rain … just as is happening in your household refrigerator, except the power is provided by the sun.
You seem to be under the misimpression that thunderstorms do no work, when in fact they are giant heat engines … let me recommend once again my post on this subject, “Refrigerating Nairobi, Air-Conditioning The Planet“, wherein I discuss this question in detail.
Best wishes,
w.
Bob Weber May 23, 2018 at 1:30 pm Edit
Grrrr … I wrote a long answer and lost it … start over …
Bob, the problem is that when you use a cross-correlation function with a highly cyclical dataset like say sunspots, you will get what appear to be correlations even with random red noise. Here, for example, is the correlation of sunspots with fractional Gaussian noise:
As you can see, this sure looks like there is a correlation. The blue line shows the correlation that would normally have to be exceeded in order to be considered significant … but this is just random noise.
And as a result, you cannot determine if the results are significant “by visual examination alone” as you say. The only way to do it is by the Monte Carlo method. Generate say a thousand examples of fractional Gaussian noise with a Hurst exponent equal to that of your target dataset. Then run your cross-correlation on all of them, and calculate the level of maximum correlation that is only exceeded by 5% of your examples. That’s the level you need to exceed to have significance at the p-value = 0.05 level.
And even that may not be enough. Try, for example, doing a cross-correlation between sunspots and a waveform consisting of a single pulse (e.g. something like 0,0,0,0,0,0,0,1,1,1,1,0,0,0,0,0,0,0). You’ll get a whacking great correlation … but it is meaningless.
Finally, you say:
Mmmm … you might want to dial it back a bit until you have a better grasp of the statistical problems you face …
Best to you,
w.
Willis that’s an interesting non-sequitar but as I see it the CC plots speak loudly and clearly.
No reason to dial anything back.
Willis
As a mechanical engineer too, yes thunderstorms are a heat engine. That’s why they are not a refrigerator. The refrigerator is a heat pump, the opposite of heat engine. In heat engines, heat flows from hot to cold body and you get work output. In heat pumps, you input work to make heat flow from cold to hot body. That’s why the name “heat pump.” Copied from water pump. Water flows from high elevation to low elevation by law of gravity. Water pump reverses the flow from low elevation to high elevation by doing work (pumping).
Heat flows from high temperature to low temperature by 2nd law of thermodynamics. Heat pump reverses the flow from low temperature to high temperature by doing work (gas compression). Inside the ref is cold because heat is continuously being “pumped” outside the ref where temperature is hotter. Thunderstorm is not a refrigerator because heat flows from high temperature (surface) to low temperature (high altitude) and you get work output (increase in potential energy of rising warm air). It is a heat engine. Cooling tower is also a heat engine.
To complete the analogy, a water wheel is analogous to heat engine. Water flow from high elevation to low elevation and you get work output (spinning wheel). Steam turbine is of course a heat engine. Heat flow from high temperature (boiler) to low temperature (condenser) and you get work output (spinning turbine)
https://tallbloke.wordpress.com/2015/10/26/solar-activity-levels-vs-surface-temperature-variation/
Bob data that is supportive of what you propose which I am on board with.
It is happening now as we speak.
Willis, as an engineer when doing process control I look at underlying causes. Sometimes, when I make the mistake of looking for direct correlation I miss the true underlying cause, usually because it is hidden by a feedback loop or multiple causes that appear to be larger but really aren’t.
So I look at this as a system. There is a primary source of all heat on this planet. It is the sun. Non-negotiable. Turn off the sun, and we freeze solid like Europa. From what I see, the engineer’s viewpoint, this is the primary driver of heat. Everything else is secondary, because if the sun were to turn off tomorrow, all those processes would also stop. If anything else stops, the sun is still delivering its heat.
Like any other system that relies on a primary driver, if that primary driver provides less or more, the secondary processes also provide less or more, although this may be in the form of a feedback and so actually go in the opposite direction, i.e. sun radiates more heat, ocean’s evaporate more, more clouds form.
The data won’t always show the correlation back to the primary driver because it is hidden by the multiple upon multiple feedbacks and accelerants in the system. I’m not saying your wrong, I’m just saying that the interpretation of data is not always right and you have to peel back the layers of the onion to get to the right information.
But then, I could be wrong.
In March it was 67.58
Knock-out for Leif is approaching!
I’m only interested in how this low sunspot count will or may affect the weather, which affects crop and livestock production (chickens are livestock), and also affects my monthly household expenses.
These are practical matters, since our weather is a seasonal affair. You can argue solar physics all you want, but if you get down to the nitty gritty of it, it’s whether or not you will have to buy extras of everything because of early winters and late springs (weather), or how much it’s going to bump up your heating (gas) bill.
I’m still running the furnace, but to the areas 35 miles south of me, the weather is more close seasonal averages. However, in many areas crop planting is late owing to colder than ‘normal’ weather. The hardware store did not put out plants for sale until last week. Too cold.
I have yet to see anything much in the way of bugs, period. This has also happened repeatedly over the last five years, but it gets later every year.
These are symptoms of a change that is more subtle than a lack of sunspots. If it’s going to be for a very long time, we need to prepare for it now, not at the last minute.
(P.S.: it might just zip the lips of the ecohippies and CAGWers, etc., if we went into a LIA, so I’m not grumbling about it. Anything that takes them by surprise makes me happy.)
Sara
lf you live in the NE corner of the USA, then recent jet stream activity suggests cold and early starts to the winter along the spring snow lasting longer into the season. During the summer big swings in temps and the weather look likely.
taxed – the notable winters in your area and, for the same reason, the whole Eastern US have resulted from a shift in the storm track and even the high-level pattern. What caused this? It’s a very slight effect in the global Rossby wave pattern. A delayed effect of the warm sun? Insufficient outflow due to GHGs?
Your winters will probably continue to be like this. In a complicated sequence the decreasing temperature gradient toward the north has been allowing cold core low circulations with their very cold air to invade the Eastern US and Western Europe. This mechanism begins to develop after the December solstice and it becomes recognizable by the end of January. It doesn’t get washed out by the returning sun until late April. It’s very interesting if this is what’s really going on..
…It’s interesting for meteorologists, because it involves the Arctic Jet and Polar Jet and the role of high-pressure systems in the Arctic and SSWs.
l have taken a interest in the global jet stream and its role in climate change since about 2012.
As l have always believed it was a key factor in climate change and ice age formation.
lts now looking like that increased jet stream activity in the Arctic is a climate game changer for the NH.
Because with this increased activity in the Arctic there is a increase in Polar air pushing down across the land masses of N America and NW Russia. Just like what happened during the ice age.
Yes l agree changes in jet stream activity in the Arctic is a climate changer.
Because weather the jet stream is pushing up into the Arctic over the Atlantic ,Pacific or NE Russia.
Polar air most often gets pushed down across N America and/or NW area of Russia. Just like what seemed to happened during the ice age.
It is interesting that the warm(er) Alaska and the very cold East Coast matches the pattern of the Laurentide Ice Sheet.
I’m in the upper Midwest, the Great Lakes region. Late spring, with snows up to 3rd week of April (photos recording this) and birds not finding food resources are weather signs in the short term. In the long term, they signify other responses.
Another sign that is telling me something is off kilter is that the robins, which are generally rather fat, are skinny this spring and having trouble finding food for their broods.
What we are getting up here is a dip of cold air from up North. When I’ve checked the MODIS images, e.g., last week, the snowfields showed no sign of meltback in northern Canada below Hudson’s Bay.
If we’re due for a Maunder Minimum – and I do recall NASA’s concerns re: that very thing, during the 18-month lapse of solar activity from 2005 to 2006 – it can also be punctuated by a return to “normal” solar activity that ends too soon.
I take nothing for granted any more.
But as I said, if it silences the ecohippies and their ilk, it’s fine with me.
Where the change that is taking place that will effect the Great Lakes area ls the increase in jet stream activity in the Arctic.lts the main reason for the cold in that area this spring.
This years weather has now convinced me that increased jet stream activity in the Arctic is a climate game changer for the NH. Because when this happens NE N America and NW Russia are the areas that get hit hardest by cold air pushing southwards. l now believe its this change in the jet stream patterning along with orbit change that is the trigger for ice age formation in the NH.
Sara,
I think you are talking “weather.”
Old men used to go to town, sit in front of the general store, play checkers, smoke, and talk weather. In winter they would go inside by the stove.
Not saying you are an old man!
Anyway, our US NWS posts charts that can be used to check how this year’s weather compares to previous year’s.
Below is the link to the nearest big town to where I live. I do not see any pattern that one could claim as “climate change” versus “weather.”
Further, I’ve got garden plants growning, flowers blooming [tulips-done; iris-now in full bloom], strawberries doing well; little green cherries on the trees, and so on. Other trees and plants – natives – are all doing as expected. Nice year, so far.
Yakima graphs
John,
Weather is what climate is made from, and thus must always have an effect on what climate will be when the sums are done at the end of the arbitrary period of choice.
Climate is arbitrary and abstract, weather is not.
GOES-16/EAST Loop of the Day:
It’s the coldest and snowiest April on record near the Great Lakes, and residents are ‘fuming’
-WaPo April 18, 2018
The Midwest and Great Lakes just endured a historically cold April
-WaPo, May 1, 2018
2018-05-17 – One month away from the summer solstice and the Northwest Territories and Nunavut are still mostly snow-covered. HTML5 loop
Sara, sunspot cycle 25 will rapidly increase in strength… I will write an extra paper on that one… So no Maunder minimum yet!
Okay, I will watch for that.
I checked the NASA SOHO website for the current spots this morning. There were two, VERY small in size, nearly invisible.
I will be watching the skies for ice dropping out of cirrus clouds in July and August. I’ve seen that before, every year going back to 2005 when this spotless cycles grouping started.
No one knows what the sun is going to do or not do.
No one knows how long solar cycle 24 is going to be and no one knows how deep this minimum will be, meaning how long will the solar flux stay at 90 or less. I do not care about sunspot numbers per say.
With that said, it seems like an uptick is taking place with solar cycle activity now which lends evidence that this cycle is not ending anytime soon.
I have maintained for years now which many have not paid attention to , that in order to have solar exert a climatic impact that is more significant two conditions must be present.
CONDITION NUMBER 10+ YEARS OF SUB – SOLAR ACTIVITY IN GENERAL.
Which is now satisfied since sub solar activity in general has been
occurring since late 2005. That proceeded by extremely active solar
conditions for several decades, the modern maximum.
CONDITION NUMBER 2 – Within the sub -solar activity in general low average value solar parameters
must be meant and sustained for a period of time. Those solar parameters having values equal to or lower than the solar values that take place in typical solar minimums within the so called 11 year sunspot cycle, and longer in duration.
It looks like this is now occurring. Year 2018 being the first year where it looks like my 2 conditions for global cooling due to solar activity is taking place. This is why I am confident to say this year is a transitional year in the climate and no further global warming is going to take place starting with this year and moving forward.
Thus far I would say the climatic trends are looking pretty good(this year) with global temperatures now running lower according to satellite data then a year ago thru this time, with overall sea surface temperatures cooling not to mention the North Atlantic in particular which is undergoing extensive cooling and is a very important area in the global climate picture. Also with the atmospheric circulation being less zonal.
The other area is what is happening with the geo magnetic field in regards to it’s strength and orientation which when in sync with solar activity will compound given solar effects. In this case they are both weakening.
The upshot of this is overall sea surface temperatures should drop and a slight uptick in albedo is probably going to happen due to an increase in global cloud coverage, snow coverage and an uptick in explosive major volcanic activity. My opinion.
If one looks at the climatic history objectively it is clear that every prolonged solar minimum results in global cooing without exception. THOSE ARE THE FACTS NOT MY OPINION.
Finally people are stuck on the false concept that the climate is going to change slowly and gradually which is false . That only being true when the climate is locked in a specific climate regime which had been the case after we came out of the Little Ice Age to present.
This may now be changing in my opinion.
@goldminor said- Something has caused the surface wind patterns to undergo an obvious shift in patterns around 24 months ago.
Indeed it has. The last bottom was 1430 CE, 160 more yrs to peak. This excerpt from Javier …
https://judithcurry.com/2017/09/15/nature-unbound-v-the-elusive-1500-year-holocene-cycle/#more-23393
The 1500-year climate cycle is the millennial cycle whose peak effect is scheduled to take place next, at ~ 2180 AD. What should we reasonably expect from such cyclic occurrence?
If our knowledge of the cycle is correct we should see …
1. Bigger tides and an increase in storm flooding events.
2. There should be an increase in Arctic sea ice and iceberg activity.
3. We should also see an *increase in zonal wind circulation and associated precipitation changes.
Most of the effects could be smaller than in previous instances of the cycle if global temperatures continue at the current level or increase in the next 150 years.
( my note- if temps drop due to quiet sun, effects could be larger)
Any decrease in Northern Hemisphere surface temperatures caused by the cycle should be limited, and global average temperatures should not be reduced by much, probably not more than 0.2°C, as suggested by the standard deviation in a global reconstruction where its effect cannot be detected (Marcott et al., 2013; figure 37).
Sandy, Minister of Future
Sandy, Salvatore – On Accuweather’s “news” articles, they have determined that Arctic ice is going decrease due to global warming.
They aren’t very good at making weather forecasts beyond a 3-day period, so I view their prediction with a jaundiced eye.
I have photos of a late-day sundog with ice streaming eastward out of it, just souith of me, so I’m inclined to only record what actually happens. Any forecasts by other people will probably be more accurate.