Guest Post by Willis Eschenbach
Last week, Anthony highlighted a study by Svensmark, Shaviv et al. in a post entitled New paper: The missing link between cosmic rays, clouds, and climate change on Earth. While some were enthusiastic about their claims, Leif Svalgaard and I were much more restrained in our opinions.
As a result, I was interested in an analysis of the Svensmark et al. paper by Ari Jokimäki over at his always interesting blog, The AGW Observer. I’ve shamelessly stolen his text and graphics, which I reproduce below. I trust Ari won’t mind since I’ve quoted him in full and provided the links to his website.
Some curious things about Svensmark et al. reference list
Posted by Ari Jokimäki on December 22, 2017
The hypothesis of significant effect of cosmic-rays to climate has been shown wrong many times. This is a pet hypothesis of Henrik Svensmark, who continues to push papers on the subject to scientific journals. A few days ago, the journal Nature Communications published a paper of Svensmark (& co-workers). I checked out its reference list because I think that some indicators of the quality of a paper can be found simply by checking the reference list, and how references are used.
S17 reference list – first impressionsI immediately noticed a few things about S17 reference list. I made some tweets (@AGWobserver) where I mention them:
The Kulmala et al. paper I mention there is this one: “Atmospheric data over a solar cycle: no connection between galactic cosmic rays and new particle formation”. It shows results against Svensmark’s hypothesis, but it is not cited by S17. The mentioned paper list in my tweets is this one: “Papers on the non-significant role of cosmic rays in climate”.
One Kulmala team paper S17 cites is “Detecting charging state of ultra-fine particles: instrumental development and ambient measurements” (Laakso et al. 2007). S17 uses it in this context: “Cosmic rays are the main producers of ions in Earth’s lower atmosphere21.” (21 is the S17 reference list number for the Laakso et al. paper.) This is strange because Laakso et al. don’t say anything about cosmic rays. Cosmic rays are mentioned only in their reference list in the title of Eichkorn et al. (2002) paper, and Laakso et al. refer to it in this context: “Ion mass spectrometers have been used successfully in the studies of new particle formation in the upper atmosphere (Eichkorn et al., 2002).” Furthermore, as Svensmark’s cosmic ray hypothesis relies on ion induced nucleation, it is noteworthy that one of Laakso et al. conclusions is this: “During a large fraction of days considered here, the contribution of ion-induced nucleation to the total nucleation rate was either negligible or relatively small.” To me it seems that either S17 is citing a wrong paper here, or then the cosmic ray ion production thing is implicitly in Laakso et al. results and I just don’t see it.
S17 reference list – comparison with other paper
I decided to look S17 reference list further. I chose a comparison paper, Gordon et al. (2017, “G17”), which is a research paper on the same issue than S17. Both papers have been published and submitted to their journals during 2017, S17 in May 10 and G17 in March 24, so S17 is a bit newer in that sense. S17 was published in December 19 and G17 in August 24, so also in that sense S17 is newer. I emphasize newer here because it suggests that references in S17 reference list should be as new or newer as references in G17 reference list.
The reference list of S17 contains 39 entries while the reference list of G17 contains 85 entries. As the papers are on the same subject, it seems that S17 reference list is a little short. However, scope of G17 seems to be somewhat broader, so reference list length doesn’t necessarily tell anything.
I also compared the temporal distributions of papers in the reference lists of these two papers. Result can be seen in this graph:
It is quite clear from the graph that S17 reference list focuses on older papers than G17 reference list. highest peak of temporal distribution of S17 is 2005-2009, while corresponding highest peak of G17 is 2010-2014. Also, G17 distribution is rather sharply concentrated on the more recent times, while S17 distribution is more spread out in time, and it almost seems as if the most recent research is being avoided in S17 reference list (the share of 2015-2017 papers is very low in S17 compared to G17).


[UPDATE]: An alert reader in the comments notes that he has retracted his claim about the one reference, viz:
(Note added December 27, 2017: This paragraph is incorrect – S17 cites two Laakso et al. papers and I somehow got them mixed.) One Kulmala team paper S17 cites is “Detecting charging state of ultra-fine particles: instrumental development and ambient measurements” (Laakso et al. 2007). S17 uses it in this context: “Cosmic rays are the main producers of ions in Earth’s lower atmosphere21.” (21 is the S17 reference list number for the Laakso et al. paper.) This is strange because Laakso et al. don’t say anything about cosmic rays. Cosmic rays are mentioned only in their reference list in the title of Eichkorn et al. (2002) paper, and Laakso et al. refer to it in this context: “Ion mass spectrometers have been used successfully in the studies of new particle formation in the upper atmosphere (Eichkorn et al., 2002).” Furthermore, as Svensmark’s cosmic ray hypothesis relies on ion induced nucleation, it is noteworthy that one of Laakso et al. conclusions is this: “During a large fraction of days considered here, the contribution of ion-induced nucleation to the total nucleation rate was either negligible or relatively small.” To me it seems that either S17 is citing a wrong paper here, or then the cosmic ray ion production thing is implicitly in Laakso et al. results and I just don’t see it.
I love seeing this, that when a mistake is made it is acknowledged and clearly corrected. His second point still stands … as does his point about Laakso saying that “During a large fraction of days considered here, the contribution of ion-induced nucleation to the total nucleation rate was either negligible or relatively small.”
[END UPDATE]
Short and filled with information, typical of Ari’s good work … you can go to the post to see the (3) comments, part of the reason I thought it deserved wider circulation. In addition, I’ve grabbed and reposted below the list of papers that he linked to above that show no effect of cosmic rays on the climate. In that regard, my own research agrees with those papers, although I went about it a different way. I looked for the signature of the ~ 11-year cycles in sunspots. This, of course, would detect such an influence whether or not it was from cosmic rays. Here’s Ari’s list:
Papers on the non-significant role of cosmic rays in climate
Posted by Ari Jokimäki on August 31, 2009
This list contains papers which show that cosmic rays don’t have significant role in recent climate change, so this list doesn’t contain the papers from Svensmark et al. or other papers symphatetic to the strong role for cosmic rays, but such papers and issues are discussed in papers below (see also Anti-AGW papers debunked section for some Svensmark et al. papers). The list is not complete, and will most likely be updated in the future in order to make it more thorough and more representative.
LATEST UPDATE (December 25, 2012): Laken et al. (2012) added.
A cosmic ray-climate link and cloud observations – Laken et al. (2012) “Despite over 35 years of constant satellite-based measurements of cloud, reliable evidence of a long-hypothesized link between changes in solar activity and Earth’s cloud cover remains elusive. This work examines evidence of a cosmic ray cloud link from a range of sources, including satellite-based cloud measurements and long-term ground-based climatological measurements. The satellite-based studies can be divided into two categories: (1) monthly to decadal timescale analysis and (2) daily timescale epoch-superpositional (composite) analysis. The latter analyses frequently focus on sudden high-magnitude reductions in the cosmic ray flux known as Forbush decrease events. At present, two long-term independent global satellite cloud datasets are available (ISCCP and MODIS). Although the differences between them are considerable, neither shows evidence of a solar-cloud link at either long or short timescales. Furthermore, reports of observed correlations between solar activity and cloud over the 1983–1995 period are attributed to the chance agreement between solar changes and artificially induced cloud trends. It is possible that the satellite cloud datasets and analysis methods may simply be too insensitive to detect a small solar signal. Evidence from ground-based studies suggests that some weak but statistically significant cosmic ray-cloud relationships may exist at regional scales, involving mechanisms related to the global electric circuit. However, a poor understanding of these mechanisms and their effects on cloud makes the net impacts of such links uncertain. Regardless of this, it is clear that there is no robust evidence of a widespread link between the cosmic ray flux and clouds.” Benjamin A. Laken, Enric Pallé, Jaša Čalogović and Eimear M. Dunne, J. Space Weather Space Clim. 2 (2012) A18, DOI: http://dx.doi.org/10.1051/swsc/2012018. [http://www.swsc-journal.org/articles/swsc/pdf/2012/01/swsc120049.pdf”>Full text]
Solar irradiance, cosmic rays and cloudiness over daily timescales – Laken & Čalogović (2011) “Although over centennial and greater timescales solar variability may be one of the most influential climate forcing agents, the extent to which solar activity influences climate over shorter time periods is poorly understood. If a link exists between solar activity and climate, it is likely via a mechanism connected to one (or a combination) of the following parameters: total solar irradiance (TSI), ultraviolet (UV) spectral irradiance, or the galactic cosmic ray (GCR) flux. We present an analysis based around a superposed epoch (composite) approach focusing on the largest TSI increases and decreases (the latter occurring in both the presence and absence of appreciable GCR reductions) over daily timescales. Using these composites we test for the presence of a robust link between solar activity and cloud cover over large areas of the globe using rigorous statistical techniques. We find no evidence that widespread variations in cloud cover at any tropospheric level are significantly associated with changes in the TSI, GCR or UV flux, and further conclude that TSI or UV changes occurring during reductions in the GCR flux are not masking a solar-cloud response. However, we note the detectability of any potential links is strongly constrained by cloud variability.” Laken, B. A. and J. Čalogović(2011), Geophys. Res. Lett., 38, L24811, doi:10.1029/2011GL049764. [Full text]
Relationship of Lower Troposphere Cloud Cover and Cosmic Rays: An Updated Perspective – Agee et al. (2011) “An updated assessment has been made of the proposed hypothesis that “galactic cosmic rays (GCRs) are positively correlated with lower troposphere global cloudiness.” A brief review of the many conflicting studies that attempt to prove or disprove this hypothesis is also presented. It has been determined in this assessment that the recent extended quiet period (QP) between solar cycles 23–24 has led to a record high level of GCRs, which in turn has been accompanied by a record low level of lower troposphere global cloudiness. This represents a possible observational disconnect, and the update presented here continues to support the need for further research on the GCR-Cloud hypothesis and its possible role in the science of climate change.” Ernest M. Agee, Kandace Kiefer and Emily Cornett, Journal of Climate 2011, doi: 10.1175/JCLI-D-11-00169.1.
The contribution of cosmic rays to global warming – Sloan & Wolfendale (2011) “A search has been made for a contribution of the changing cosmic ray intensity to the global warming observed in the last century. The cosmic ray intensity shows a strong 11 year cycle due to solar modulation and the overall rate has decreased since 1900. These changes in cosmic ray intensity are compared to those of the mean global surface temperature to attempt to quantify any link between the two. It is shown that, if such a link exists, the changing cosmic ray intensity contributes less than 8% to the increase in the mean global surface temperature observed since 1900.” T. Sloan and A.W. Wolfendale, Journal of Atmospheric and Solar-Terrestrial Physics, doi:10.1016/j.jastp.2011.07.013. [Full text]
Cosmic ray effects on cloud cover and their relevance to climate change – Erlykin et al. (2011)“A survey is made of the evidence for and against the hypothesis that cosmic rays influence cloud cover. The analysis is made principally for the troposphere. It is concluded that for the troposphere there is only a very small overall value for the fraction of cloud attributable to cosmic rays (CR); if there is linearity between CR change and cloud change, the value is probably ~1% for clouds below ~6.5km, but less overall. The apparently higher value for low cloud is an artifact. The contribution of CR to ’climate change’ is quite negligible.” A.D. Erlykin, B.A. Laken and A.W. Wolfendale, Journal of Atmospheric and Solar-Terrestrial Physics, doi:10.1016/j.jastp.2011.03.001.
Cosmic rays and global warming – Erlykin et al. (2010) A brief review article. “Is global warming man made or is it caused by the effects of solar activity on cosmic rays as claimed by some? Here we describe our search for evidence to distinguish between these claims. … In our view the jury is back and the verdict is that cosmic rays and solar irradiance are not guilty for most of the Global Warming. Nevertheless, they could be responsible for a contribution and we look forward to future experiments such as CLOUD at CERN which should be able to quantify to what extent ionization plays a part in the production of aerosols, the precursors of cloud formation.”[Full text]
Sudden Cosmic Ray Decreases: No Change of Global Cloud Cover – Calogovic et al. (2010)“Here we report on an alternative and stringent test of the CRC-hypothesis by searching for a possible influence of sudden GCR decreases (so-called Forbush decreases) on clouds. We find no response of global cloud cover to Forbush decreases at any altitude and latitude.”[Full text]
Cosmic ray decreases and changes in the liquid water cloud fraction over the oceans – Laken et al. (2009)“Svensmark et al. (2009) have recently claimed that strong galactic cosmic ray (GCR) decreases during ‘Forbush Decrease (FD) events’ are followed by decreases in both the global liquid water cloud fraction (LCF) and other closely correlated atmospheric parameters. To test the validity of these findings we have concentrated on just one property, the MODIS LCF and examined two aspects: 1) The statistical chance that the decrease observed in the LCF is abnormal. 2) The likelihood of the observed delay (∼5 to 9 days) being physically connected to the FD events. On both counts we conclude that LCF variations are unrelated to FD events: Both the pattern and timing of observed LCF changes are irreconcilable with current theoretical pathways. Additionally, a zonal analysis of LCF variations also offers no support to the claimed relationship, as the observed anomaly is not found to vary latitudinally in conjunction with cosmic ray intensity.”[Full text]
Results from the CERN pilot CLOUD experiment – Duplissy et al. (2009)“During a 4-week run in October–November 2006, a pilot experiment was performed at the CERN Proton Synchrotron in preparation for the CLOUD1 experiment, whose aim is to study the possible influence of cosmic rays on clouds. … Overall, the exploratory measurements provide suggestive evidence for ion-induced nucleation or ion-ion recombination as sources of aerosol particles. … In conclusion, therefore, the experimental variables were not well enough controlled to exclude the presence of ion-induced nucleation on the basis of Fig. 7; it merely does not support the presence of strong contributions from this source.”[Full text]
On the correlation between cosmic ray intensity and cloud cover – Erlykin et al. (2009)“Various aspects of the connection between cloud cover (CC) and cosmic rays (CR) are analyzed. Most features of this connection viz. an altitude dependence of the absolute values of CC and CR intensity, no evidence for the correlation between the ionization of the atmosphere and cloudiness, the absence of correlations in short-term low cloud cover (LCC) and CR variations indicate that there is no direct causal connection between LCC and CR in spite of the evident long-term correlation between them. … The most significant argument against causal connection of CR and LCC is the anticorrelation between LCC and the medium cloud cover (MCC).”[Full text]
Atmospheric data over a solar cycle: no connection between galactic cosmic rays and new particle formation – Kulmala et al. (2009)“More than a decade ago, variations in galactic cosmic rays were suggested to closely correlate with variations in atmospheric cloud cover and therefore constitute a driving force behind aerosol-cloud-climate interactions. Later, the enhancement of atmospheric aerosol particle formation by ions generated from cosmic rays was proposed as a physical mechanism explaining this correlation. Here, we report unique observations on atmospheric aerosol formation based on measurements at the SMEAR II station, Finland, over a solar cycle (years 1996–2008) that shed new light on these presumed relationships. Our analysis shows that none of the quantities related to aerosol formation correlates with the cosmic ray-induced ionisation intensity (CRII). We also examined the contribution of ions to new particle formation on the basis of novel ground-based and airborne observations. A consistent result is that ion-induced formation contributes typically less than 10% to the number of new particles, which would explain the missing correlation between CRII and aerosol formation.”[Full text]
Can cosmic rays affect cloud condensation nuclei by altering new particle formation rates? – Pierce & Adams (2009)“In this paper, we present the first calculations of the magnitude of the ion-aerosol clear-air mechanism using a general circulation model with online aerosol microphysics. In our simulations, changes in CCN from changes in cosmic rays during a solar cycle are two orders of magnitude too small to account for the observed changes in cloud properties; consequently, we conclude that the hypothesized effect is too small to play a significant role in current climate change.”
On the possible connection between cosmic rays and clouds – Erlykin et al. (2009)“Various aspects of the connection between cloud cover (CC) and cosmic rays (CR) are analysed. We argue that the anticorrelation between the temporal behaviour of low (LCC) and middle (MCC) clouds evidences against causal connection between them and CR. Nevertheless, if a part of low clouds (LCC) is connected and varies with CR, then its most likely value averaged over the Globe should not exceed 20% at the two standard deviation level.”[Full text]
Solar activity and the mean global temperature – Erlykin et al. (2009) This study finds that the changes in the cosmic ray rate lags the changes in temperature. “The cyclic variation in the cosmic ray rate is observed to be delayed by 2–4 years relative to the temperature, the solar irradiance and daily sun spot variations suggesting that the origin of the correlation is more likely to be direct solar activity than cosmic rays. Assuming that the correlation is caused by such solar activity, we deduce that the maximum recent increase in the mean surface temperature of the Earth which can be ascribed to this activity is ~<14% of the observed global warming.”[Full text]
Cosmic rays, cloud condensation nuclei and clouds – a reassessment using MODIS data – Kristjánsson et al. (2008)“Averaging the results from the 22 Forbush decrease events that were considered, no statistically significant correlations were found between any of the four cloud parameters and GCR, when autocorrelations were taken into account.”[Full text]
Testing the proposed causal link between cosmic rays and cloud cover – Sloan & Wolfendale (2008)“A decrease in the globally averaged low level cloud cover, deduced from the ISCCP infrared data, as the cosmic ray intensity decreased during the solar cycle 22 was observed by two groups. The groups went on to hypothesize that the decrease in ionization due to cosmic rays causes the decrease in cloud cover, thereby explaining a large part of the currently observed global warming. We have examined this hypothesis to look for evidence to corroborate it. None has been found and so our conclusions are to doubt it. From the absence of corroborative evidence, we estimate that less than 23%, at the 95% confidence level, of the 11 year cycle change in the globally averaged cloud cover observed in solar cycle 22 is due to the change in the rate of ionization from the solar modulation of cosmic rays. “[Full text]
Cosmic Rays and The Climate – Sloan (2008) Summarizes different views on the issue. “A number of papers and posters were presented at the ECRS on the subject of the relationship between cosmic rays (CR) and both the climate and the weather. I was asked by the organisers to attempt to summarise them.”[Full text]
Cosmic Rays and Global Warming – Sloan & Wolfendale (2007)“It has been claimed by others that observed temporal correlations of terrestrial cloud cover with `the cosmic ray intensity’ are causal. The possibility arises, therefore, of a connection between cosmic rays and Global Warming. If true, the implications would be very great. We have examined this claim to look for evidence to corroborate it. So far we have not found any and so our tentative conclusions are to doubt it. Such correlations as appear are more likely to be due to the small variations in solar irradiance, which, of course, correlate with cosmic rays. We estimate that less than 15% of the 11-year cycle warming variations are due to cosmic rays and less than 2% of the warming over the last 35 years is due to this cause.”[Full text]
Solar activity, cosmic rays, clouds and climate – an update – Kristjánsson et al. (2004)“Eighteen years of monthly averaged low cloud cover data from the International Satellite Cloud Climatology Project are correlated with both total solar irradiance and galactic cosmic ray flux from neutron monitors. When globally averaged low cloud cover is considered, consistently higher correlations (but with opposite sign) are found between low cloud variations and solar irradiance variations than between variations in cosmic ray flux and low cloud cover.”[Full text]
Pattern of Strange Errors Plagues Solar Activity and Terrestrial Climate Data – Damon & Laut (2004)“Links have been made between cosmic rays and cloud cover, first total cloud cover and then only low clouds, and between solar cycle lengths and northern hemisphere land temperatures. … Analysis of a number of published graphs that have played a major role in these debates and that have been claimed to support solar hypotheses shows that the apparent strong correlations displayed on these graphs have been obtained by incorrect handling of the physical data.”[Full text]
Solar activity and terrestrial climate: an analysis of some purported correlations – Laut (2003)“The last decade has seen a revival of various hypotheses claiming a strong correlation between solar activity and a number of terrestrial climate parameters: Links between cosmic rays and cloud cover, first total cloud cover and then only low clouds, and between solar cycle lengths and Northern Hemisphere land temperatures. These hypotheses play an important role in the scientific as well as in the public debate about the possibility or reality of a man-made global climate change. I have analyzed a number of published graphs which have played a major role in these debates and which have been claimed to support solar hypotheses. My analyses show that the apparent strong correlations displayed on these graphs have been obtained by an incorrect handling of the physical data.”[Full text]
Cosmic Rays, Clouds, and Climate – Carslaw et al. (2002) A review paper. “It has been proposed that Earth’s climate could be affected by changes in cloudiness caused by variations in the intensity of galactic cosmic rays in the atmosphere. This proposal stems from an observed correlation between cosmic ray intensity and Earth’s average cloud cover over the course of one solar cycle. Some scientists question the reliability of the observations, whereas others, who accept them as reliable, suggest that the correlation may be caused by other physical phenomena with decadal periods or by a response to volcanic activity or El Niño.”[Full text]
A new look at possible connections between solar activity, clouds and climate – Kristjánsson et al. (2002)“We present a re-evaluation of the hypothesis of a coupling between galactic cosmic rays, clouds and climate. We have used two independent estimates of low cloud cover from the International Satellite Cloud Climatology Project, covering 16.5 years of data. The cloud cover data are used in conjunction with estimates of galactic cosmic ray flux and measurements of solar irradiance. It is found that solar irradiance correlates better and more consistently with low cloud cover than cosmic ray flux does. The correlations are considerably lower when multichannel retrievals during daytime are used than retrievals using IR-channels only.”[Full text]
Some results relevant to the discussion of a possible link between cosmic rays and the Earth’s climate – Wagner et al. (2001)“However, the smoothed combined flux of 10Be and 36Cl at Summit, Greenland, from 20–60 kyr B.P. (proportional to the geomagnetically modulated cosmic ray flux) is unrelated to the corresponding δ18O and CH4 data (interpreted as supraregional climate proxies). (3) Furthermore, although a comparison of the incoming neutron flux with cloud cover in Switzerland over the last 5 decades shows a significant correlation at times during the 1980s and 1990s, this does not occur during the rest of the period.”[Full text]
Sunshine records from Ireland: cloud factors and possible links to solar activity and cosmic rays – Pallé & Butler (2001)“The importance of cosmic rays as a link between solar activity and climate was assessed from a study of the ISCCP-D2 satellite cloud factors and Irish sunshine data. Whilst these results confirmed the strong correlation between total cloud factor and cosmic rays over non-tropical oceans between 1984 and 1991 previously reported, it was found that this correlation did not hold in the subsequent period 1991-1994. Other work has established a link through specifically low cloud. Indirect evidence of cloud formation by cosmic rays from a variation in the sunshine factor following Forbush decreases, and over the sunspot cycle, was mostly negative. Although a dip at seven years past sunspot minimum is evident in the sunshine factor for all four sites and in most seasons, it is of marginal statistical significance.”[Full text]
Cloud cover variations over the United States: An influence of cosmic rays or solar variability? – Udelhofen & Cess (2001)“To investigate whether galactic cosmic rays (GCR) may influence cloud cover variations, we analyze cloud cover anomalies from 1900–1987 over the United States. … The cloud cover variations are in phase with the solar cycle and not the GCR.”
Is there a cosmic ray signal in recent variations in global cloudiness and cloud radiative forcing? – Kristjánsson et al. (2000)“In order to evaluate a recent hypothesis of a coupling between galactic cosmic rays, clouds, and climate we have investigated temporal variations in global cloudiness and radiative fluxes at the top of the atmosphere. … When the results are related to temporal variations in cosmic ray activity, we do not find support for a coupling between cosmic rays, total cloudiness, and radiative forcing of climate. … The net radiative effect of clouds during the period 1985–1989 shows an enhanced cooling effect despite a reduction in both total and low cloud cover. This contradicts the simple relationship between cloud cover and radiation assumed in the cosmic-ray-cloud-climate hypothesis.”
Are Cosmic Rays Influencing Oceanic Cloud Coverage – Or Is It Only El Niño? – Farrar (2000)“The monthly average (C2) cloud coverage data produced by the International Satellite Cloud Climatology Project (ISCCP) for the period of July 1986–June 1991 show strong global and regional cloud coverage variations associated with the El Niño of 1986–1987. The Pacific Ocean, in particular, shows strong regional variations in cloud coverage. These agree well with contemporaneous satellite observations of broadband shortwave infrared cloud forcing measured by the Earth Radiation Budget Experiment. Svensmark and Friis-Christensen (1997) noted a similarity between the shape of the timeseries curve of average cloud coverage fraction for mid- to low-latitude ocean-areas and the time series curve of cosmic ray flux intensity. They proposed a causal relationship – a `missing link’ for solar cycle influence on Earth climate. Further spatial and temporal analysis of the same ISCCP C2 data in this paper indicates that the cloud coverage variation patterns are those to be expected for the atmospheric circulation changes characteristic of El Niño, weakening the case for cosmic rays as a climatic forcing factor.”
Closely related
Testing the link between terrestrial climate change and Galactic spiral arm transit – Overholt et al. (2009) Tests the correlation of climate changes and Earth’s passage through spiral arms of the Milky Way. Possible climate effects largely relate to cosmic rays. “We re-examine past suggestions of a close link between terrestrial climate change and the Sun’s transit of spiral arms in its path through the Milky Way galaxy. These links produced concrete fits, deriving the unknown spiral pattern speed from terrestrial climate correlations. We test these fits against new data on spiral structure based on CO data that do not make simplifying assumptions about symmetry and circular rotation. If we compare the times of these transits with changes in the climate of Earth, the claimed correlations not only disappear, but we also find that they cannot be resurrected for any reasonable pattern speed.”[Full text]
Toward Direct Measurement of Atmospheric Nucleation – Kulmala et al. (2007) A paper on the results of SMEAR project which (among other activities) provides direct measurements of atmospheric nucleation. They find that ion-induced nucleation is not very important (ion-induced nucleation fraction is only 10 % of total nucleation at best). “We introduce an instrumental setup to measure atmospheric concentrations of both neutral and charged nanometer-sized clusters. By applying the instruments in the field, we come to three important conclusions: … (iii) neutral nucleation dominates over the ion-induced mechanism, at least in boreal forest conditions.”
For those interested in the SMEAR project results, see the presentation of Markku Kulmala in “Climate Change – Man Made?” seminar in Stockholm (2009) (click the “cosmic rays and climate change”, Kulmala’s presentation starts after Svensmark’s, about at 00:34:15).
There are plenty of papers which deal with this cosmic ray issue while concentrating solar forcing as a whole (for example a string of papers from Lockwood & Fröhlich). Many of those papers would belong to the list above, but I shall make a separate entry on them, and add link to that post here when I have made it (separate post is already on the works). UPDATE (September 3, 2009): Here is the link to the post about the Sun’s role.
Original claims of Svensmark et al. were based on the apparent correlation between the cosmic rays and an observed decreasing trend in ISCCP cloud cover data, but it has been found out that ISCCP trend was an artifact of satellite viewing geometry, so it seems that there is no observational basis for the original claim. [UPDATE (March 17, 2010): I have recently discussed about this here.] There are few papers discussing this, and I will give one of them below.
Arguments against a physical long-term trend in global ISCCP cloud amounts – Evan et al. (2007)“Here we show that trends observed in the ISCCP data are satellite viewing geometry artifacts and are not related to physical changes in the atmosphere. Our results suggest that in its current form, the ISCCP data may not be appropriate for certain long-term global studies, especially those focused on trends.”[Full text]
UPDATE (September 10, 2009): As it has been suggested that cosmic rays affect by changing the cloud cover, this is relevant here:
Finally, here are my own researches into the same question. Remember, the question is NOT “Does the sun affect the climate?” The answer to that one is clearly “Yes“, because without a sun we wouldn’t have a climate.
The real question we’re all looking at is,“Do the tiny changes that we see in various kinds of solar output over a sunspot cycle affect the climate?”. All the research I’ve done says the answer is no, which was a huge surprise to me. Having read about wheat prices and sunspots when I was a kid, I thought it would be easy to find modern data to substantiate those centuries-old claims … man, was I surprised. Here are my findings:
Congenital Cyclomania Redux 2013-07-23
Well, I wasn’t going to mention this paper, but it seems to be getting some play in the blogosphere. Our friend Nicola Scafetta is back again, this time with a paper called “Solar and planetary oscillation control on climate change: hind-cast, forecast and a comparison with the CMIP5 GCMs”. He’s…
Cycles Without The Mania 2013-07-29
Are there cycles in the sun and its associated electromagnetic phenomena? Assuredly. What are the lengths of the cycles? Well, there’s the question. In the process of writing my recent post about cyclomania, I came across a very interesting paper entitled “Correlation Between the Sunspot Number, the Total Solar Irradiance,…
Sunspots and Sea Level 2014-01-21
I came across a curious graph and claim today in a peer-reviewed scientific paper. Here’s the graph relating sunspots and the change in sea level: And here is the claim about the graph: Sea level change and solar activity A stronger effect related to solar cycles is seen in Fig.…
Riding A Mathemagical Solarcycle 2014-01-22
Among the papers in the Copernicus Special Issue of Pattern Recognition in Physics we find a paper from R. J. Salvador in which he says he has developed A mathematical model of the sunspot cycle for the past 1000 yr. Setting aside the difficulties of verification of sunspot numbers for…
Sunny Spots Along the Parana River 2014-01-25
In a comment on a recent post, I was pointed to a study making the following surprising claim: Here, we analyze the stream flow of one of the largest rivers in the world, the Parana ́ in southeastern South America. For the last century, we find a strong correlation with…
Usoskin Et Al. Discover A New Class of Sunspots 2014-02-22
There’s a new post up by Usoskin et al. entitled “Evidence for distinct modes of solar activity”. To their credit, they’ve archived their data, it’s available here. Figure 1 shows their reconstructed decadal averages of sunspot numbers for the last three thousand years, from their paper: Figure 1. The results…
Solar Periodicity 2014-04-10
I was pointed to a 2010 post by Dr. Roy Spencer over at his always interesting blog. In it, he says that he can show a relationship between total solar irradiance (TSI) and the HadCRUT3 global surface temperature anomalies. TSI is the strength of the sun’s energy at a specified distance…
Cosmic Rays, Sunspots, and Beryllium 2014-04-13
In investigations of the past history of cosmic rays, the deposition rates (flux rates) of the beryllium isotope 10Be are often used as a proxy for the amount of cosmic rays. This is because 10Be is produced, inter alia, by cosmic rays in the atmosphere. Being a congenitally inquisitive type…
The Tip of the Gleissberg 2014-05-17
A look at Gleissberg’s famous solar cycle reveals that it is constructed from some dubious signal analysis methods. This purported 80-year “Gleissberg cycle” in the sunspot numbers has excited much interest since Gleissberg’s original work. However, the claimed length of the cycle has varied widely.
The Effect of Gleissberg’s “Secular Smoothing” 2014-05-19
ABSTRACT: Slow Fourier Transform (SFT) periodograms reveal the strength of the cycles in the full sunspot dataset (n=314), in the sunspot cycle maxima data alone (n=28), and the sunspot cycle maxima after they have been “secularly smoothed” using the method of Gleissberg (n = 24). In all three datasets, there…
It’s The Evidence, Stupid! 2014-05-24
I hear a lot of folks give the following explanation for the vagaries of the climate, viz: It’s the sun, stupid. And in fact, when I first started looking at the climate I thought the very same thing. How could it not be the sun, I reasoned, since obviously that’s…
Sunspots and Sea Surface Temperature 2014-06-06
I thought I was done with sunspots … but as the well-known climate scientist Michael Corleone once remarked, “Just when I thought I was out … they pull me back in”. In this case Marcel Crok, the well-known Dutch climate writer, asked me if I’d seen the paper from Nir…
Maunder and Dalton Sunspot Minima 2014-06-23
In a recent interchange over at Joanne Nova’s always interesting blog, I’d said that the slow changes in the sun have little effect on temperature. Someone asked me, well, what about the cold temperatures during the Maunder and Dalton sunspot minima? And I thought … hey, what about them? I…
Changes in Total Solar Irradiance 2014-10-25
Total solar irradiance, also called “TSI”, is the total amount of energy coming from the sun at all frequencies. It is measured in watts per square metre (W/m2). Lots of folks claim that the small ~ 11-year variations in TSI are amplified by some unspecified mechanism, and thus these small changes in TSI make an…
Splicing Clouds 2014-11-01
So once again, I have donned my Don Quijote armor and continued my quest for a ~11-year sunspot-related solar signal in some surface weather dataset. My plan for the quest has been simple. It is based on the fact that all of the phenomena commonly credited with affecting the temperature,…
Volcanoes and Sunspots 2015-02-09
I keep reading how sunspots are supposed to affect volcanoes. In the comments to my last post, Tides, Earthquakes, and Volcanoes, someone approvingly quoted a volcano researcher who had looked at eleven eruptions of a particular type and stated: …. Nine of the 11 events occurred during the solar inactive phase…
Early Sunspots and Volcanoes 2015-02-10
Well, as often happens I started out in one direction and then I got sidetractored … I wanted to respond to Michele Casati’s claim in the comments of my last post. His claim was that if we include the Maunder Minimum in the 1600’s, it’s clear that volcanoes with a…
Sunspots and Norwegian Child Mortality 2015-03-07
In January there was a study published by The Royal Society entitled “Solar activity at birth predicted infant survival and women’s fertility in historical Norway”, available here. It claimed that in Norway in the 1700s and 1800s the solar activity at birth affected a child’s survival chances. As you might imagine, this…
The New Sunspot Data And Satellite Sea Levels 2015-08-13
[UPDATE:”Upon reading Dr. Shaviv’s reply to this post, I have withdrawn any mention of “deceptive” from this post. This term was over the top, as it ascribed motive to the authors. I have replaced the term with “misleading”. This is more accurate…
My Thanks Apologies And Reply To Dr Nir Shaviv 2015-08-17
Dr. Nir Shaviv has kindly replied in the comments to my previous post. There, he says: Nir Shaviv” August 15, 2015 at 2:51 pm There is very little truth about any of the points raised by Eschenbach in this article. In particular, his analysis excludes the fact that the o…
The Missing 11 Year Signal 2015-08-19
Dr. Nir Shaviv and others strongly believe that there is an ~ 11-year solar signal visible in the sea level height data. I don’t think such a signal is visible. So I decided to look for it another way, one I’d not seen used before. One of the more sensitive …
Is The Signal Detectable 2015-08-19
[UPDATE] In the comments, Nick Stokes pointed out that although I thought that Dr. Shaviv’s harmonic solar component was a 12.6 year sine wave with a standard deviation of 1.7 centimetres, it is actually a 12.6 year sine wave with a standard deviation of 1.7 millime…
23 New Papers 2015-09-22
Over at Pierre Gosselin’s site, NoTricksZone, he’s trumpeting the fact that there are a bunch of new papers showing a solar effect on the climate. The headline is Already 23 Papers Supporting Sun As Major Climate Factor In 2015 “Burgeoning Evidence No Longer Dismissible!…
So I’ve found nothing to date, despite lots of looking …
On a more personal note, after a two-day trip featuring lost luggage, a missed connection, and a definite need for two-fella Panadol, I’m finally back home from the Solomon Islands, and I’m once again with my gorgeous ex-fiancee in our lovely and peaceful home that I built here on our hillside with a tiny view of the sea … heaven.
I was surprised to note that I wrote 19 posts during the four weeks I was there … well, actually 17 plus re-posting a couple of relevant stories I’d written earlier. They’re all available here, as a category of my blog, Skating Under The Ice. Scroll down to the post called “Feasting” at the bottom and read up, they’ll make more sense in chronological order.
My very best Christmas, New Years, and Holiday Of Your Politically Correct Choice wishes to everyone.
w.
AND AS ALWAYS: My polite request, which is that when you comment you QUOTE THE EXACT WORDS THAT YOU ARE REFERRING TO. This lets us all understand what it is that you are talking about, as well as who wrote the words, and what the context of the statement was.
I cannot overemphasize the importance of this request. I am unwilling, as the poet put it, “… to hear the truth you’ve spoken, twisted by knaves to make a trap for fools.”
Not interested, thanks.
More importantly, however, if you wish to refute what someone said, the starting point must and has to be what someone said. You must first quote their actual words that you claim are wrong. Not what you think their words mean; you can get to that, but you have to begin the refutation with what they actually said. Without their exact words as a starting point, you are just flailing at the air, attacking a straw man of your own creation.
Now, the request is polite … but if you ignore it my response may not be polite. I’m tired of people accusing me of anything and everything based on something they wrongly think I said somewhere sometime long ago in a distant galaxy … too boring. If you’re lucky I’ll just ignore such accusations and claims; otherwise, I am likely to point out your failure as regards quoting, and perhaps your associated shortcomings, using inventive and unusual but generally less than laudatory terms … don’t say I didn’t warn you.
Thanks, w.
You guys aren’t playing by the rules. You have to include direct quotes before you can call it crap.
The direct quote is everything Willis driveled.
Appreciate your input, Gabro. I am probably like most who accept that GCR’s can increase cloud condensating nuclei but am skeptical of their influence, as it may be in the same league as CO2’s effect on atmospheric water vapor, which appears to me to be inconsequential.
Chad,
Except that big climate swings are correlated with solar minima and maxima, and well supported mechanisms explain them.
Unlike CO2.
You really need to tone it down Gabro.
Gabro December 26, 2017 at 5:12 pm
Gabro, you really should actually read the study you are recommending. In this case, it’s not a study of Indian monsoon data. Instead, it is a study of the output of a climate model set up to emulate the Indian monsoon. Do you believe in the mysterious power of climate models? Because I assure you, I don’t …
Among other inputs to that climate model are solar variations. And since (unlike natural systems) the climate model is linear, we are almost guaranteed to see solar in the output. So frickin’ what?
If you believe that studying a climate model’s output is a good way of establishing a solar signal, I have a bridge in Brooklyn that’s up for sale …
w.
PS—Yes, there are lots of studies like this one that claim to show the solar signal in some surface dataset … and I haven’t found one yet that holds water. I’ve made this offer before, I’ll make it again. Give me two links, one to what you think is the best study showing sunspot-related effects on any surface dataset, and the other to the data used in the analysis, and I’ll take a look at it.
I’ve already taken a look at your best shot, Gabro, and it doesn’t even pass the laugh test. Studying the output of a climate model is one step away from studying chicken entrails, and I’m not sure whether it is a step up or a step down.
Willis,
It’s pointless to provide you more studies, because your pathetically amateur statistical “analyses” always find them wanting. But real scientists have repeatedly found in hundreds of studies what you claim never to have found in looking at a few.
You’re a sad joke. A careerless poseur desperately trying at the end of your pointless, miserable existence to grasp meaningfulness. And failing.
[???? .mod]
Gabro:
And your opinion about Willis’ methods and writings matters because of ?
Gabro December 26, 2017 at 7:11 pm
As I said, you cannot refute someone without quoting them. If you don’t quote them, you’re just offering an unsubstantiated and in your case nasty piece of your mind rather than any valid scientific objection.
Thanks, I’ll pass … not interested in any part of your cranial contents, they’re far too unpleasant. If you have a valid scientific objection to my statements, I’m happy to listen.
But you spitting and fuming like a frustrated six-year-old?
Sorry, but that’s not worth the electrons you used to write it …
w.
Gabro, you are becoming belligerent and insulting, I’m putting you on moderation until you cool down and learn to behave in a courteous manner.
Willis, I suggest you read the book, The Chilling Stars, by Svensmark and Calder, if you have not read it yet. It discusses their theory and answers the issues raised by critics.
Most, if not all of the papers, on cosmic ray theory analyze empirical data and invent theories to explain the data. My approach is mathematical. I start with fundamental equations of chemistry, particle physics and kinetic molecular theory, and rule out those claims and theories that violate basic principles such as the conservation of kinetic energy and momentum. It is a sort of mathematical proof (or disproof) of theories.
I recently wrote a letter to Svensmark and will be writing soon part two of the letter. I will send Anthony copy of the letters. It’s too long to post here in comment section.
I look forward to that, Doc. I say that in part because it’s not clear to me that anything that Svensmark says contravenes any known physics … he just hasn’t shown that it makes a measurable difference in the real world.
w.
Willis makes a strong argument against correlation of cosmic ray incidence and global cloud cover during recent times and argues that the Swensmark hypothesis isn’t valid. His analysis of data and data in references he discusses seem quite convincing. I have no argument with his conclusions about recent data.
However, I wonder if the same can be said about long-term data. I’ve spent a lot of time looking into the relationship of global temperature, sunspots, solar irradiance, cosmic rays, radiocarbon and berylium production rates, and cloud cover over periods of hundreds to thousands of years. What I found was an astonishing, excellent correlation between these factors, well beyond any possibility of random coincidence. Correlation doesn’t prove causation, but the exceptional correlation of these factors demands rational explanation. Some of these data have been published in “Global Temperature, Sunspots, Solar Irradiance, Cosmic Rays, and Radiocarbon and Berylium Production Rates, 2016, Evidence-based climate science, Elsevier, p. 249-266.
Global temperature changes show excellent correlations with sunspots, total solar irradiance, 14C and 10Be production in the upper atmosphere, and cosmic ray incidence. Periods of global cooling coincided with these changes during the Oort, Wolf, Maunder, Dalton, 1880–1915, and 1945–1977 Solar Minimums. Increased 14C and 10Be production during times of increased cosmic radiation serves as a proxy for solar activity. Global cooling coincided with changes in sunspot activity, TSI, solar flux, cosmic ray incidence, and rates of production of 14C and 10Be in the upper atmosphere during the Oort, Wolf, Maunder, Dalton, 1880–1915, and 1945–1977 Solar Minimums. Increased 14C and 10Be production during times of increased cosmic radiation serve as a proxy for solar activity.
So the question is, what is the cause of these remarkable correlations? The Svensmark hypothesis offers one explanation, but are there other possibilities? Why is there disagreement between the geologic record and Willis’s objections? Both seem to be reasonable. If weakening of the sun’s magnetic field allows greater incidence of cosmic radiation and increased cloudiness over hundreds to thousands of years, why does it not show up in recent data? Do we have enough recent global cloud data to work with? Lots to think about!
Fools rush in where angels fear to tread. So I foolishly weigh in after a delightful seafood dinner at Shooters on the intercoastal in Fort Lauderdale with Charles the Moderater. An inspiration.
I have looked at all the papers and all the blog arguments here and elsewhere on this topic over the past 6 years. When I say, all, I mean a good faith best efforts attempt, probably not literally all. I reach three conclusions after 6 years of part time study.
First, the definition of the Maunder Minimum related to the LIA onset is at best sketchy. Lots of time slippage. Limited patchy records from long ago at the very beginning of teleoscopy? Error bars enormous if such can even be ascribed at all. So faith in this is mostly just that, faith—not reliable replicable science.
Second, Svensmark has adequately demonstrated an experimental and theoretical relatiinship between cosmic rays and cloud condensate nucleators. No doubt anout that IMO.
Third, what Svensmark has emphatically not done is show that his cosmic ray CCN effect is a major contributor to climate as he claims. As posted previously, there are massive other natural (biological) CCNs such as turpenes, isoprenes, dimethylsulfides,…and he has not parsed his GCR contribution from the rest. To support his claims, that is his missing to do.
As said on previous threads, Svalgard and Eschenbach have the better of this debate by far, so far.
On first point, evolution is also not replicable science. Is it a matter of faith?
On third point, I will show in my part two letter to Svensmark that the theory of biological CCNs violates basic physical principles. The theory must be modified to make sense. Cosmic rays play a crucial role even in formation of biological CCNs
Your first point is false because it misdefines replicability. Evolution is not a matter of faith, unlike intelligent design. See the discussion of the evolution of the eye (three separate ways, an example of convergent evolution) in ebook The Arts of Truth. Paleontology has innumerable examples from the fossil past, trilobites being one notable example of speciation over hundreds of millions of years. For some groupings of current or recently extinct species, we also have DNA evidence, especially mitichondrial dna. Neaderthals, Denisovians, and homo floriensis are examples.
Replicability – under the same operating conditions you get the same results. Unfortunately you cannot replicate the evolution of life on Earth. Philosophers of science will argue evolution is not falsifiable. But as Richard Feynman said, the philosophy of science is important to scientists as ornithology is important to birds.
Willis-san:
I always find your work interesting, informative and compelling, however, I simply have to disagree with your opinion on the efficacy of the Svensmark Effect.
There is a strong multi-century correlation between the Little Ice Age (LIA) and four GSM events: Wolf, Sporer, Maunder and Dalton (1280~1820).
I also find it compelling that the strongest 63-year string of solar cycle (1933~1996) in 11,400 years corresponds nicely with the 20th Century warming, and when these strong solar cycles ended in 1996, so did the global warming trend (excluding the 2015/16 Super El Nino spike), despite 30% of all manmade CO2 emissions since 1750 being made over just these 19 years:
http://www.woodfortrees.org/plot/uah6-land/from:1996.6/to:2015.7/plot/uah6/from:1996.6/to:2015.7/trend/plot/esrl-co2/from:1996.6/to:2015.7/normalise/trend/plot/esrl-co2/from:1996.6/to:2015.7/normalise
When these GSMs started, so did the LIA and when they ended, so did the LIA.
Granted, the Svensmark Effect is just one climatic phenomenon out of literally hundreds, and other climatic phenomena (Especially ENSO and PDO/AMO 30-year warm/cool cycles) may obscure the Svensmark Effect, but over decadal time scales, the Svensmark Effect does seem to play a significant role on Earth’s climate.
We’ll soon be able to observe the climatic impact of the Svensmark Effect from 2021, when the weakest solar since the Dalton GSM begins, and even more so from 2032 when the weakest solar cycle since the Maunder GSM starts.
We’ll see soon enough.
Cheers, Willis! I wish you all the best in the New Year!
SAMURAI December 26, 2017 at 8:32 pm
Sensei, first, thanks for your kind words, and best of the Holidays to you too.
However, I don’t understand your claim about the sunspots. Annual maximum sunspot numbers peaked in 1959 and have been decreasing ever since … so why has the temperature not followed the decrease in sunspots?
w.
Willis-san:
The average Smoothed Sunspot Number (SSN) for the 6 solar cycles between 1933~1996 is 151, which is more than twice the 12,000-year SSN average of 72.
It’s interesting to note that during this 20th century Grand Solar Maximum event (1933~1996) the strongest solar cycle (SC19: May 1959~March 1964/SSN=201.3) had a warming trend of 0.25C/decade (the highest warming trend of any 20th century solar cycle, and occurred during a 30-year PDO cool cycle), and during the 2nd and 3rd back-to-back strongest solar cycles (SC21 & SC22: May 1996~June 1996: SSN=164.5,158.5 respectively) the trend was 0.14C/decade (HADCRUT4 data).
When these strong solar cycles ended in June 1996, the global warming trend fell to 0.008C/decade (June 1996~June 2015, excluding the 2015/16 Super El Nino spike).
You’re correct that during the Modern Grand Solar Maximum, SSNs peaked during SC19 at 201.3, but overall, SSNs were still over twice the 12,000-year average SSN of 72.
Solar cycles have been collapsing since June 1996, however, the SSN for the current SC24 is 82, which is still above the 12,000-year average SSN of 72.
I think there is compelling evidence for the Svensmark Effect, and anticipate a global cooling trend to develop once a Grand Solar Minimum starts from SC25 in 2021, and expect a very significant cooling trend to develop from 2032 when SC26’s SSN approaches zero (as during the Maunder GSM).
We’ll see soon enough, my friend.
Cheers, mate!
SAMURAI December 26, 2017 at 10:59 pm Edit
Thanks, Sensei, but the 12,000-year sunspot number average? Say what? I got no further than that. My rule is, if modern data doesn’t support your theory, heading to deep time is just desperation. I’m sorry, and I’m happy to be shown wrong, but claiming that we know the sunspot average 11,000 years ago doesn’t pass the laugh test with me.
Onwards …
w.
The hypothesis is supported both by modern and ancient data. The hypothesis is very simple:
Multidecadal periods of below average solar activity manifest in global cooling. Multidecadal periods of above average solar activity manifest in global warming. The intensity of the solar caused global warming or cooling is proportional to the multidecadal deviation in solar activity from its long term average. Other factors also affect global temperatures and might affect the final result, including intense volcanic activity and changes in atmospheric greenhouse gases.

Solar activity went below average in 2006. The reduction in warming rate that took place from 2003 is due to the 60-year oceanic cycle being synchronized to the centennial solar cycle. Below average solar activity has become multidecadal starting in 2016. The reduction in multidecadal solar activity is not very high. Activity is higher than during the Gleissberg minimum of 1900’s. Solar hypothesis predicts a slight cooling until at least 2035 when solar activity is predicted to become above average again.
The solar hypothesis does not depend on GCR having an effect on climate. Svensmark being wrong doesn’t detract from the solar hypothesis. Personally I don’t think the evidence is on the side of Svensmark, as I have said several times. The main factor in determining the arrival of GCR to the Earth is not the Sun, but the Geomagnetic field.
Solar hypothesis prediction of slight cooling until 2035 is in stark contrast to CO₂ hypothesis that predicts increasing warming for as long as atmospheric CO₂ does not decrease. Solar hypothesis is not derived from theory or our imperfect knowledge of climate, but from 11,700 years of data. Over almost 12,000 years the coincidence of long periods of very low average solar activity, known as Solar Grand Minima, and periods of climate worsening is a smoking gun.
Javier, in response to your claim that grand solar minima lead to temperature minima, let me point you to one of my posts cited up above, one that you clearly didn’t read.
It addresses this exact claim, that times of low solar equal times of cold climates, and it finds that claim hard aground on an ugly reef of data.
It’s called “Maunder and Dalton Sunspot Minima” although it covers more minima than that.
If you can find something wrong with my analysis, kindly quote the exact words where you think I go off the rails, and tell us what I’m doing wrong.
And if you (or anyone else) can’t find something wrong with that analysis, can we let go of the idea that “grand solar minima” have some kind of strong effect on climate?
w.
Willis,
I haven’t read all your articles, and of those I read I have mostly forgotten, even if I participated in the comments. Upon reading this one I find it superficial and misguided, but this is a general critique, so no exact quote can be provided.
The use of England winter severity index either by Eddy or you is clearly inappropriate. Local and regional climate is far more variable than hemispheric or global climate. The same applies to CET.
The use of thermometric data (BEST in this case) is even worse, as so ancient data is simply unsuited for the task and can’t be trusted.
Simply you cannot conclude either way from that kind of data.
To reconstruct past climate the best approach is a properly done multi-proxy reconstruction when available. When not available your best bet is through a few carefully chosen proxies, as representative as possible. It is not unusual for proxies to disagree as they represent local conditions and are affected by other factors not always properly accounted for, like a variable sedimentation rate for example. Ideally proxies should cover completely independent variables that respond to climate, like marine isotopic segregation, glacier extension, tree-rings, speleothems, ice cores, and so on.
When you do that this is what you get:
For the Little Ice Age (Wolf, Spörer, Maunder, Dalton minima):

The last panel shows why Spörer didn’t show Alpine glacier advance. It was a very dry period in Central Europe.
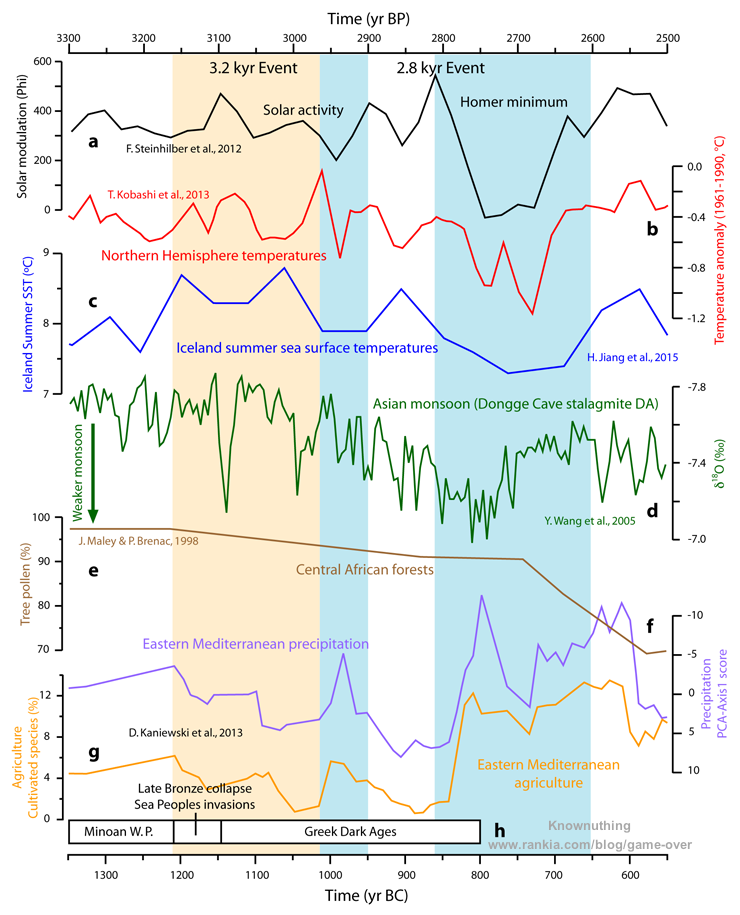
For the Homer minimum of 2800 BP:
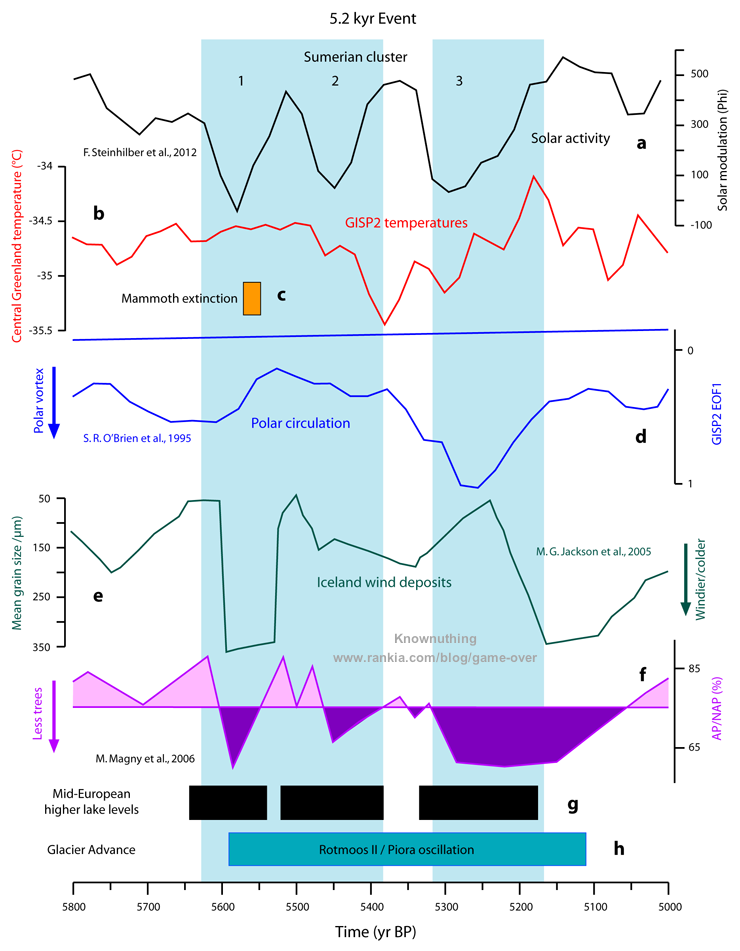
For the Summerian SGM cluster of 5200 BP:
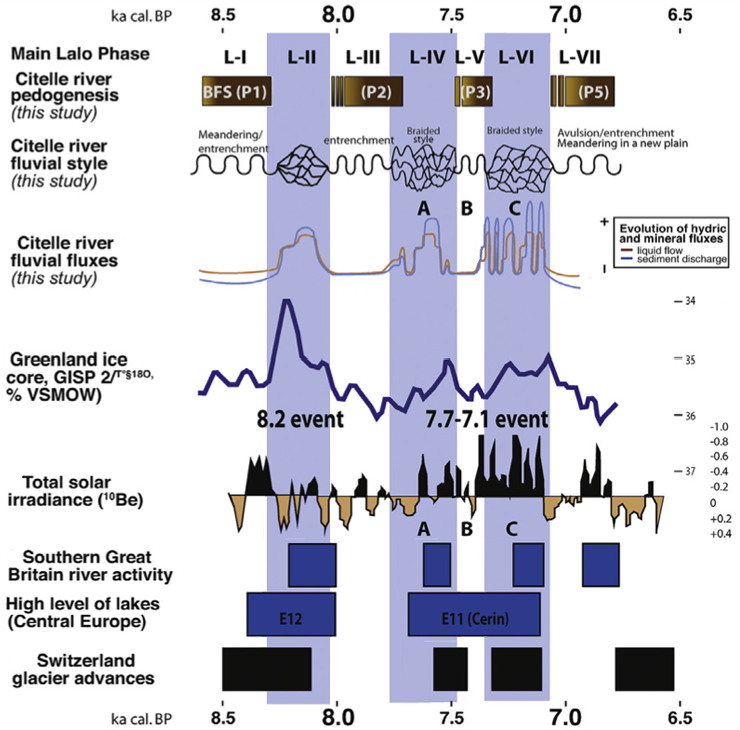
For the Boreal/Atlantic transition (Jericho SGM cluster):
For the Boreal Oscillation 10,300 BP:

Prolonged low solar activity is consistently associated with periods of climate worsening. The scientific literature is very clear on this, but of course you don’t know/don’t care what the scientific literature says. Playing with some data may satisfy you, but it won’t advance our knowledge.
That is impressive! The three coldest periods in Central England were each during a solar minimum, Maunder, Dalton, and one Willis calls the ‘Ulric’ minimum in the late 1800’s.
How about we consider the number of volcanic stratospheric aerosol events through the period of the LIA especially after the great Samalas one of 1257. And possible ice/albedo feedback on the climate…..

http://www.historicalclimatology.com/uploads/4/5/1/4/4514421/screen-shot-2017-11-30-at-7-51-24-am_orig.png
http://onlinelibrary.wiley.com/doi/10.1029/2011GL050168/full
” Here we present precisely dated records of ice-cap growth from Arctic Canada and Iceland showing that LIA summer cold and ice growth began abruptly between 1275 and 1300 AD, followed by a substantial intensification 1430–1455 AD. Intervals of sudden ice growth coincide with two of the most volcanically perturbed half centuries of the past millennium. A transient climate model simulation shows that
explosive volcanism produces abrupt summer cooling at these times, and that cold summers can be maintained by sea-ice/ocean feed-backs long after volcanic aerosols are removed. Our
results suggest that the onset of the LIA can be linked to an unusual 50-year-long episode with four large sulfur-rich explosive eruptions, each with global sulfate loading >60 Tg. The persistence of cold summers is best explained by consequent sea-ice/ocean feed-backs during a hemispheric summer
insolation minimum; large changes in solar irradiance are not required.”
Except that everything we have measured from volcanic eruptions is short term. 2-3 years at most.
The drop in temperature following large volcanic eruptions has been identified as an important component of natural climate variability. However, due to the limited number of large eruptions that occurred during the period of instrumental observations, the precise amplitude of post-volcanic cooling is not well constrained. Here we present new evidence on summer temperature cooling over Europe in years following volcanic eruptions. We compile and analyze an updated network of tree-ring maximum latewood density chronologies, spanning the past nine centuries, and compare cooling signatures in this network with exceptionally long instrumental station records and state-of-the-art general circulation models. Results indicate post-volcanic June–August cooling is strongest in Northern Europe 2 years after an eruption (−0.52 ± 0.05 °C), whereas in Central Europe the temperature response is smaller and occurs 1 year after an eruption (−0.18 ± 0.07 °C). We validate these estimates by comparison with the shorter instrumental network and evaluate the statistical significance of post-volcanic summer temperature cooling in the context of natural climate variability over the past nine centuries. Finding no significant post-volcanic temperature cooling lasting longer than 2 years, our results question the ability of large eruptions to initiate long-term temperature changes through feedback mechanisms in the climate system.
Esper, Jan, et al. “European summer temperature response to annually dated volcanic eruptions over the past nine centuries.” Bulletin of volcanology 75.7 (2013): 736.
Another case of models against evidence. What will it be?
“Finding no significant post-volcanic temperature cooling lasting longer than 2 years, our results question the ability of large eruptions to initiate long-term temperature changes through feedback mechanisms in the climate system.”
Javier:
At least some parts of Earth were cooler during the LIA (BTW not an Ice Age in England anyway else the coldest DJF on record in the CET- 1683/4 would not have been followed 2 yeas later by the 8th warmest – 1685/6).
Seems to me that te 1257 eruption ceratiainly did not help, eh?
Also when are you going to accept that stratospheric PV disruption due to solar influence only moves the troposphere around, and is therefor a stirring of heat within it (NH only). That Europe and N America are prone to such cold plunges is a function of topological driving of the PJS.
No W/m^2 of any consequence are removed … as Leif says.
There is a huge assumption in your reasoning. As Scotese has shown, the climate of the Earth depends critically on the latitudinal temperature gradient. Not only the tropical input in W/m² is important, but also the polar output is determinant. The solar induced stratospheric and tropospheric changes alter the amount of energy that gets out of the planet.
A perfect example is this winter, during solar minimum conditions and eastward QBO at 30 hPa. A disorganized polar vortex allows masses of cold air to invade Eurasia and North America. This cold polar air is substituted by warmer air over the pole. This warmer air produces increased snow over Greenland and radiates more IR to space. As a consequence more heat is lost to space and the balance of energy is displaced. Only a little this year. But add year after year and you have a colder hemisphere and a colder world.
A simple accounting of TSI will not give you the answer.
Regarding this about the Gleissberg cycle: “However, the claimed length of the cycle has varied widely.”: I think this cycle has a period that is not constant.
Thanks, Donald. If the so-called “Gleissberg cycle” wandered above and below some average value, that might make sense … but there’s no common average length like that around the 80-year length claimed for the Gleissberg cycle. Here is the periodogram of the CEEMD analysis
There is a broad weak peak at around 90 years. However, when we look at the actual sizes of these cycles, we find this:
Note that the 90-year cycle, which is shown in empirical mode C6 in both graphs, only has two distinct peaks and one distinct trough … which is why it is so weak and so broad.
So I fear that the sunspot record doesn’t show much power at any frequency near the 80 years generally claimed for the “Gleissberg cycle” … there’s a very weak peak at 90 years, but a look at the actual cycle in C6 shows that there is only the barest trace of a cycle.
Best regards, thanks for the quotation and your comments on said quotation, much appreciated.
w.
Willis, I usually find your posts informative ( and entertaining if they are on general subjects), but you disappoint me in this rather negative approach. It is on par with “97% of scientists agree on global warming” (or whatever the number was). This is statistics of references and papers to refute a new paper..
This is not the way science advances. 99.99 of publications at the time believed the luminiferous aether was a reality. The Michelson Morley experiment ( https://en.wikipedia.org/wiki/Michelson%E2%80%93Morley_experiment ) destroyed the statistical significance.. Data trumps models.
The Svensmark paper is based on a new experiment that shows a connection in the laboratory of ions and aerosols in generating nuclei for condensation. I pointed out the argument of Leif in the original post here:,
” Think about this:
TSI over a solar cycle causes a variation of 0.05-0.10 degrees C. If GCRs as per Svensmark has 5-7 times the effect of TSI, that would translate to a temperature variation of 0.35-0.50 C over a cycle, which is simply not observed, hence the paper can be dismissed out of hand.”
at the blog of Lubos Motl ( https://motls.blogspot.gr/2017/12/svensmarks-enghoff-shaviv-publish.html) on the same subject , and one of the author’s replied that TSI measured using the oceans as calorimeters does show an increase :
“hsv anna v • 3 days ago
The first sentence in the above is not correct. TSI changes over a solar cycle (~11 year), which enters the oceans is of the order 0.1 W/m2 (amplitude). This gives an expected temperature response of the order 0.01 deg. However the observed response in the oceans is of the order 0.05-0.10 deg., i.e. in agreement with an amplification of 5-7 times. For a full explanation see, Shaviv, N. J. “Using the oceans as a calorimeter to quantify the solar radiative forcing. J. Geophys. Res. (Space Phys.) 113, 11101 (2008).”
Climate is much more complex and chaotic than electromagnetism and the luminipherous aether, but it is not with statistics that one refutes a new scientific proposal, but arguing point by point in the data and the models.
The first sentence in the above is not correct. TSI changes over a solar cycle (~11 year), which enters the oceans is of the order 0.1 W/m2 (amplitude). This gives an expected temperature response of the order 0.01 deg
No, TSI changes by 0.1% which gives a temperature change of order 0.1 K.
Hi, Leif. You also mean in the ocean, yes? so he is quoting a conflicting measurement in the ocean’s response?
I mean that the change in TSI is 0.1%. SB-Law says that dTSI/TSI = 4 dT/T, so that dTSI of 0.1% means a dT of 0.025% [of 288 K = 0.07 K]. The effect of albedo and GHG are already in the 288 K temperature.
So clouds are constant. Got it.
DR December 27, 2017 at 12:30 pm
So clouds are constant. Got it.
Frankly, my dear, I don’t think you did. Your attempt of stupidity was a success, though.
lsvalgaard December 27, 2017 at 9:45 am
Thanks.for the clarification.. Seems to me a terminology misuse on their part , but I would have to read their paper to get at the bottom of it, and I have stopped getting too much into the subject the past years. I find the questions and answers site for general physics at physics.stackexchange more satisfying 🙂
Thanks Willis. This is one I have to read so my readers don’t have to. I’m not going to share with them. Inappropriate nastiness and arrogance is not well received. Keep your tough skin. Welcome back, by the way, and have another good year.
The coldest winters in the UK are clustered around solar minimums so I think this could be accurate.
https://www.msn.com/en-gb/news/uknews/britain-could-face-mini-ice-age-by-2030/ar-BBHolru?li=BBoPWjQ&ocid=wispr
The most fascinating thing about this debate to me, is that Svensmark is making pretty much the same argument for cosmic rays as the IPCC is making for CO2. I have to admire Willis on this, because he is consistent in looking at both theories, for evidence that they may have some skill, and honestly reporting that he can find none.
When the CO2 supporters attack Svensmark, they are attacking basically that same argument that they use for their own position: “It must be true, because we have a known mechanism, and we can’t explain it any other way!” Of course, both sides ignore the fact that their known mechanism doesn’t explain the observations either. outside of very small time periods where the curves briefly fit. Both Svensmark and the IPCC are ignoring the majority of the data that does not support their idea, at least not as a significant or dominant driver.
Here is how I see the arguments:
IPCC: We are the rightful rulers because we wear beautiful red robes!
Svensmark: I am the rightful ruler because I wear beautiful red robes!
IPCC: Svensmark is an idiot because he thinks wearing red robes makes one a ruler, but here are all the reasons why that is clearly not true, and, as the rightful rulers for wearing red robes, we are infallible!
Willis: (scratching head) Um…neither of you are wearing anything!
“When the CO2 supporters attack Svensmark, they are attacking basically that same argument that they use for their own position: “It must be true, because we have a known mechanism, and we can’t explain it any other way!”
It’s not “attacking”.
It’s pointing out that we have not found “his” effect in the real world.
Whereas we know CO2 warms atmospheres.
Sorry, it just does.
Sky-dragon slayers not-with-standing.
We have the known mechanism and the correlation.
https://phys.org/news/2015-02-carbon-dioxide-greenhouse-effect.html

Also CO2 warming is not cyclic.
Any solar based influence is.
I am not denying that CO2 has an impact. I am not denying that cosmic rays have an impact, perhaps in a more subtle, long term way. I am simply pointing out that neither explains the climate change that has been observed; not by themselves or in any significant way.
Global warming has been happening (this time) for 200 years. CO2 has been significantly increasing for about 75 years. And there has been cooling or no warming for more than half of those 75 years. Over millennial time scales and longer, any correlation with CO2 and temperature is insignificant, and indicates that temperature was driving the CO2 concentration during the periodic glaciations, not the other way around.
There is a lot more happening that we don’t understand. There are definitely solar cycles, but that does not mean that everything the sun does is cyclical. Nor does it mean that we are aware of all of the solar cycles that exist; not by a long shot. There are ocean cycles that are not understood or even identified. The same is probably true for atmospheric cycles and processes, especially around clouds. The evidence indicates that we have very little understanding of climate change, but it does clearly show that CO2 and cosmic rays are not primary, or even significant drivers of what we are observing. There is clearly much more that we do not know.
“It’s pointing out that we have not found “his” effect in the real world.”
Isn’t that precisely what CAGW skeptics have been doing for the last 30 years with CO2, and isn’t that exactly what crisis supporters have been ignoring, sometimes with threats and personnel vindictiveness, for the last 30 years? Both Svensmark and the IPCC have apparently conflated the power of their pet process without sufficient evidence. I just find it amusing when climate crisis supporters are so quick to point out the flaws of Svensmark, when their own argument has the same, clairing flaws.
This tendency in humans has been around for a long time! “Why do you look at the speck of sawdust in your brother’s eye and pay no attention to the plank in your own eye?” Matthew 7:3
In case anyone hasn’t read the paper
https://www.nature.com/articles/s41467-017-02082-2
“Increased ionization supports growth of aerosols into cloud condensation nuclei”
“In this study, the effect of ionization on the growth of aerosols into cloud condensation nuclei is investigated theoretically and experimentally.”
Is this, the main part of the paper, to be dismissed out of hand? Is the effect real or not? in the lab? in nature? Note: This is only about aerosols, not climate.
Everyone seems to have skipped ahead to the Climate Science part, which does talk about the “coulds” and “mights”…
“The possible relevance of the presented theory in Earth’s atmosphere will now be discussed.”
“Forbush decreases […] can be used to test the link between cosmic ray ionization and clouds.”
“It is conjectured that this mechanism could be the explanation for the observed correlations between past climate variations and cosmic rays, modulated by either solar activity13,14,15,16,17 or supernova activity in the solar neighborhood on very long time scales18,19,20. “
Climate is complex. Any one thing trying to change it is probably countered by many other things trying to keep it stable. This effect may or may not be real. This effect may or may not affect the climate. Two different things.
Just saying. I will try to keep out of the crossfire.
The strongest ionization as a result of the GCR takes place in the ozone zone above a height of 10 km.
he NAIRAS model predicts atmospheric radiation exposure from galactic cosmic rays (GCR) and solar energetic particle (SEP) events. GCR particles are propagated from local interstellar space to Earth using an extension of the Badhwar and O’Neill model, where the solar modulation has been parameterized using high-latitude real-time neutron monitor measurements at Oulu, Thule, Lomnicky, and Moscow. During radiation storms, the SEP spectrum is derived using ion flux measurements taken from the NOAA/GOES and NASA/ACE satellites. The cosmic ray particles – GCR and SEP – are transported through the magnetosphere using the CISM-Dartmouth particle trajectory geomagnetic cutoff rigidity code, driven by real-time solar wind parameters and interplanetary magnetic field data measured by the NASA/ACE satellite. Cosmic ray transport through the neutral atmosphere is based on analytical solutions of coupled Boltzmann transport equations obtained from NASA Langley Research Center’s HZETRN transport code. Global distributions of atmospheric density are derived from the NCEP Global Forecasting System (GFS) meteorological data.
http://sol.spacenvironment.net/nairas/Dose_Rates.html
The forming Aurora
This picture shows the flowing of particles into and out of the auroral zone, as Field-Aligned currents (FAC’s) take at short-cut through the atmosphere.
Some of the particles entering the auroral zone will collide with particles from the atmosphere and create the aurora. After the collision, these particles leave the magnetosphere and become part of the atmosphere.
The impacts of these particles can have a significant effect on the atmosphere as a whole, causing it to wobble for hours.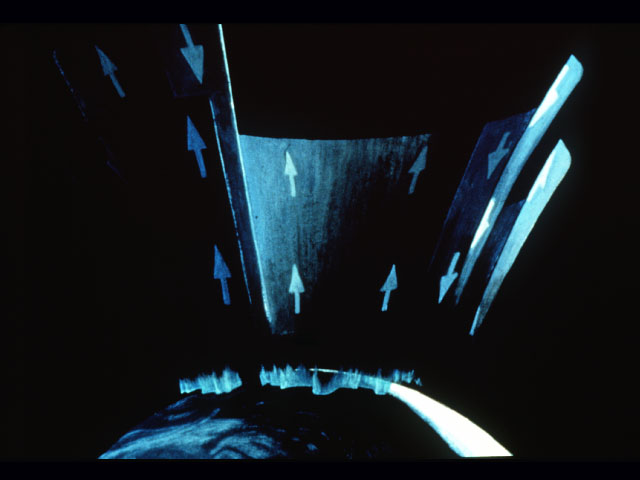
The Effect of Aurora on the Atmosphere
This figure shows the effect of the aurora on the atmosphere. When FAC’s enter the atmosphere and create the aurora, they heat the atmosphere suddenly and abruptly. This creates an impulse which travels throughout the atmosphere and reverberates for a long time, as shown here.
Thus, the creation of the aurora helps to transfer energy from the solar wind, through the magnetosphere, to the atmosphere.
The energy of the solar wind that hits the magnetosphere [and thus is the maximum amount that can possibly be transferred to the atmosphere is a 1/10,000 of the energy of the sunlight that hits the atmosphere. Of that tiny amount only about 1% [that is about one millionth of the sunlight] actually goes into auroral and ionospheric effects, so there is not much to get from the solar wind. Totally negligible.
Sorry.
https://www.windows2universe.org/glossary/aurora_atm_impulse.html
Aurora has a very important feature – in winter it operates within the polar vortex.
http://www.esa.int/Our_Activities/Observing_the_Earth/Swarm/Supersonic_plasma_jets_discovered
The waves that appear in the mesosphere and the stratosphere during the winter should be appreciated.
http://www.cpc.ncep.noaa.gov/products/stratosphere/strat-trop/gif_files/time_pres_UGRD_MEAN_ALL_NH_2017.png
Strefowy wiatr słabnie, gdy wiatr słoneczny słabnie. Now the polar vortex is weakened.
Sorry.
The zonal wind weakens when the solar wind weakens.
http://www.cpc.ncep.noaa.gov/products/stratosphere/strat-trop/gif_files/time_pres_UGRD_ANOM_ALL_NH_2017.png
The kinetic energy of typical cosmic ray is one billion electronvolts. Kinetic energy of typical solar wind is 3000 electronvolts. Solar wind doesn’t reach the troposphere where clouds and weather occur.
Dr. Strangelove
“The kinetic energy of typical cosmic ray is one billion electronvolts. Kinetic energy of typical solar wind is 3000 electronvolts. Solar wind doesn’t reach the troposphere where clouds and weather occur.”
It is enough for the solar wind energy to reach the mesosphere and the stratospheric polar vortex in winter. Will you deny it?
In winter, the air circulation in high latitudes depends on the strength of the stratospheric polar vortex.
Time-height cross section of zonal mean zonal wind averaged over 60°N – 90°N (top) and time-series representation of vertical components of E-P flux averaged over 30°N – 90°N at the 100-hPa level (bottom).
The gray shading on the bottom denotes the vertical components of E-P flux for whole zonal wave numbers, and the red, blue and green lines denote the vertical components of E-P flux for zonal wavenumbers 1, 2 and 3, respectively. The unit for the vertical component of E-P flux is m2/s2.
http://ds.data.jma.go.jp/tcc/tcc/products/clisys/STRAT/gif/jikei_uep_nh.gif
Does galactic radiation and the Earth’s magnetic field influence the distribution of ozone in the mesosphere? I think so. Below is the distribution of ozone at the top of the stratosphere.
Is cosmic radiation affects the polar vortex pattern? I think so. This is currently experienced by North America.
http://files.tinypic.pl/i/00953/cq5zhfz9e8n5.png
ren,
I’m not convinced that cosmic rays per se significantly affect ozone. In contrast it is clear that various solar wavelengths and particles do affect the ozone balance and they vary with solar activity similarly to the level of cosmic rays.
In winter over the polar circle and in the period of low solar activity, the importance of galactic radiation increases. In my opinion, GCR breaks down the ozone particles.
http://www.esa.int/var/esa/storage/images/esa_multimedia/images/2014/06/magnetic_field_changes/14582172-1-eng-GB/Magnetic_field_changes_large.jpg
Magnetic field in the Arctic regions.
The dipole field is symmetrical around the magnetic poles.
Lines of inclination form circles around the magnetic poles.
The strength of a dipole field is maximum at the magnetic poles. The strength at the poles is twice the strength of the field at the equator.
Magnetic meridians converge radially on the north magnetic pole; in other words, a compass needle will point directly at the north magnetic pole.
http://www.geomag.nrcan.gc.ca/mag_fld/arctics-en.php
ren,
You are proposing that GCRs reduce ozone in the stratosphere over the poles when the sun is less active?
That would cool the stratosphere, allow the polar tropopause to rise and induce more zonal, poleward jet stream tracks wouldn’t it ?
That is the opposite of what we actually observe.
Incursions of surface level cold air into middle latitudes often follow periods of stratospheric warming which push tropopause height down so that the air below flows outward. Thus one needs a warmer lower stratosphere over the poles with a quiet sun to achieve a similar effect.
That is why the 2004 observation of warming of the stratosphere above 45km at a time of quiet sun was so important.
Stephen Wilde
The stratospheric polar vortex is a phenomenon typical of winter.
Latitude-height cross section of zonal mean zonal wind in the Southern Hemisphere
The contour interval is 5 m/s.
http://ds.data.jma.go.jp/tcc/tcc/products/clisys/STRAT/gif/zu_sh.gif
Latitude-height cross section of zonal mean zonal wind in the Northern Hemisphere
The contour interval is 5 m/s.
http://ds.data.jma.go.jp/tcc/tcc/products/clisys/STRAT/gif/zu_nh.gif
http://www.cpc.ncep.noaa.gov/products/stratosphere/strat-trop/gif_files/time_pres_TEMP_MEAN_ALL_NH_2017.png
CHANGES IN STRENGTH OF EARTH’S MAGNETIC FIELD
http://www.esa.int/spaceinvideos/Videos/2016/05/Changes_in_strength_of_Earth_s_magnetic_field
The observed magnetic field is highly asymmetrical.
Lines of inclination are highly elliptical, with the North Magnetic Pole situated near one end of the ellipse.
The strength of the magnetic field is no longer a maximum at the North Magnetic Pole. In fact, there are now two maxima, one over central Canada, the other over Siberia.
Magnetic meridians do not converge radially on the North Magnetic Pole.
At the end of the article it is stated:
“The real question we’re all looking at is,“Do the tiny changes that we see in various kinds of solar output over a sunspot cycle affect the climate?”
In my opinion, the real question is whether a whole sunspot cycle with weak magnetic activity (or rather a series of weak solar cycles like it happened during the Maunder minimum) makes a difference. In other words one should not look at tiny changes during one cycle but compare a period of several decennia of low magnetic activity with a multidecennial period of prolonged high solar activity like we had during much of the last century.
Has this question ever been analyzed properly?
I miss the aerosols in the cloud discussion.
Sulfor dioxide is less present today the 30 Years ago-in western countries.
Svensmark showed how aerosols and cosmic rays combined formed cloud seeds particles.
And we have seen this happening:http://journals.ametsoc.org/doi/pdf/10.1175/BAMS-D-11-00074.1
There is little doubt in my mind that normally any solar effect on climate on the single solar cycle timescale is obscured by the 60 year ocean cycles that we observe.
Sometimes the 11 year cycle might show up if the oceans are essentially neutral during a single cycle but that would be rare.
For about 30 years at a time El Nino dominates over La Nina and we see slight warming and then for another 30 years the reverse is true.
The solar effect really only shows up for periods of 60 years or longer and even then the only sign we will see is a slight shift between the relative strengths of El Ninos and La Ninas.
Thus a period of several active solar cycles will gradually inject more solar energy into the oceans so that from one warm 30 year ocean cycle to the next 30 year ocean cycle the power of El Ninos will increase slightly relative to La Ninas so that Earth’s temperature will rise slightly from one warm ocean cycle to the next. We see upward steps of that nature in the historical record..
The opposite for a period of several inactive solar cycles.
A key short term diagnostic indicator is the level of global cloudiness which results from the degree of zonality or meridionality of the jet stream tracks.
Several quiet solar cycles with increased meridionality and increased global cloudiness will eventually show up as a downward step in global temperatures from one cool 30 year ocean cycle to the next.
It is a pity that it will take so long to prove my point.
aprox 18% self reference bad, > 50% self eefeeence good, lol
That said, I find your take on the cosmuc rays/solar cycles very intriguing.
Welcome back from your tropical journeys!
One correction you need to make to your post Willis is, you say:
“One Kulmala team paper S17 cites is “Detecting charging state of ultra-fine particles: instrumental development and ambient measurements” (Laakso et al. 2007). S17 uses it in this context: “Cosmic rays are the main producers of ions in Earth’s lower atmosphere21.” (21 is the S17 reference list number for the Laakso et al. paper.) This is strange because Laakso et al. don’t say anything about cosmic rays.”
Actually reference 21 is to Laakso et al. 2004 and it says in section 1: “Galactic cosmic rays (GCR) are the primary ionization source above the oceans. The intensity of the cosmic rays in the atmosphere is modulated by the 11-year solar cycle. This modulation increases as a function of height (Larsen,1993).”
Laakso et al. 2007 is reference 23. Not 21.
Hi Willis, Thanks for the interesting posts I always enjoy them. Personally, I “believe” there are deeper interactions between the sun and the earth.
One piece I can’t get my head around is the complexity of the sun’s numerous activities and interactions effecting so many other complex earthly activities and processes, or not, or at variable levels. Even a short layman’s list for the sun includes flares, sunspots, CMEs, TSI, and magnetic variations. For the earth, we have potentially seasons, oceanic currents, volcanic eruptions, various gas compositions, cities and agricultural areas, meteor impacts, thunderstorms, hurricanes, etc. Still, there are the pesky issues around consistent measurement techniques and the use of proxies for longer term historic information.
Given all of that, I struggle to understand how much we can pull a meaningful signal out of any data. In the end, I struggle to support either point of view.
Other than it’s sunny and warm, and that is probably good for a walk along the Isar. Of course, that recently led to me getting my backside covered in snow, sleet and rain, all at the same time.
Can anyone clarify how any relatively straightforward analysis could be effective in such a complex situation?
The abstract of the recent Uranus paper (Solar-Driven Variation in the Atmosphere of Uranus) says:
The statistics show that 24% of the variance in reflectivity fluctuations at 472 nm is explained by GCR ion-induced nucleation, compared to 22% for a UV-only mechanism. Similar GCR-related variability exists in Neptune’s atmosphere; hence, the effects found at Uranus provide the first example of common variability in two planetary atmospheres driven through energetic particle modulation by their host star.
http://onlinelibrary.wiley.com/doi/10.1002/2017GL075374/abstract
Ari says: ‘The hypothesis of significant effect of cosmic-rays to climate has been shown wrong many times.’
Can these two statements both be correct?
I would say yes. The Uranus paper shows that both a UV-mechanism and a GCR-mechanism have similar explanation power. So the UV-mechanism could be right, the GCR-mechanism (Svensmark’s hypothesis) wrong and the Uranus data could still be explained by solar variability.
But we now have data that Neptune and Uranus reflectivity show in-phase solar cycle variability well above TSI variability. Solar System climate variability appears a possibility. Some people also reported on Mars having a parallel global warming to Earth while still on martian pre-industrial CO₂ levels.
There seems to be evidence of EUV variation on the solar cycle timescale.
http://www.uksolphys.org/uksp-nugget/65-euv-irradiances-across-a-solar-cycle/
Yes the sun effects the climate and yes galactic cosmic rays are part of the puzzle.
Again threshold levels are needed as well as duration of time which is why the solar/climate correlations are hard to detect unless the sun enters extreme periods of activity or lack of activity.
“The real question we’re all looking at is,“Do the tiny changes that we see in various kinds of solar output over a sunspot cycle affect the climate?””
Changes in the solar wind are far from being tiny, and do not regularly follow each sunspot cycle either, as the poloidal and toroidal solar magnetic fields shift in and out of phase.
Yogi Bear December 27, 2017 at 4:47 am
Thanks, Yogi. I just went and took a look. The only strong cycle in the solar wind data from here is at about 10.5 years … so I would dispute your claim that they don’t follow the sunspot cycle. It’s not as slavish a following of the sunspots as say TSI, but the sunspot cycle is the strongest cycle inherent in the solar wind data.
And as a result, IF the solar wind were changing any surface climate variables, once again we should see the familiar ~ 11-year cycle in the climate variables … but that’s what I’ve been unable to find.
As to the size of the changes, monthly plasma flow speed varies about the mean with a standard deviation of about ±12% of the mean. Not tiny, but not anywhere near the changes in the sunspot numbers themselves, which vary with a standard deviation of about ± 75% of the mean value. However, the solar wind changes are much larger than say the changes in TSI, which vary only by tenths of a percent.
Regards,
w.
“but the sunspot cycle is the strongest cycle inherent in the solar wind data”
Drivel, the solar wind is sometimes in phase with sunspot cycles, and at other times anti-phase with sunspot cycles. Which is why it is ridiculous to look for such a regular cyclicity within it, and why it cannot regularly follow ~11 year sunspot cycles.
“And as a result, IF the solar wind were changing any surface climate variables, once again we should see the familiar ~ 11-year cycle in the climate variables …”
No chance, because of the phase changes between the poloidal and toroidal solar magnetic fields. You are talking around the point of my original comment as if it didn’t exist.
“As to the size of the changes, monthly plasma flow speed varies about the mean with a standard deviation of about ±12% of the mean.”
Rubbish, it varies far more than that.
“Not tiny, but not anywhere near the changes in the sunspot numbers themselves, which vary with a standard deviation of about ± 75% of the mean value.”
What a thoroughly pointless statement.
Always plot ALL the data
http://www.leif.org/research/Solar-Wind-B-V-R.png
Leif says “Always plot ALL the data”
Of course as we should also include plasma density and pressure so we can see the phase change better.
Yogi Bear
a day ago
Thanks, Yogi. I was unaware that saying “drivel” had become a way to refute scientific facts.
What I based my statement on is my CEEMD analysis of some solar wind data. It shows little regularity at most frequencies. However, the strongest peak is at about ten and a half years. Now, you may not like that fact. And it is not what I’d call a dominant cycle. However, what I said was true. In fact, that cycle is the strongest cycle inherent in the solar wind data.
So … if you have a corresponding analysis that shows a stronger signal in the solar wind data from something else, now would be the time to break it out …
w.
Willis says:
“It shows little regularity at most frequencies. However, the strongest peak is at about ten and a half years. Now, you may not like that fact. And it is not what I’d call a dominant cycle. However, what I said was true. In fact, that cycle is the strongest cycle inherent in the solar wind data.”
If you look at the graphed data, it is well apparent that the major low in the solar wind strength can be around a year after sunspot minimum, or at sunspot maximum, it changes with the phase reversals. That’s why it’s not a dominant cycle. The major high also shifts according to the phase. Moreover, the overall geometry of the solar wind with respect to sunspot cycles inverts as the toroidal and poloidal fields change respective phase.
So your original claim that:
“And as a result, IF the solar wind were changing any surface climate variables, once again we should see the familiar ~ 11-year cycle in the climate variables …”
is missing the point entirely, as you’re only looking at a small part of the signal which is quasi-regular, and neglecting the bulk of the signal that the climate should be following, but which is sometimes in phase with sunspot cycles, and sometimes anti-phase with sunspot cycles.
“So … if you have a corresponding analysis that shows a stronger signal in the solar wind data from something else, now would be the time to break it out …”
There should not be a stronger signal, because of the phase reversals.
Th solar wind speed [what you call the ‘strength’] is not the important parameter for cosmic rays, which is the magnetic field strength that does show an 11-yr variation.
Here is how the average solar wind parameters vary over the cycle:
http://www.leif.org/research/Solar-Wind-Climatology.png
“Th solar wind speed [what you call the ‘strength’] is not the important parameter for cosmic rays..”
Yes Leif I already know that thanks, it is an additional reason why I don’t support Svensmark’s ideas, the main one being that cloud cover has reduced while GCR;s have increased.
Monthly plasma flow speed reached around 575 km/s mid 2003. and around 335 km/s late 2009, that’s over +/- 20% variability about the mean.
And daily to weekly plasma flow speeds vary even more.
Willis,
My attention-getters sound off when I read statements about trying to match cloud cover and CR flux. The elephant in the woodpile is albedo change, not gross cloud amounts measured, if my experience is anything to go by, by a met man wandering outside his office and staring vaguely at the sky. I’d bet a small pint on the data being insufficiently accurate to make any sense of a signal which would only need 2% change to be sufficient to explain the (NotNeccesarilyA)GW signal. We have the technology to measure changes in albedo and have had for years but the online graphs don’t seem very detailed.
While I’m here… You have sailed a lot and must have seen oil/surfactant smooths. Can you explain a huge smooth I saw from 40,000ft while flying down to Madeira? It was well over 100 miles wide and hundreds of miles long, sufficiently robust to resist a force 4 wind, suppressing wave action inside the huge, meandering smoothed areas while outside the waves were breaking as would be expected. No waves, no salt aerosols… Most smooths can be blamed on river run-off etc, but not this one. I was wondering if there might be some geological explanation.
RGB at Duke wrote to me that there weren’t any smooths where he sailed, so I sent him a nice image from the web showing perfectly obvious ones visible from his office window*. Have a brief look, these things are everywhere.
JF
*He declined to repeat Benjamin Franklin’s Clapham Pond experiment.
Julian, always good to hear from you.
You are correct that the question is albedo change. However, we have very few albedo datasets. which makes it hard.
And what makes it even harder is that in the all-important tropics, where the majority of the energy enters the system, albedo is highly correlated with temperature.
Having said that, IF the sunspot cycles are indeed affecting the climate, we should see eleven year cycles somewhere. And to date, I’ve looked everywhere I can think of, including clouds, and not found anything.
As to the other question regarding the origin of a large slick, the first two possibilities that come to my mind are either submarine oil from either drilling or natural seeps … or more likely in my mind given the large area covered, oils or other surfactants produced by plankton. Let me take a look … yeah, I find this along with much more:
So a slick like that could easily be the result of a large phytoplankton bloom. It might be possible to find data on that, because the satellites inter alia measure the chlorophyll in the ocean and can see such blooms from space …
Best regards,
w.
PS—Thanks for the hint about Ben Franklin and the Clapham Pond experiment. Despite being aware of the effect of oil on the ocean waves from being a mariner, I was unaware of his experiments entirely. Fascinating.
Could the ‘smooth’ you saw have been the Canary Current (cold upwelling) in combination with a wind from the north? https://en.wikipedia.org/wiki/Canary_Current