Guest Post by Willis Eschenbach
Last week, Anthony highlighted a study by Svensmark, Shaviv et al. in a post entitled New paper: The missing link between cosmic rays, clouds, and climate change on Earth. While some were enthusiastic about their claims, Leif Svalgaard and I were much more restrained in our opinions.
As a result, I was interested in an analysis of the Svensmark et al. paper by Ari Jokimäki over at his always interesting blog, The AGW Observer. I’ve shamelessly stolen his text and graphics, which I reproduce below. I trust Ari won’t mind since I’ve quoted him in full and provided the links to his website.
Some curious things about Svensmark et al. reference list
Posted by Ari Jokimäki on December 22, 2017
The hypothesis of significant effect of cosmic-rays to climate has been shown wrong many times. This is a pet hypothesis of Henrik Svensmark, who continues to push papers on the subject to scientific journals. A few days ago, the journal Nature Communications published a paper of Svensmark (& co-workers). I checked out its reference list because I think that some indicators of the quality of a paper can be found simply by checking the reference list, and how references are used.
S17 reference list – first impressionsI immediately noticed a few things about S17 reference list. I made some tweets (@AGWobserver) where I mention them:
The Kulmala et al. paper I mention there is this one: “Atmospheric data over a solar cycle: no connection between galactic cosmic rays and new particle formation”. It shows results against Svensmark’s hypothesis, but it is not cited by S17. The mentioned paper list in my tweets is this one: “Papers on the non-significant role of cosmic rays in climate”.
One Kulmala team paper S17 cites is “Detecting charging state of ultra-fine particles: instrumental development and ambient measurements” (Laakso et al. 2007). S17 uses it in this context: “Cosmic rays are the main producers of ions in Earth’s lower atmosphere21.” (21 is the S17 reference list number for the Laakso et al. paper.) This is strange because Laakso et al. don’t say anything about cosmic rays. Cosmic rays are mentioned only in their reference list in the title of Eichkorn et al. (2002) paper, and Laakso et al. refer to it in this context: “Ion mass spectrometers have been used successfully in the studies of new particle formation in the upper atmosphere (Eichkorn et al., 2002).” Furthermore, as Svensmark’s cosmic ray hypothesis relies on ion induced nucleation, it is noteworthy that one of Laakso et al. conclusions is this: “During a large fraction of days considered here, the contribution of ion-induced nucleation to the total nucleation rate was either negligible or relatively small.” To me it seems that either S17 is citing a wrong paper here, or then the cosmic ray ion production thing is implicitly in Laakso et al. results and I just don’t see it.
S17 reference list – comparison with other paper
I decided to look S17 reference list further. I chose a comparison paper, Gordon et al. (2017, “G17”), which is a research paper on the same issue than S17. Both papers have been published and submitted to their journals during 2017, S17 in May 10 and G17 in March 24, so S17 is a bit newer in that sense. S17 was published in December 19 and G17 in August 24, so also in that sense S17 is newer. I emphasize newer here because it suggests that references in S17 reference list should be as new or newer as references in G17 reference list.
The reference list of S17 contains 39 entries while the reference list of G17 contains 85 entries. As the papers are on the same subject, it seems that S17 reference list is a little short. However, scope of G17 seems to be somewhat broader, so reference list length doesn’t necessarily tell anything.
I also compared the temporal distributions of papers in the reference lists of these two papers. Result can be seen in this graph:
It is quite clear from the graph that S17 reference list focuses on older papers than G17 reference list. highest peak of temporal distribution of S17 is 2005-2009, while corresponding highest peak of G17 is 2010-2014. Also, G17 distribution is rather sharply concentrated on the more recent times, while S17 distribution is more spread out in time, and it almost seems as if the most recent research is being avoided in S17 reference list (the share of 2015-2017 papers is very low in S17 compared to G17).


[UPDATE]: An alert reader in the comments notes that he has retracted his claim about the one reference, viz:
(Note added December 27, 2017: This paragraph is incorrect – S17 cites two Laakso et al. papers and I somehow got them mixed.) One Kulmala team paper S17 cites is “Detecting charging state of ultra-fine particles: instrumental development and ambient measurements” (Laakso et al. 2007). S17 uses it in this context: “Cosmic rays are the main producers of ions in Earth’s lower atmosphere21.” (21 is the S17 reference list number for the Laakso et al. paper.) This is strange because Laakso et al. don’t say anything about cosmic rays. Cosmic rays are mentioned only in their reference list in the title of Eichkorn et al. (2002) paper, and Laakso et al. refer to it in this context: “Ion mass spectrometers have been used successfully in the studies of new particle formation in the upper atmosphere (Eichkorn et al., 2002).” Furthermore, as Svensmark’s cosmic ray hypothesis relies on ion induced nucleation, it is noteworthy that one of Laakso et al. conclusions is this: “During a large fraction of days considered here, the contribution of ion-induced nucleation to the total nucleation rate was either negligible or relatively small.” To me it seems that either S17 is citing a wrong paper here, or then the cosmic ray ion production thing is implicitly in Laakso et al. results and I just don’t see it.
I love seeing this, that when a mistake is made it is acknowledged and clearly corrected. His second point still stands … as does his point about Laakso saying that “During a large fraction of days considered here, the contribution of ion-induced nucleation to the total nucleation rate was either negligible or relatively small.”
[END UPDATE]
Short and filled with information, typical of Ari’s good work … you can go to the post to see the (3) comments, part of the reason I thought it deserved wider circulation. In addition, I’ve grabbed and reposted below the list of papers that he linked to above that show no effect of cosmic rays on the climate. In that regard, my own research agrees with those papers, although I went about it a different way. I looked for the signature of the ~ 11-year cycles in sunspots. This, of course, would detect such an influence whether or not it was from cosmic rays. Here’s Ari’s list:
Papers on the non-significant role of cosmic rays in climate
Posted by Ari Jokimäki on August 31, 2009
This list contains papers which show that cosmic rays don’t have significant role in recent climate change, so this list doesn’t contain the papers from Svensmark et al. or other papers symphatetic to the strong role for cosmic rays, but such papers and issues are discussed in papers below (see also Anti-AGW papers debunked section for some Svensmark et al. papers). The list is not complete, and will most likely be updated in the future in order to make it more thorough and more representative.
LATEST UPDATE (December 25, 2012): Laken et al. (2012) added.
A cosmic ray-climate link and cloud observations – Laken et al. (2012) “Despite over 35 years of constant satellite-based measurements of cloud, reliable evidence of a long-hypothesized link between changes in solar activity and Earth’s cloud cover remains elusive. This work examines evidence of a cosmic ray cloud link from a range of sources, including satellite-based cloud measurements and long-term ground-based climatological measurements. The satellite-based studies can be divided into two categories: (1) monthly to decadal timescale analysis and (2) daily timescale epoch-superpositional (composite) analysis. The latter analyses frequently focus on sudden high-magnitude reductions in the cosmic ray flux known as Forbush decrease events. At present, two long-term independent global satellite cloud datasets are available (ISCCP and MODIS). Although the differences between them are considerable, neither shows evidence of a solar-cloud link at either long or short timescales. Furthermore, reports of observed correlations between solar activity and cloud over the 1983–1995 period are attributed to the chance agreement between solar changes and artificially induced cloud trends. It is possible that the satellite cloud datasets and analysis methods may simply be too insensitive to detect a small solar signal. Evidence from ground-based studies suggests that some weak but statistically significant cosmic ray-cloud relationships may exist at regional scales, involving mechanisms related to the global electric circuit. However, a poor understanding of these mechanisms and their effects on cloud makes the net impacts of such links uncertain. Regardless of this, it is clear that there is no robust evidence of a widespread link between the cosmic ray flux and clouds.” Benjamin A. Laken, Enric Pallé, Jaša Čalogović and Eimear M. Dunne, J. Space Weather Space Clim. 2 (2012) A18, DOI: http://dx.doi.org/10.1051/swsc/2012018. [http://www.swsc-journal.org/articles/swsc/pdf/2012/01/swsc120049.pdf”>Full text]
Solar irradiance, cosmic rays and cloudiness over daily timescales – Laken & Čalogović (2011) “Although over centennial and greater timescales solar variability may be one of the most influential climate forcing agents, the extent to which solar activity influences climate over shorter time periods is poorly understood. If a link exists between solar activity and climate, it is likely via a mechanism connected to one (or a combination) of the following parameters: total solar irradiance (TSI), ultraviolet (UV) spectral irradiance, or the galactic cosmic ray (GCR) flux. We present an analysis based around a superposed epoch (composite) approach focusing on the largest TSI increases and decreases (the latter occurring in both the presence and absence of appreciable GCR reductions) over daily timescales. Using these composites we test for the presence of a robust link between solar activity and cloud cover over large areas of the globe using rigorous statistical techniques. We find no evidence that widespread variations in cloud cover at any tropospheric level are significantly associated with changes in the TSI, GCR or UV flux, and further conclude that TSI or UV changes occurring during reductions in the GCR flux are not masking a solar-cloud response. However, we note the detectability of any potential links is strongly constrained by cloud variability.” Laken, B. A. and J. Čalogović(2011), Geophys. Res. Lett., 38, L24811, doi:10.1029/2011GL049764. [Full text]
Relationship of Lower Troposphere Cloud Cover and Cosmic Rays: An Updated Perspective – Agee et al. (2011) “An updated assessment has been made of the proposed hypothesis that “galactic cosmic rays (GCRs) are positively correlated with lower troposphere global cloudiness.” A brief review of the many conflicting studies that attempt to prove or disprove this hypothesis is also presented. It has been determined in this assessment that the recent extended quiet period (QP) between solar cycles 23–24 has led to a record high level of GCRs, which in turn has been accompanied by a record low level of lower troposphere global cloudiness. This represents a possible observational disconnect, and the update presented here continues to support the need for further research on the GCR-Cloud hypothesis and its possible role in the science of climate change.” Ernest M. Agee, Kandace Kiefer and Emily Cornett, Journal of Climate 2011, doi: 10.1175/JCLI-D-11-00169.1.
The contribution of cosmic rays to global warming – Sloan & Wolfendale (2011) “A search has been made for a contribution of the changing cosmic ray intensity to the global warming observed in the last century. The cosmic ray intensity shows a strong 11 year cycle due to solar modulation and the overall rate has decreased since 1900. These changes in cosmic ray intensity are compared to those of the mean global surface temperature to attempt to quantify any link between the two. It is shown that, if such a link exists, the changing cosmic ray intensity contributes less than 8% to the increase in the mean global surface temperature observed since 1900.” T. Sloan and A.W. Wolfendale, Journal of Atmospheric and Solar-Terrestrial Physics, doi:10.1016/j.jastp.2011.07.013. [Full text]
Cosmic ray effects on cloud cover and their relevance to climate change – Erlykin et al. (2011)“A survey is made of the evidence for and against the hypothesis that cosmic rays influence cloud cover. The analysis is made principally for the troposphere. It is concluded that for the troposphere there is only a very small overall value for the fraction of cloud attributable to cosmic rays (CR); if there is linearity between CR change and cloud change, the value is probably ~1% for clouds below ~6.5km, but less overall. The apparently higher value for low cloud is an artifact. The contribution of CR to ’climate change’ is quite negligible.” A.D. Erlykin, B.A. Laken and A.W. Wolfendale, Journal of Atmospheric and Solar-Terrestrial Physics, doi:10.1016/j.jastp.2011.03.001.
Cosmic rays and global warming – Erlykin et al. (2010) A brief review article. “Is global warming man made or is it caused by the effects of solar activity on cosmic rays as claimed by some? Here we describe our search for evidence to distinguish between these claims. … In our view the jury is back and the verdict is that cosmic rays and solar irradiance are not guilty for most of the Global Warming. Nevertheless, they could be responsible for a contribution and we look forward to future experiments such as CLOUD at CERN which should be able to quantify to what extent ionization plays a part in the production of aerosols, the precursors of cloud formation.”[Full text]
Sudden Cosmic Ray Decreases: No Change of Global Cloud Cover – Calogovic et al. (2010)“Here we report on an alternative and stringent test of the CRC-hypothesis by searching for a possible influence of sudden GCR decreases (so-called Forbush decreases) on clouds. We find no response of global cloud cover to Forbush decreases at any altitude and latitude.”[Full text]
Cosmic ray decreases and changes in the liquid water cloud fraction over the oceans – Laken et al. (2009)“Svensmark et al. (2009) have recently claimed that strong galactic cosmic ray (GCR) decreases during ‘Forbush Decrease (FD) events’ are followed by decreases in both the global liquid water cloud fraction (LCF) and other closely correlated atmospheric parameters. To test the validity of these findings we have concentrated on just one property, the MODIS LCF and examined two aspects: 1) The statistical chance that the decrease observed in the LCF is abnormal. 2) The likelihood of the observed delay (∼5 to 9 days) being physically connected to the FD events. On both counts we conclude that LCF variations are unrelated to FD events: Both the pattern and timing of observed LCF changes are irreconcilable with current theoretical pathways. Additionally, a zonal analysis of LCF variations also offers no support to the claimed relationship, as the observed anomaly is not found to vary latitudinally in conjunction with cosmic ray intensity.”[Full text]
Results from the CERN pilot CLOUD experiment – Duplissy et al. (2009)“During a 4-week run in October–November 2006, a pilot experiment was performed at the CERN Proton Synchrotron in preparation for the CLOUD1 experiment, whose aim is to study the possible influence of cosmic rays on clouds. … Overall, the exploratory measurements provide suggestive evidence for ion-induced nucleation or ion-ion recombination as sources of aerosol particles. … In conclusion, therefore, the experimental variables were not well enough controlled to exclude the presence of ion-induced nucleation on the basis of Fig. 7; it merely does not support the presence of strong contributions from this source.”[Full text]
On the correlation between cosmic ray intensity and cloud cover – Erlykin et al. (2009)“Various aspects of the connection between cloud cover (CC) and cosmic rays (CR) are analyzed. Most features of this connection viz. an altitude dependence of the absolute values of CC and CR intensity, no evidence for the correlation between the ionization of the atmosphere and cloudiness, the absence of correlations in short-term low cloud cover (LCC) and CR variations indicate that there is no direct causal connection between LCC and CR in spite of the evident long-term correlation between them. … The most significant argument against causal connection of CR and LCC is the anticorrelation between LCC and the medium cloud cover (MCC).”[Full text]
Atmospheric data over a solar cycle: no connection between galactic cosmic rays and new particle formation – Kulmala et al. (2009)“More than a decade ago, variations in galactic cosmic rays were suggested to closely correlate with variations in atmospheric cloud cover and therefore constitute a driving force behind aerosol-cloud-climate interactions. Later, the enhancement of atmospheric aerosol particle formation by ions generated from cosmic rays was proposed as a physical mechanism explaining this correlation. Here, we report unique observations on atmospheric aerosol formation based on measurements at the SMEAR II station, Finland, over a solar cycle (years 1996–2008) that shed new light on these presumed relationships. Our analysis shows that none of the quantities related to aerosol formation correlates with the cosmic ray-induced ionisation intensity (CRII). We also examined the contribution of ions to new particle formation on the basis of novel ground-based and airborne observations. A consistent result is that ion-induced formation contributes typically less than 10% to the number of new particles, which would explain the missing correlation between CRII and aerosol formation.”[Full text]
Can cosmic rays affect cloud condensation nuclei by altering new particle formation rates? – Pierce & Adams (2009)“In this paper, we present the first calculations of the magnitude of the ion-aerosol clear-air mechanism using a general circulation model with online aerosol microphysics. In our simulations, changes in CCN from changes in cosmic rays during a solar cycle are two orders of magnitude too small to account for the observed changes in cloud properties; consequently, we conclude that the hypothesized effect is too small to play a significant role in current climate change.”
On the possible connection between cosmic rays and clouds – Erlykin et al. (2009)“Various aspects of the connection between cloud cover (CC) and cosmic rays (CR) are analysed. We argue that the anticorrelation between the temporal behaviour of low (LCC) and middle (MCC) clouds evidences against causal connection between them and CR. Nevertheless, if a part of low clouds (LCC) is connected and varies with CR, then its most likely value averaged over the Globe should not exceed 20% at the two standard deviation level.”[Full text]
Solar activity and the mean global temperature – Erlykin et al. (2009) This study finds that the changes in the cosmic ray rate lags the changes in temperature. “The cyclic variation in the cosmic ray rate is observed to be delayed by 2–4 years relative to the temperature, the solar irradiance and daily sun spot variations suggesting that the origin of the correlation is more likely to be direct solar activity than cosmic rays. Assuming that the correlation is caused by such solar activity, we deduce that the maximum recent increase in the mean surface temperature of the Earth which can be ascribed to this activity is ~<14% of the observed global warming.”[Full text]
Cosmic rays, cloud condensation nuclei and clouds – a reassessment using MODIS data – Kristjánsson et al. (2008)“Averaging the results from the 22 Forbush decrease events that were considered, no statistically significant correlations were found between any of the four cloud parameters and GCR, when autocorrelations were taken into account.”[Full text]
Testing the proposed causal link between cosmic rays and cloud cover – Sloan & Wolfendale (2008)“A decrease in the globally averaged low level cloud cover, deduced from the ISCCP infrared data, as the cosmic ray intensity decreased during the solar cycle 22 was observed by two groups. The groups went on to hypothesize that the decrease in ionization due to cosmic rays causes the decrease in cloud cover, thereby explaining a large part of the currently observed global warming. We have examined this hypothesis to look for evidence to corroborate it. None has been found and so our conclusions are to doubt it. From the absence of corroborative evidence, we estimate that less than 23%, at the 95% confidence level, of the 11 year cycle change in the globally averaged cloud cover observed in solar cycle 22 is due to the change in the rate of ionization from the solar modulation of cosmic rays. “[Full text]
Cosmic Rays and The Climate – Sloan (2008) Summarizes different views on the issue. “A number of papers and posters were presented at the ECRS on the subject of the relationship between cosmic rays (CR) and both the climate and the weather. I was asked by the organisers to attempt to summarise them.”[Full text]
Cosmic Rays and Global Warming – Sloan & Wolfendale (2007)“It has been claimed by others that observed temporal correlations of terrestrial cloud cover with `the cosmic ray intensity’ are causal. The possibility arises, therefore, of a connection between cosmic rays and Global Warming. If true, the implications would be very great. We have examined this claim to look for evidence to corroborate it. So far we have not found any and so our tentative conclusions are to doubt it. Such correlations as appear are more likely to be due to the small variations in solar irradiance, which, of course, correlate with cosmic rays. We estimate that less than 15% of the 11-year cycle warming variations are due to cosmic rays and less than 2% of the warming over the last 35 years is due to this cause.”[Full text]
Solar activity, cosmic rays, clouds and climate – an update – Kristjánsson et al. (2004)“Eighteen years of monthly averaged low cloud cover data from the International Satellite Cloud Climatology Project are correlated with both total solar irradiance and galactic cosmic ray flux from neutron monitors. When globally averaged low cloud cover is considered, consistently higher correlations (but with opposite sign) are found between low cloud variations and solar irradiance variations than between variations in cosmic ray flux and low cloud cover.”[Full text]
Pattern of Strange Errors Plagues Solar Activity and Terrestrial Climate Data – Damon & Laut (2004)“Links have been made between cosmic rays and cloud cover, first total cloud cover and then only low clouds, and between solar cycle lengths and northern hemisphere land temperatures. … Analysis of a number of published graphs that have played a major role in these debates and that have been claimed to support solar hypotheses shows that the apparent strong correlations displayed on these graphs have been obtained by incorrect handling of the physical data.”[Full text]
Solar activity and terrestrial climate: an analysis of some purported correlations – Laut (2003)“The last decade has seen a revival of various hypotheses claiming a strong correlation between solar activity and a number of terrestrial climate parameters: Links between cosmic rays and cloud cover, first total cloud cover and then only low clouds, and between solar cycle lengths and Northern Hemisphere land temperatures. These hypotheses play an important role in the scientific as well as in the public debate about the possibility or reality of a man-made global climate change. I have analyzed a number of published graphs which have played a major role in these debates and which have been claimed to support solar hypotheses. My analyses show that the apparent strong correlations displayed on these graphs have been obtained by an incorrect handling of the physical data.”[Full text]
Cosmic Rays, Clouds, and Climate – Carslaw et al. (2002) A review paper. “It has been proposed that Earth’s climate could be affected by changes in cloudiness caused by variations in the intensity of galactic cosmic rays in the atmosphere. This proposal stems from an observed correlation between cosmic ray intensity and Earth’s average cloud cover over the course of one solar cycle. Some scientists question the reliability of the observations, whereas others, who accept them as reliable, suggest that the correlation may be caused by other physical phenomena with decadal periods or by a response to volcanic activity or El Niño.”[Full text]
A new look at possible connections between solar activity, clouds and climate – Kristjánsson et al. (2002)“We present a re-evaluation of the hypothesis of a coupling between galactic cosmic rays, clouds and climate. We have used two independent estimates of low cloud cover from the International Satellite Cloud Climatology Project, covering 16.5 years of data. The cloud cover data are used in conjunction with estimates of galactic cosmic ray flux and measurements of solar irradiance. It is found that solar irradiance correlates better and more consistently with low cloud cover than cosmic ray flux does. The correlations are considerably lower when multichannel retrievals during daytime are used than retrievals using IR-channels only.”[Full text]
Some results relevant to the discussion of a possible link between cosmic rays and the Earth’s climate – Wagner et al. (2001)“However, the smoothed combined flux of 10Be and 36Cl at Summit, Greenland, from 20–60 kyr B.P. (proportional to the geomagnetically modulated cosmic ray flux) is unrelated to the corresponding δ18O and CH4 data (interpreted as supraregional climate proxies). (3) Furthermore, although a comparison of the incoming neutron flux with cloud cover in Switzerland over the last 5 decades shows a significant correlation at times during the 1980s and 1990s, this does not occur during the rest of the period.”[Full text]
Sunshine records from Ireland: cloud factors and possible links to solar activity and cosmic rays – Pallé & Butler (2001)“The importance of cosmic rays as a link between solar activity and climate was assessed from a study of the ISCCP-D2 satellite cloud factors and Irish sunshine data. Whilst these results confirmed the strong correlation between total cloud factor and cosmic rays over non-tropical oceans between 1984 and 1991 previously reported, it was found that this correlation did not hold in the subsequent period 1991-1994. Other work has established a link through specifically low cloud. Indirect evidence of cloud formation by cosmic rays from a variation in the sunshine factor following Forbush decreases, and over the sunspot cycle, was mostly negative. Although a dip at seven years past sunspot minimum is evident in the sunshine factor for all four sites and in most seasons, it is of marginal statistical significance.”[Full text]
Cloud cover variations over the United States: An influence of cosmic rays or solar variability? – Udelhofen & Cess (2001)“To investigate whether galactic cosmic rays (GCR) may influence cloud cover variations, we analyze cloud cover anomalies from 1900–1987 over the United States. … The cloud cover variations are in phase with the solar cycle and not the GCR.”
Is there a cosmic ray signal in recent variations in global cloudiness and cloud radiative forcing? – Kristjánsson et al. (2000)“In order to evaluate a recent hypothesis of a coupling between galactic cosmic rays, clouds, and climate we have investigated temporal variations in global cloudiness and radiative fluxes at the top of the atmosphere. … When the results are related to temporal variations in cosmic ray activity, we do not find support for a coupling between cosmic rays, total cloudiness, and radiative forcing of climate. … The net radiative effect of clouds during the period 1985–1989 shows an enhanced cooling effect despite a reduction in both total and low cloud cover. This contradicts the simple relationship between cloud cover and radiation assumed in the cosmic-ray-cloud-climate hypothesis.”
Are Cosmic Rays Influencing Oceanic Cloud Coverage – Or Is It Only El Niño? – Farrar (2000)“The monthly average (C2) cloud coverage data produced by the International Satellite Cloud Climatology Project (ISCCP) for the period of July 1986–June 1991 show strong global and regional cloud coverage variations associated with the El Niño of 1986–1987. The Pacific Ocean, in particular, shows strong regional variations in cloud coverage. These agree well with contemporaneous satellite observations of broadband shortwave infrared cloud forcing measured by the Earth Radiation Budget Experiment. Svensmark and Friis-Christensen (1997) noted a similarity between the shape of the timeseries curve of average cloud coverage fraction for mid- to low-latitude ocean-areas and the time series curve of cosmic ray flux intensity. They proposed a causal relationship – a `missing link’ for solar cycle influence on Earth climate. Further spatial and temporal analysis of the same ISCCP C2 data in this paper indicates that the cloud coverage variation patterns are those to be expected for the atmospheric circulation changes characteristic of El Niño, weakening the case for cosmic rays as a climatic forcing factor.”
Closely related
Testing the link between terrestrial climate change and Galactic spiral arm transit – Overholt et al. (2009) Tests the correlation of climate changes and Earth’s passage through spiral arms of the Milky Way. Possible climate effects largely relate to cosmic rays. “We re-examine past suggestions of a close link between terrestrial climate change and the Sun’s transit of spiral arms in its path through the Milky Way galaxy. These links produced concrete fits, deriving the unknown spiral pattern speed from terrestrial climate correlations. We test these fits against new data on spiral structure based on CO data that do not make simplifying assumptions about symmetry and circular rotation. If we compare the times of these transits with changes in the climate of Earth, the claimed correlations not only disappear, but we also find that they cannot be resurrected for any reasonable pattern speed.”[Full text]
Toward Direct Measurement of Atmospheric Nucleation – Kulmala et al. (2007) A paper on the results of SMEAR project which (among other activities) provides direct measurements of atmospheric nucleation. They find that ion-induced nucleation is not very important (ion-induced nucleation fraction is only 10 % of total nucleation at best). “We introduce an instrumental setup to measure atmospheric concentrations of both neutral and charged nanometer-sized clusters. By applying the instruments in the field, we come to three important conclusions: … (iii) neutral nucleation dominates over the ion-induced mechanism, at least in boreal forest conditions.”
For those interested in the SMEAR project results, see the presentation of Markku Kulmala in “Climate Change – Man Made?” seminar in Stockholm (2009) (click the “cosmic rays and climate change”, Kulmala’s presentation starts after Svensmark’s, about at 00:34:15).
There are plenty of papers which deal with this cosmic ray issue while concentrating solar forcing as a whole (for example a string of papers from Lockwood & Fröhlich). Many of those papers would belong to the list above, but I shall make a separate entry on them, and add link to that post here when I have made it (separate post is already on the works). UPDATE (September 3, 2009): Here is the link to the post about the Sun’s role.
Original claims of Svensmark et al. were based on the apparent correlation between the cosmic rays and an observed decreasing trend in ISCCP cloud cover data, but it has been found out that ISCCP trend was an artifact of satellite viewing geometry, so it seems that there is no observational basis for the original claim. [UPDATE (March 17, 2010): I have recently discussed about this here.] There are few papers discussing this, and I will give one of them below.
Arguments against a physical long-term trend in global ISCCP cloud amounts – Evan et al. (2007)“Here we show that trends observed in the ISCCP data are satellite viewing geometry artifacts and are not related to physical changes in the atmosphere. Our results suggest that in its current form, the ISCCP data may not be appropriate for certain long-term global studies, especially those focused on trends.”[Full text]
UPDATE (September 10, 2009): As it has been suggested that cosmic rays affect by changing the cloud cover, this is relevant here:
Finally, here are my own researches into the same question. Remember, the question is NOT “Does the sun affect the climate?” The answer to that one is clearly “Yes“, because without a sun we wouldn’t have a climate.
The real question we’re all looking at is,“Do the tiny changes that we see in various kinds of solar output over a sunspot cycle affect the climate?”. All the research I’ve done says the answer is no, which was a huge surprise to me. Having read about wheat prices and sunspots when I was a kid, I thought it would be easy to find modern data to substantiate those centuries-old claims … man, was I surprised. Here are my findings:
Congenital Cyclomania Redux 2013-07-23
Well, I wasn’t going to mention this paper, but it seems to be getting some play in the blogosphere. Our friend Nicola Scafetta is back again, this time with a paper called “Solar and planetary oscillation control on climate change: hind-cast, forecast and a comparison with the CMIP5 GCMs”. He’s…
Cycles Without The Mania 2013-07-29
Are there cycles in the sun and its associated electromagnetic phenomena? Assuredly. What are the lengths of the cycles? Well, there’s the question. In the process of writing my recent post about cyclomania, I came across a very interesting paper entitled “Correlation Between the Sunspot Number, the Total Solar Irradiance,…
Sunspots and Sea Level 2014-01-21
I came across a curious graph and claim today in a peer-reviewed scientific paper. Here’s the graph relating sunspots and the change in sea level: And here is the claim about the graph: Sea level change and solar activity A stronger effect related to solar cycles is seen in Fig.…
Riding A Mathemagical Solarcycle 2014-01-22
Among the papers in the Copernicus Special Issue of Pattern Recognition in Physics we find a paper from R. J. Salvador in which he says he has developed A mathematical model of the sunspot cycle for the past 1000 yr. Setting aside the difficulties of verification of sunspot numbers for…
Sunny Spots Along the Parana River 2014-01-25
In a comment on a recent post, I was pointed to a study making the following surprising claim: Here, we analyze the stream flow of one of the largest rivers in the world, the Parana ́ in southeastern South America. For the last century, we find a strong correlation with…
Usoskin Et Al. Discover A New Class of Sunspots 2014-02-22
There’s a new post up by Usoskin et al. entitled “Evidence for distinct modes of solar activity”. To their credit, they’ve archived their data, it’s available here. Figure 1 shows their reconstructed decadal averages of sunspot numbers for the last three thousand years, from their paper: Figure 1. The results…
Solar Periodicity 2014-04-10
I was pointed to a 2010 post by Dr. Roy Spencer over at his always interesting blog. In it, he says that he can show a relationship between total solar irradiance (TSI) and the HadCRUT3 global surface temperature anomalies. TSI is the strength of the sun’s energy at a specified distance…
Cosmic Rays, Sunspots, and Beryllium 2014-04-13
In investigations of the past history of cosmic rays, the deposition rates (flux rates) of the beryllium isotope 10Be are often used as a proxy for the amount of cosmic rays. This is because 10Be is produced, inter alia, by cosmic rays in the atmosphere. Being a congenitally inquisitive type…
The Tip of the Gleissberg 2014-05-17
A look at Gleissberg’s famous solar cycle reveals that it is constructed from some dubious signal analysis methods. This purported 80-year “Gleissberg cycle” in the sunspot numbers has excited much interest since Gleissberg’s original work. However, the claimed length of the cycle has varied widely.
The Effect of Gleissberg’s “Secular Smoothing” 2014-05-19
ABSTRACT: Slow Fourier Transform (SFT) periodograms reveal the strength of the cycles in the full sunspot dataset (n=314), in the sunspot cycle maxima data alone (n=28), and the sunspot cycle maxima after they have been “secularly smoothed” using the method of Gleissberg (n = 24). In all three datasets, there…
It’s The Evidence, Stupid! 2014-05-24
I hear a lot of folks give the following explanation for the vagaries of the climate, viz: It’s the sun, stupid. And in fact, when I first started looking at the climate I thought the very same thing. How could it not be the sun, I reasoned, since obviously that’s…
Sunspots and Sea Surface Temperature 2014-06-06
I thought I was done with sunspots … but as the well-known climate scientist Michael Corleone once remarked, “Just when I thought I was out … they pull me back in”. In this case Marcel Crok, the well-known Dutch climate writer, asked me if I’d seen the paper from Nir…
Maunder and Dalton Sunspot Minima 2014-06-23
In a recent interchange over at Joanne Nova’s always interesting blog, I’d said that the slow changes in the sun have little effect on temperature. Someone asked me, well, what about the cold temperatures during the Maunder and Dalton sunspot minima? And I thought … hey, what about them? I…
Changes in Total Solar Irradiance 2014-10-25
Total solar irradiance, also called “TSI”, is the total amount of energy coming from the sun at all frequencies. It is measured in watts per square metre (W/m2). Lots of folks claim that the small ~ 11-year variations in TSI are amplified by some unspecified mechanism, and thus these small changes in TSI make an…
Splicing Clouds 2014-11-01
So once again, I have donned my Don Quijote armor and continued my quest for a ~11-year sunspot-related solar signal in some surface weather dataset. My plan for the quest has been simple. It is based on the fact that all of the phenomena commonly credited with affecting the temperature,…
Volcanoes and Sunspots 2015-02-09
I keep reading how sunspots are supposed to affect volcanoes. In the comments to my last post, Tides, Earthquakes, and Volcanoes, someone approvingly quoted a volcano researcher who had looked at eleven eruptions of a particular type and stated: …. Nine of the 11 events occurred during the solar inactive phase…
Early Sunspots and Volcanoes 2015-02-10
Well, as often happens I started out in one direction and then I got sidetractored … I wanted to respond to Michele Casati’s claim in the comments of my last post. His claim was that if we include the Maunder Minimum in the 1600’s, it’s clear that volcanoes with a…
Sunspots and Norwegian Child Mortality 2015-03-07
In January there was a study published by The Royal Society entitled “Solar activity at birth predicted infant survival and women’s fertility in historical Norway”, available here. It claimed that in Norway in the 1700s and 1800s the solar activity at birth affected a child’s survival chances. As you might imagine, this…
The New Sunspot Data And Satellite Sea Levels 2015-08-13
[UPDATE:”Upon reading Dr. Shaviv’s reply to this post, I have withdrawn any mention of “deceptive” from this post. This term was over the top, as it ascribed motive to the authors. I have replaced the term with “misleading”. This is more accurate…
My Thanks Apologies And Reply To Dr Nir Shaviv 2015-08-17
Dr. Nir Shaviv has kindly replied in the comments to my previous post. There, he says: Nir Shaviv” August 15, 2015 at 2:51 pm There is very little truth about any of the points raised by Eschenbach in this article. In particular, his analysis excludes the fact that the o…
The Missing 11 Year Signal 2015-08-19
Dr. Nir Shaviv and others strongly believe that there is an ~ 11-year solar signal visible in the sea level height data. I don’t think such a signal is visible. So I decided to look for it another way, one I’d not seen used before. One of the more sensitive …
Is The Signal Detectable 2015-08-19
[UPDATE] In the comments, Nick Stokes pointed out that although I thought that Dr. Shaviv’s harmonic solar component was a 12.6 year sine wave with a standard deviation of 1.7 centimetres, it is actually a 12.6 year sine wave with a standard deviation of 1.7 millime…
23 New Papers 2015-09-22
Over at Pierre Gosselin’s site, NoTricksZone, he’s trumpeting the fact that there are a bunch of new papers showing a solar effect on the climate. The headline is Already 23 Papers Supporting Sun As Major Climate Factor In 2015 “Burgeoning Evidence No Longer Dismissible!…
So I’ve found nothing to date, despite lots of looking …
On a more personal note, after a two-day trip featuring lost luggage, a missed connection, and a definite need for two-fella Panadol, I’m finally back home from the Solomon Islands, and I’m once again with my gorgeous ex-fiancee in our lovely and peaceful home that I built here on our hillside with a tiny view of the sea … heaven.
I was surprised to note that I wrote 19 posts during the four weeks I was there … well, actually 17 plus re-posting a couple of relevant stories I’d written earlier. They’re all available here, as a category of my blog, Skating Under The Ice. Scroll down to the post called “Feasting” at the bottom and read up, they’ll make more sense in chronological order.
My very best Christmas, New Years, and Holiday Of Your Politically Correct Choice wishes to everyone.
w.
AND AS ALWAYS: My polite request, which is that when you comment you QUOTE THE EXACT WORDS THAT YOU ARE REFERRING TO. This lets us all understand what it is that you are talking about, as well as who wrote the words, and what the context of the statement was.
I cannot overemphasize the importance of this request. I am unwilling, as the poet put it, “… to hear the truth you’ve spoken, twisted by knaves to make a trap for fools.”
Not interested, thanks.
More importantly, however, if you wish to refute what someone said, the starting point must and has to be what someone said. You must first quote their actual words that you claim are wrong. Not what you think their words mean; you can get to that, but you have to begin the refutation with what they actually said. Without their exact words as a starting point, you are just flailing at the air, attacking a straw man of your own creation.
Now, the request is polite … but if you ignore it my response may not be polite. I’m tired of people accusing me of anything and everything based on something they wrongly think I said somewhere sometime long ago in a distant galaxy … too boring. If you’re lucky I’ll just ignore such accusations and claims; otherwise, I am likely to point out your failure as regards quoting, and perhaps your associated shortcomings, using inventive and unusual but generally less than laudatory terms … don’t say I didn’t warn you.
Thanks, w.
Svensmark will eventually receive the Nobel prize. Guaranteed.
Well My only comment would be that I am unable to comment because I am unable to unravel from this post just who said what or who referenced whomelse, let alone comment on the validity of whatever it was that whomever it was, said.
G
I agree. This was kind of an appeal to multiple so call authorities and a tally of people against the theory… but nothing much about the science behind the theory. Perhaps I am wrong because I started skimming after abuot 25% of the way though it.
Correct. Neither Ari nor Willis can raise any substantive objections to Svensmark, Shaviv, et al. Nothing but appeals to consensus authority in papers which themselves can raise no valid objections. Just the consensus carbonari circling the wagons. No actual observational or experimental science allowed.
err you miss the point.
Svensmark continues to ignore negative results.
Willis did his own work. He got the data and looked.
FOUND NOTHING
I wasted about a month of my life looking
best cloud data… AIRS every pressure level.
I looked glbally, looked at individual cells, looked at every pressure level.
I lost track of how many ways I cut the data.
Nothing.
Willis gets to announce his negative results.
me too.
and the scientific literature is filled with them.
Svensmark avoids the brutal truth of published negative results
george e. smith December 26, 2017 at 2:23 pm
Mario Lento December 26, 2017 at 3:05 pm
Gabro December 26, 2017 at 4:26 pm
Seems you guys missed a few things … like this:
Comments?
Then there’s this:
In other words, a paper that Svensmark cites and relies on doesn’t say what he claims, and what it says specifically contradicts his claims … did you quote or comment on those clear objections?
Nooo … you’d rather whine that I posted and linked to TOO MANY PAPERS DISAGREEING WITH YOUR HYPOTHESIS, which is clearly a huge crime on whatever planet you live on …
I’m sorry, but on this planet, pointing out that your opponent has listed and cited a lot of references that support their case doesn’t disqualify their claims … the references may indeed be wrong, but you haven’t engaged with that question at all.
Note that I am NOT claiming consensus. I’m simply saying that there are a number of cogent objections to the idea that sunspots roolz, OK … however, you’re free to mock them all you want. Just note that mocking them does not rebut them.
Finally, all of you so-called experts out there so ready to criticise my analyses, where are your analyses of the data?
Unlike you, I have actually gone to the trouble to read up on the subject and to obtain and analyze surface dataset after surface dataset looking for the elusive 11-year cycle … I’ve looked at everything from rainfall in Fortaleza to clouds in the US, and found nothing. I’ve asked people to send me their best data, and still found nothing. And in response do you quote my analysis and show where it’s wrong?
Nooo … you just wave your hands and claim I’m doing it all wrong and you know so much better than I do … so how come you’re not QUOTING MY WORDS and then SHOWING US ALL WHAT I’VE DONE WRONG? Nothing but baseless, unsupported, and often unpleasant accusations … pathetic.
Now, I’ll be the first to admit that the evidence may be out there … so where are your own analyses that you’ve done that show that it exists?
w.
Like I said, I may have missed some things. This still sounds like nitpicking, and good nitpicking by the way. I know you put a ton of work into your analyses, Willis, so I should have been more polite.
I could not read more than that, because what I am more interested in hearing about the theory than trying to decipher something tangible out of different scientists saying things like,“During a large fraction of days considered here, the contribution of ion-induced nucleation to the total nucleation rate was either negligible or relatively small.”
That just sounds like argument between scientists’. Rhetorically, What is “relatively small”, how small is negligible and who is the authority on what is negligible? I am not asking you to answer these questions by the way.
I get the impression from multiple authors that they object to Svensmark pursuing his initial broad hypothesis. In other words, they have investigated and found nothing, or nothing substantial, therefore he should stop looking because they stopped.
Is that how the ENIAC was developed?
Geez…lighten up.
I did see a single reference to the work of Prof Lu from Waterloo which is also dependent on the CR effect in the Antarctic atmosphere, something I figure is very closely related, for which there is a validated chemical path, physical replication, a sound physical theory and decent support from satellite data.
If Svensmark is completely wrong (which I understand is the consensus of multiple authors) then Lu is also completely wrong because his hypothesis relies on exactly the same CR modulation. The two hypotheses are quite different on their temperature control mechanisms, but have a common cause. To refute a CR-temperature link, one must refute all possible mechanisms.
I conclude it is premature to conclude that CRs and GCRs have no effect on the global temperature. That’s baby+bathwater-tossing stuff.
Cloud formation from charged particles is very well understood (cloud chambers) and the conditions have to be right or nothing happens. Because most of the atmosphere is not in the right pre-condition most of the time does not mean nothing ever happens. I hear a lot of, ‘I cannot locate a meaningful effect therefore the proposed mechanism doesn’t exist’. Why would Svensmark cite papers that conclude the effect he and CERN are replicating in the lab doesn’t exist?
Instead we get this kind of stuff:
“Cosmic rays and global warming – Erlykin et al. (2010) A brief review article. “Is global warming man made or is it caused by the effects of solar activity on cosmic rays as claimed by some? ”
As if there are only two possibilities, with the latter having only one variation. Is ‘natural variation’ found in that short list? Is the null hypothesis dealt into the game? Svensmark and Lu have competing CR-based ideas. It is far too soon to rule anything out. Physicists are a patient lot.
Willis, here you demonstrate, or enact?, the patience of Job.
Willis sez:
” … I’ve looked at everything
from rainfall in Fortaleza
to clouds in the US,
and found nothing.”
My comment:
You got it backwards !
You should have looked
at rainfall in the US,
and clouds in Fortaleza !
But seriously now,
Willis provided a list
of studies to read.
I expected people to
read one of the studies,
and give it a thumbs up,
or “throw mud” on it.
It seems like most people,
skipped the reading,
and just threw mud at Willis !
I’ve read a few studies
in the past week,
and cosmic rays are
still not in my top five
most likely causes
of climate change:
(1) sun,
(2) oceans,
(3) clouds,
(4) CO2, and
(5) measurement error / bias
I hadn’t found a logical reason,
to care much about cosmic rays,
in my first 20 years,
of climate change reading,
and still don’t care much.
Science usually advances,
from one scientist,
‘fighting the consensus’,
but I’m not convinced,
Svensmark is the one.
This post should reopen the discussion, where further facts seen to not move several participants positions very much at all. I started reading this site with the belief that there was good support for the proposition that sunspots and climate were very much related. I no longer believe that.
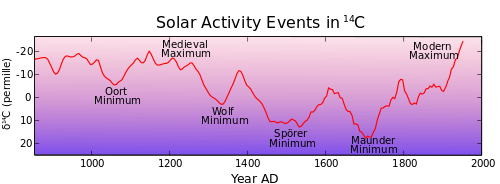
The Maunder Minimum and the coldest interval of the LIA just a coincidence, then?
And the cold periods during the Oort, Wolf, Spoerer and Dalton Minima, ditto?
And conversely, the Modern Warm Period during solar maxima?
https://en.wikipedia.org/wiki/File:Carbon14_with_activity_labels.svg
The Maunder minimum and such is why I formerly was of the opinion there was a strong relationship. What I currently conclude is that climate does not track all the variations in sunspots. It is closer to agnosticism.
Maybe not annual changes in sunspots, but IMO the evidence for the effect of grand solar minima and lesser minima is abundant and takes true belief to d@ny.
That is the rub isn’t it? Exactly what do we make of the Maunder minimum? If it is planetary influences on the sun(Barycenter), then by what mechanism does it influence the earth?
Boarder,
The lack of sunspots during the Maunder GM and lowered numbers thereof in lesser minima are simply a proxy for solar magnetic flux. Your question seems to be what causes these solar fluctuations, rather than by what means they affect climate on earth. Please correct me if wrong.
The proposed mechanism for affecting terrestrial climate, and that of other planets and bodies with atmospheres, is the ability of stronger magnetic fields to block the galactic cosmic rays which have been shown both by observation and experiment to promote the formation of cloud condensation nuclei (CCNs).
The solar magnetic field is one part of the overall variability of our favorite variable star, the sun. I suspect that when all is said and done, it will be shown that no single effect such as cosmic rays explain everything. The record of C14 is fairly easy to get and so the coupling of the timing of low magnetic fields and cold temperatures is easy to extract. Not so easy to extract are the other things that go with a solar minimum that would occur at the same time. I will just note that the tsI varies by 0.15% over a solar cycle and that a 1 degree C temperature variation is only 0.3% enthalpy change. Too many people are anchoring on the normal temperatures experienced during their lives. I would love to see a survey of what most folks think the percentage change is when the temperature goes up or down by a degree. I suspect it would come back in multiple percent, but I could be wrong.
I will leave this food fight to those who are in the cafeteria. Again, I suspect that there is a lot more than just cosmic rays that modify the earth’s albedo and warm it to a lower degree.
Shr.
Of course there are other solar effects on climate besides magnetic flux.
While TSI varies little, its UV component varies enormously. This higher energy range of the spectrum has a qualitatively different effect than visible and IR light upon such climatically important phenomena as ozone and seawater penetration.
The bogus, bastardized Hockey Stick is tacked on to the end of this graph. The trend goes straight up until it tops all previous temperature highs. Just like the Climate Change Charlatans wanted it to look.
In order to study this graph properly you must know that the last little portion of it is a BIG LIE.
TA,
I know that, but the past century or 150 years has indeed warmed relative to the LIA, if not to the same degree as shown in the copied graph. The observed warming is totally explained by natural fluctuations, without recourse to human CO2.
TA, that isn’t a temperature chart.
Thanks, Archer. How embarrasing! I guess I I see Hockey Stick temperature charts everywhere.
Never mind.
The relationship between Earth climate and GCRs has been known for a long time, but it is a matter of which one influences the other, or perhaps they both influence each other.
http://inspirehep.net/record/1225770?ln=en
The “dismiss out of hand” crowd is so hell bent on Svensmark being wrong that they d-nye there is a relationship at all even though it has been observed in thousands of studies using proxy data. This mere dismissal is similar to how many d-nye the gravitational potential energy and it’s retention of heat within the atmosphere.
The major flaw in the criticisms I’ve seen is that they for some reason expect a direct linear relationship from GCRs and climate. Of course anyone seriously studying climate doesn’t expect the fast acting variables, i.e. GCR flux, to manifest itself on the slow variable, e.g. global temperature, instantly.
https://www.nonlin-processes-geophys.net/17/431/2010/npg-17-431-2010.pdf
On what basis is global temperature a “slow variable”? Please define this term. Temperature changes very quickly in response to the the day/night and seasonal cycle, and in response to changes in the weather. There really isn’t much thermal inertia in the atmosphere which is where we measure temperature. If we were talking about the deep oceans maybe – but we are not.
Temperature reacts plenty quick to clouds. And that is the rub because the proposed mechanism is a change in cloud formation. How can local temperature react immediately to the presence of clouds but global temperature react only slowly.
Global temperature, exactly what it is, an average temperature of the planet’s surface — as far as I know the planet doesn’t have a day and a night, that’s just an illusion from the Earth spinning round. In this sense, it is slow variable because the response is lagged and dampened by water’s heat capacity and latent heat.
This mechanism that the paper explains is a mechanism that a lot of people don’t seem to take into account. It occurs all over in nature. I.e. this fall the Mississippi went extremely low (basically no discharge at all) from the Ohio river to just south of Memphis for a few days and tides went extremely low in Brazil and Uruguay. You can’t point to one thing for the cause, it was “multiple equilibria” of several variables.
Earth’s average temperature only varies about 10 degrees but most of the time stays within a few degrees over long periods. Larger changes occur due to stochastic resonance, in essence the noise variables create a punctuated large change when in they happen to all be in equilibrium along with a more important variable. After just one relatively weak solar cycle following nine stronger ones, you shouldn’t be surprised if temperature and the solar variables don’t correlate, especially when it’s considered noise.
We’ll see after a few more solar cycles won’t we?
ShrNfr: I will just note that the tsI varies by 0.15% over a solar cycle and that a 1 degree C temperature variation is only 0.3% enthalpy change.
Other people have made this point, including me in the context of statistical power. People trying to investigate the effects of solar changes on climate changes are attempting to investigate the cause of a tiny fluctuation (or weak signal) among a set of much larger autocorrelated fluctuations (or large noise); they are seeking this in a set of factors whose influences, if real, are tiny compared to other known influences. These are studies with very low statistical power: even if the Svensmark Hypothesis were true, most studies of the mechanism would produce results supporting the null hypothesis instead of rejecting it. That is the result that Willis Eschenbach has presented here: perhaps as few as 25% of relevant studies produce results that reject the hypothesis that climate is actually influenced by cosmic rays.
What should we expect? Well, suppose for the sake of argument that the studies have a common power of about 25%: if the Svensmark hypothesis be false, only about 5% of papers should reject the null hypothesis of independence, at the common significance level of 5%; if instead the Svensmark Hypothesis be true, then about 25% of a large number of independent but relevant studies should reject the null hypothesis, at the common significance level of 5%. That is approximately the result that Willis Eschenbach has presented here (perhaps a poor approximation, because I have not tallied the exact number of relevant statistical results that are statistically significant.)
There isn’t much that climate scientists can do to increase the statistical power of their investigations: really good measures are available only for short epochs; most relevant variables have to be approximated for past time through the use of proxies, which have inadequacies even if it be true that the relation of the proxy to the estimand is constant for thousands of years.
An example of studies with low power were the sequence of studies of trials of aspirin in heart disease. Amidst a host of other factors, aspirin has a tiny effect, and many epidemiological studies. A review of a large number of studies, a meta-analysis, showed that overall the results were consistent with a tiny but non-negligible effect of aspirin (a half tablet per day) in reducing heart attack risk. (you can start in on Richard Peto here: https://royalsociety.org/people/richard-peto-12088/).
Back to Svensmark’s Hypothesis: whether it is true or false will not be demonstrated with reasonable reliability until much more research has been completed. If it is true, most observational studies will continue fail to reject the null hypothesis at the conventional level of 5%. If it is false, and there is no publication bias), then only 5% of relevant studies will reject the null hypothesis at the conventional 5% level.
Solar activity drives temperatures up and surprise, shock and horror down too.
Sunspots create warming cycles at 11 year periodicity, but CMEs via geomagnetic storms obliterate must of the effect. However, geomagnetic index Ap contains the same component as the CET coldest month anomaly with a periodicity of about 34 years, but since there is no such periodicity in the sunspot data, hence strong cooling component in the CET data.
For more see: https://wattsupwiththat.com/2017/12/26/another-positive-feature-of-global-warming-less-record-breaking-cold/#comment-2701800
One of the three comments at AGW Observer is by Ari, himself, replying to a comment on the critical importance of GCRs in cloud formation on Uranus. The other comment is cryptic, quoting Ari without any actual commentary.
Willis, what’s the relationship between wheat prices and sunspots? There are economic factors that strongly influence wheat prices and those factors have little or nothing to do with sunspots. That’s a poor start to evaluating Svensmark’s research.
He’s harking back to the origins of sunspot-climate research, by Sir William Herschel:
https://en.wikipedia.org/wiki/William_Herschel#Sunspots,_climate,_and_wheat_yields
The vagaries of weather and climate affected wheat yield more in 1779-1818 than in 1978-2017. The PDO flip year of 1977 however did have a big effect on wheat production in the Pacific NW, at least, as I well recall.
BTW, it’s not just Svensmark and his co-authors, but a host of other scientists who find overwhelming evidence of the role in climate of GCRs modulated by solar magnetic flux. To include experimentalists at CERN and Harvard and astrophysicists at SLAC, Dr. Svalgaard’s colleagues.
SLAC did however take down its Web page on the topic some years ago, under intense pressure from the Consensus Carbonari.
Stumbled upon this paper – just now – not sure it helps or hinders the debate!
Dynamical evidence for causality between galactic cosmic rays and interannual variation in global temperature.” PNAS 2015DOI: 10.1073/pnas.1420291112
“Here we use newly available methods to examine the dynamical association between cosmic rays (CR) and global temperature (GT) in the 20th-century observational record. We find no measurable evidence of a causal effect linking CR to the overall 20th-century warming trend; however, on short interannual timescales, we find a significant, although modest, causal effect of CR on short-term, year-to-year variability in GT. Thus, although CR clearly do not contribute measurably to the 20th-century global warming trend, they do appear as a nontraditional forcing in the climate system on short interannual timescales, providing another interesting piece of the puzzle in our understanding of factors influencing climate variability. ”
http://www.pnas.org/content/112/11/3253.abstract
That agree with what I suspect- CR affects weather.
Perhaps more that doubling CO2 effects weather.
Unfortunately, both the atmospheric sensitivity to CO2 doubling and CR flux propagating CCN are not yet proven to have been observed in the wild, only under controlled conditions. They are both equally believable from that standpoint.
gbaikie December 27, 2017 at 12:49 pm
Anybody using the Global Temperaturedata in any theoretical study is kidding themselves whether the get a correlation or not.
It is a total artifact of Adjustments and is totally useless for serious research purposes.
I made the same point to Jo Nova on David’s Notch papers.
“Do the tiny changes that we see in various kinds of solar output over a sunspot cycle affect the climate?”
Yes…. IMHO 🙂 …A tiny bit! We (humans) have a tendency for our comfort and the range of this climate zone is narrow. Human induced AWG promoters claim 2deg temp raise soon… shok’n horror.
Since the industrial revolution is about 0.5degC … oh my. /sarc
But this is the wrong way to look at this…
The tiny variation in Solar is a very tiny temp variation too…. in Kelvin.
300K or 300.5K …. big deal. There is your ‘tiny’ TSI effect 🙂 (IMHO off course!)
(please forgive the not so perfect English… spell-check has trouble with me accent)
Nir Shaviv commented on some of this long ago on his blog.
EXPERT CREDIBILITY IN CLIMATE CHANGE?
. . . Since the AGW protagonists have the tendency to block the publication of papers that don’t follow their party line (and if you think otherwise, read the climategate emails), it is way easier for the AGW protagonists to have any paper get published. . . . But any paper my colleagues and I try to publish gets such a hostile confrontation that it is simply very hard to publish at all. The bottom line is more papers for the AGW protagonists and less papers for those who are more critical. . . . .
Since there are more protagonist papers around, they cite each other more and violà, you get that the more numerous group has more papers per person and more citations per paper. You don’t need to be Einstein . . .
Willis, I’m disappointed.
To start your comment highlighting a friend who obviously has a dog in the hunt and who focuses on the references rather than the substance of the paper is not your normal style and frankly is beneath you.
I don’t know Ari, I don’t know if the paper has substance, but it was dismissed with an ad hominem rather than a substantive evaluation.
I basically agree with this sentiment. This whole, “I have more papers that agree with me than you do” argument falls short of a real analysis for me. And I do have to take issue, Willis, with your assertion that Dr. Svalgaard was “restrained” in his criticisms of Svensmark’s new paper: he simply dismissed it out of hand. That’s a pretty big slap down in my book.
etudiant December 26, 2017 at 3:10 pm
First, I don’t know Ari. I do know his site is one of the more balanced sites around.
Next, seems you missed a few things. There’s this:
Point out how this is an “ad hominem”?
Then there’s this:
Furthermore, as Svensmark’s cosmic ray hypothesis relies on ion induced nucleation, it is noteworthy that one of Laakso et al. conclusions is this: “During a large fraction of days considered here, the contribution of ion-induced nucleation to the total nucleation rate was either negligible or relatively small.”
In other words, a paper that Svensmark cites and relies on doesn’t say what he claims, and what it says specifically contradicts his claims … surely you don’t think that is an ad hominem? It goes to the heart of Svensmark’s claims.
Sorry, amigo, but you need to read the post again. You missed a lot …
w.
” “During a large fraction of days considered here, the contribution of ion-induced nucleation to the total nucleation rate was either negligible or relatively small.”
[Willis] In other words, a paper that Svensmark cites and relies on doesn’t say what he claims, and what it says specifically contradicts his claims … surely you don’t think that is an ad hominem? It goes to the heart of Svensmark”
It does not ‘specifically contradict his claims’. Which claims? He confirms there is a proposed mechanism and that it exists and that it is, based on his investigation, not very large. Laasko does no claim there is no effect. Clearly they disagree as to the magnitude of the effect. More specifically, they disagree as to the detectability of the magnitude of the effect.
It does not ‘go to the heart of Svensmark’. It is a quibble over the detection of, and therefore the impact of, the effect. I appreciate your enthusiasm but Laasko does not say there is no effect.
Willis, please update your post to include updates from the copied source. See ‘latest update December 27’
https://agwobserver.wordpress.com/2017/12/22/some-curious-things-about-svensmark-et-al-reference-list/
Spare us personal commentary by the self inflated wandering albatross. This isn’t Opera. It’s supposed to be a science blog.
Willis has not actually conducted any “research” as he claims. He has read some papers while ignoring all those hundreds of which which he can’t find reasons to fault, however spurious. Typically, he rejects papers he doesn’t like before even bothering to read them.
His method is the polar opposite of the scientific method.
Are you ever going to substantiate your per rectum assertion about variations in 14C record, Willis??
For years you’ve been desperately trying to revise the past to fit your agenda.
Sorry, could not crawl through all that while in holiday mode. On skim through it seems the main complaint is that there is no direct correlation with measured cosmic rays strength and climate temperature records over the last 30 year warm period. I don’t recall Svensmark ever claiming that there was a direct correlation, only that his experiments had conclusively proven that cosmic rays seed cloud generation. Obviously it is just another factor is a semi chaotic system, but is does seem to explain medium to long term cycles better than any other theory. As we are all aware there are so many issues with climate data collection and collation over the last 30 years I would not ever expect to find a single correlating factor. Lack of short term correlation never seemed to worry the carbon dioxide debate crowd.
Thanks,
Dean
Having glided up (unwillingly) into several clouds, I find it difficult to believe that when the humidity hits 100 percent, cloud may not form.
Has anyone located parts of the earths atmosphere where the humidity level is above 100 percent, and there is no cloud?
Peter,
Even at 100% humidity, you still need CCNs for clouds to form. Without them, the water vapor, though saturated for that temperature, will remain gaseous and not condense to form droplets of liquid water.
A droplet of water (the kind that make rainbows possible) has an internal pressure that is greater than the ambient air pressure where that droplet of water floats, perhaps in a cloud. The same thing is true inside a bubble of water vapor inside a body of water, perhaps as it approaches boiling.
The internal excess pressure differential is trivially calculated using the principle of virtual work. You imagine a change in radius of the bubble or droplet (say delta (r) ) and you compute the work done by that pressure differential acting on the whole surface area of the bubble, while moving the surface out by that delta(r). Then you calculate the (virtual) work done by the surface tension of the droplet or bubble surface while decreasing the area of that surface (or increasing). Then you equate the two since the radius has not changed, and you will find that the internal excess pressure is simply delta(p) =2t/r where t is the surface tension in newton per meter, and delta (p) is the pressure differential in newton per m^2.and r is the bubble or droplet radius in meters.
Well I see there’s a big OOoops! there. Well actually it’s a little oops, because as r >0, we find delta(p) goes to infinity.
So bubbles in water and droplets of water, just will not tolerate being at zero or near zero radius, they just come apart at the seams.
That’s why you need a substrate of greater than zero radius of curvature somewhere for the water molecules to attach themselves to. That minimum radius needs to be bigger than a water molecule, but even a microbe is plenty big enough to act as a substrate.
But where I would query the Svensmark theory, is that I am not aware of any rate dependency on the growth rate of droplets.
One would imagine that Maxwell-Boltzmann energetic tail end Charlie molecules would evaporate from the surface, while surrounding vapor molecules would collide with the surface and adhere.
From a flat surface of large extent one can calculate the exchange rates for various Temperatures (izzat the Clausius-Clapeyron equation, or related?), but I don’t know how to determine a coming or going rate from a sphericaloidal droplet.
In any case, I don’t see any problem in ANY water droplet, from growing without any help from any GCMs once it has gotten started. It’s the getting started where the skunk is hiding in the wood pile.
G
George,
Svensmark, Shaviv, et al have shown that GCRs facilitate the formation of CCNs via ionic attractions and other mechanisms. The same has been demonstrated experimentally at CERN and SLAC.
Willis ignores all scientific evidence to adhere to his faith-based belief in no solar magnetic or UV affect on climate.
Glaciers?
The cloud chamber is exactly the conditions you describe. It detects subatomic particles by condensation…
I’m not sure that your question has really been answered. The phenomenon you’re interested in is Supersaturation https://en.wikipedia.org/wiki/Supersaturation My GUESS is that atmospheric water vapor can and does supersaturate if no nuclei are available for the water to condense out of the vapor phase. But maybe there’s some reason that can’t happen with water. There may well be some kitchen experiment you can do to create supersaturated (humidity 100+) air then cause it to condense by throwing in some suitable nuclei. I didn’t look for one.
Interesting to see that a host of cloud cover studies are finding little correlation with GCR. Would like to see if there are any studies looking specifically for the solar-magnetic effects on jet stream position that Stephen Wilde has long theorized about, where the uv shift has an effect on ozone levels that makes the polar jet more zonal/ less meriodonal when solar activity is high, shortening storm tracks and reducing cloud cover.
Joanna Haigh and other IPCC consensoids have modeled such effects as an explanation for the cold experienced by Europe during the little Ice Age but they assume that such affects would be regional rather than global and would only redistribute heat, when the mechanism is obviously capable of secular effects as well (Wilde’s theory).
Thanks Alec.
Joanna Haigh is aware of my hypothesis.
I am awaiting up to date data as regards the temperature of the lower stratosphere above 45 km since 2004. If any reader has a relevant link I would be pleased to look at it. For the seven years prior to 2004 that region was warming contrary to standard climatology which predicted cooling with the quiet sun through the entire vertical column.
My hypothesis requires warming above 45 km when the sun is quiet and cooling above 45km when the sun is active.
Stephen, the trouble is that measuring at a set height can be awkward
As the atmospheric temperature pulses from ocean events and cycles, the tropopause would move up and down slightly, thus affecting the temperature at a set height in the stratosphere.
Be careful how you look at the data.
I haven’t read any of those papers but I wonder if the effect of GCRs would necessarily be global, but more likely seen at the poles. And also wonder if there is any difference between night time cloud cover and day time cloud cover.
More likely to be seen at the poles
http://www.realclimate.org/images/jp_fig2.jpg
Jasper Kirby iirc did a pretty persuasive YouTube video showing that GCRs influence climate.
More than one! Here’s one:
A more recent (2011 v 2009), over hour-long one:
I don’t see any scales, or even information as to the flow of time; forwards or backwards.
Climate history is commonly plotted in either direction depending on the illusion the drafter is trying to convey.
But my un-calibrated eyeball sees a steep upward slope going left to right (or coming) for about 40% of the horizontal axis followed (or preceded) by no significant change at all for 60% of the axis whichever way it is coming or going.
G
you tube is not science
“Climate Science” is not science in the generally accepted sense.
CERN is not doing science because it is uploaded in youtube lol
Willis,
I don’t think that cosmic rays are the main driver of the sun on climate, but another part of the sun’s 11-year cycle.
The link you gave about the Pirañha river and the sun cycle may not be the best example, but there are many links that connect rain and river discharges with the sun cycle.
The origin as I have read many years ago (the link to that paper is long gone now) is in the UV part: that changes with about 10% over a full cycle, influencing the ozone production and the temperature of the lower stratosphere, increasing the equator-pole temperature difference at that height and pushing the jet streams polewards, including companying cloud and rain patterns.
Of course other natural cycles, like an El Niño, also influence rain patterns and may overwhelm the influence of a solar cycle, but in many (mid-latitude?) riversheds the influence is remarkable. Here a few:
The Nile river (Egypt):
http://onlinelibrary.wiley.com/doi/10.1029/2006JD007462/full
The Po river (Italy):
http://onlinelibrary.wiley.com/doi/10.1029/2007JD009157/pdf
The rivers in Portugal:
http://onlinelibrary.wiley.com/doi/10.1029/2005GL023787/abstract
The Mississippi:
https://arizonaenergy.org/AirEnergy/A%20Regression%20Model%20for%20Annual%20Streamflow%20in%20the%20Upper%20Mississippi%20River%20Basin%20Based%20on%20Solar%20Irradiance.htm
Rivers in South Africa (22 years cycle?):
http://nzclimatescience.net/images/PDFs/alexander2707.pdf
Seems something to explore further?
The conundrum seems to be that TSI, which encompasses all electromagnetic radiation (including UV) from the sun seems to have a floor; but 14C production does not seem to have a ceiling. Our notion is that the host of aligning solar influences during maxima, mostly as proxies for solar field strength, protect the earth from nasty galactic radiation thought to create 14C.
Perhaps 14C is also produced by other means more closely related to climate than solar minima.
Ferdinand, I grabbed your first paper, viz:
It looked familiar, and a bit of searching found this:
Willis Eschenbach January 22, 2014 at 10:21 am
Look, am I the only one around here who actually analyzes this stuff? You all have exactly the same access to the data that I have … but nooo, everyone thinks every solar study is wonderful without even taking a look at the data.
Somehow, we’ve gotten the name of “sceptics” when I’ve never seen a bunch of people more credulous than people who insist that sunspots roolz without ever having seriously analyzed even one single paper. Me, every paper I’ve looked at so far has giant holes, like your recommended paper on the Nile only having one-sigma significance … dude, that’s pathetic! One sigma significance, and they can’t even read the times off of their own graphs? Do you understand what trying to pass this excrement off as science does to your reputation?
Doesn’t mean a valid paper won’t show up tomorrow … I’m just saying that out of all the papers where I’ve examined the data, I haven’t found one that is anywhere near significant.
And by God, for all the abuse heaped on me, I would wager that I’ve looked longer and harder at more solar papers than any of the people trying to bite my ankles … where are all of their analyses showing that the papers are right? Where are their quotations of where they claim I went wrong in my studies with their analyses showing why and how I went wrong?
Crickets …
97.3% of their objections boil down to “but I really, really know that you’re wrong, Willis, because I just don’t think you’re right” … sorry, but I follow the science.
w.
I would say that cosmic rays aren’t the control knob, nor is CO2 levels.
The control knob of Earth’s average temperature is ocean surface temperature which is
controlled by the average temperature of volume of the ocean.
We are in ice box climate because we have ocean [in it’s entirety] which is cold – somewhere
around 4 C.
If ocean warmer than say 12 C, we would be approaching an hot house climate- which we have not had for millions of years. What controls average global temperature in terms of years, decades is ocean surface temperature- which have an average temperature of about 17 C, currently. And due to the simple fact that ocean surface covers 70% of planet and total land average temperature is about 10 C, the ocean controls global air temperature..
If we believe that the Oceans are the Earths heat sink ad hold vast quantity of heat and the thermohaline circulation is in the order of 1000 years or so, we may be on a fools errand to try and detect an 11 year signal in a system with this great amount of inertia.
And yet the signal is there everywhere we look. You name the climatic phenomenon. The solar cycle is there, at a high level of statistical significance.
Or, finding the 11yr cycle in the temp record would be like finding 60 Hz in a pot of water heating on an electric stove.
As for Willis’ failure to find a “signature of the ~ 11-year cycles in sunspots,” I do not see this as inconsistent with any modest solar-magnetic driver of climate change. It seems to be well established that the dominant driver of short term fluctuations in global temperature is ocean oscillations, which can move temperature a half a degree in one year while also seeming to be responsible for multi-decadal trends. Without a good explanatory/predictive model for ocean oscillations these larger temperature fluctuations cannot be corrected for, making it pretty much impossible to discern a much smaller solar magnetic signal.
Maybe with enough data, if ocean oscillations maintain a consistent randomness, the larger random fluctuation could be controlled for well enough to reveal a smaller solar effect, but that would seem to require much longer time series than what we have for these variables. So I can’t read much into the failure to find an 11 year solar signal. It could be as regular as clockwork and still be undetectable in the presence of far larger random fluctuations that we are unable to control for.
Willis has not mounted a valid search. He simply ignores the hundreds, if not thousands, of papers finding the solar cycle in climatic phenomena, and raises bogus objections to the few papers he actually has read.
Prime example is his rejection out of hand of the Fortaleza, Brazil rainfall record, and other phenomena published by Dr. Reddy (not the pharmacist). In typical antiscientific fashion, Willis rejected the paper without even reading it, arguing that the record there couldn’t be long enough. When it was pointed lout to the true believer that the record was continuous from 1849, he still refused even to look at Dr. Reddy’s work there or on any other observation of the climate system.
Gabro December 26, 2017 at 4:21 pm
Oh, not true at all. I did indeed look at the Fortaleza record. Here’s my comment from the time.
Since no one enquired further I left it at that. However, now that you bring it up, I’ll do a full CEEMD analysis of it and see what I find.
Stay tuned …
w.
PS—When I investigate a single record, people say stuff like “But there’s 23 new papers which say there is a solar signal.”
When I send an equivalent list of papers which say there is NO solar signal, people say stuff like “I expected to find a single study firmly establishing the case” …
… can’t win for losing on the solar question, I guess. …
Willis,
Your so-called “analysis” wasn’t. Just like all your statistically illiterate garbage.
Real scientists who did real statistical analysis found Reddy’s results repeatable and highly significant.
Your amateur and special pleading effort, not so much.
That is, once you were forced to admit that the record was long enough, which you initially d@nied, without having bothered to read the paper.
OK, Gabro, here’s the analysis that I did at the time. Fortunately I’m a squirrel so I saved it up. When I looked at the records I saw I’d done both a Fourier analysis and a CEEMD analysis of the data. I’ll start with the raw record:
Here’s the periodogram. It does NOT show the 52-year cycle discussed by Reddy.
You can see a cycle at about 13 years, and another at 26 years but nothing at 52 years.
Then I did a CEEMD analysis. Here are the periodograms of the empirical modes:
This shows the same cycles as in the periodogram. Finally, here are the intrinsic modes themselves.
Here, you can see the problem. There is a 70-year mode, but no 52-year mode, and the 70-year mode is both weak and irregular.
Now, your unsourced accusation was that I ignored contrary evidence, viz:
I did no such thing. I said I didn’t think there was a 150-year record. When it was pointed out that the record amazingly exists, I ANALYZED IT. I did all of those graphs shown above at that time. I looked at all of that, went back to the thread in question, and reported my results. I said I found no evidence of a 52-year record, viz:
I even gave a link to the data, the first link to the data in the thread, so wonderful individuals like yourself could do your own analysis. You’re welcome …
Subsequently, nobody asked for my graphs or calculations. I had plenty of other research and issues. And the world moved on to other questions.
AS YOU WOULD HAVE KNOWN IF YOU’D BOTHERED TO QUOTE MY EXACT WORDS ON THE SUBJECT, YOU ANONYMOUS HOCKEY PUCK!!!
As I said, I’ve had it with ugly false unsourced and uncited accusations like yours. I’ve done my best to do my work honestly and tell the truth about it, and charming fellows like yourself hide behind an alias to accuse me of things I never did.
Next time do your damn homework before you uncap your electronic poison pen and you won’t look so unutterably foolish when the truth comes out …
w.
Willis,
I’ve repeatedly showed you the infinitely superior analyses of the same data by competent statisticians, which of course you aren’t.
Your false allegations are totally typical of your MO.
Willis,
I don\t know if your low level of statistical education will even permit you to understand all that is wrong with your pathetic, amateurish gibberish, but here is a text which could help further your education. Not that I would expect a puffed up poseur who pompously fancies himself a “polymath” in the absence of any actual academic attainment is support of that baseless assertion to bother with furthering his obviously sorely lacking mathematical education.
https://books.google.cl/books?id=W1wFi9S7m80C&pg=PA54&lpg=PA54&dq=fortaleza+reddy&source=bl&ots=o0vYdofBeg&sig=XlwweS1kpRTloAQZGDQrgWh9eZw&hl=en&sa=X&ved=0ahUKEwjokP6kmqnYAhWBfZAKHfo7B-EQ6AEIJzAA#v=onepage&q=fortaleza%20reddy&f=false
Svensmark said that the full chain of events between GCR and cloud formation is long, with significant elements unknown until recently, so it is not surprising that he has long trail of his own papers on this. So now it necessary to show whether this modulation is significant.
Also, we only have satellite records for the period when solar activity was strong. Now that we are entering a weak period, many theories will either be validated or invalidated.
I am of the opinion the sufficiently long records of climate show multiple periodicties. The effect of any one might get washed out in once cycle if multiple other cycles are in the opposite direction. The counter to this is the one true tree that distinguished prof. Mann found showing otherwise, except when it doesn’t.
So what are the drivers of each periodicity? Place your bets!
Humidity has something to do with clouds….wonder if the humidity decreasing has anything to do with it?
…or just a sign that they’ve screwed with the temp reconstructions too much…and temps a falling along with humidity
Except for UAH satellite and balloon observations, the so-called “surface data sets” are works of anti-science fantasy. Humidity data are less likely to be cooked books.
Then there goes another global warming theory….not only is humidity going down….it’s not even where it’s supposed to be
Humidity just determines the altitude of the clouds. They tend to START forming at the altitude where the humidity gets up to 100% which I guess is the dew point or close enough because the air is seldom clean enough to be free of suitable substrates.
I remember spending a good several hours while fishing in the Sea of Cortez, on the west side of an offshore island (Isla Carmen off Loreto). That part of the Baja peninsula South of Loreto has a range of quite high mountains that make that coast unreachable by road. In any case, any breath of wind, either brings Pacific air over from the west of Cortez air heading to the west, and either one has to make it over those mountains which send the air skywards.
So while we fished the Isla Western shore, I watched the cloudlets form over the peninsular mountains, as if like beads of dew forming on the lawn. Little tiny isolated specks of cloud, all appearing out of nothing at exactly the same altitude (by eyeball) and right over the mountain ridge near the peninsula Eastern shore. The tops of the cloudlets could be used to support a straight edge, demonstrating that the air was fairly static, and of uniform temperature and humidity. From my vantage point, I could see perhaps 40 miles in N-S extent of that line of beads. It was noonish when it started, so lunch took over from fly casting, giving me time to observe.
Once a speck of cloud appeared out of nowhere, it started to grow downwards, a sign that the mid July sun was being partly blocked by that proto-cloud, thus allowing the air on the underside of the cloud to cool a little and immediately start precipitating its own moisture, and growing the cloud even faster. The sunny side of the cloudlet reflected sunlight away (actually scattered) from the cloud allowing the air there to cool so the cloud started spreading out as well.
By 1PM when we headed for the barn; excuse me, I meant the bar, the cloudlets had started merging into a broken 40 + miles of cloud, that terminated on the north end, by absence of the mountains, and vanished to the south from visual blockage by those same mountains, and by that time those specks of cloudlets, had built up into a substantially thick vertical cloud bank, which none-the-less was still localized over those hot Baja desert ridges.
I don’t see why there would be much hesitation in cloud formation at the dew point over a hot dusty desert landscape, where dust devils happen all day to aerate plenty of water droplet substrates.
G
While attempting to find solar correlations on the surface data seem to be a pointless attempt, the upper atmosphere appears to be cooling in step with solar output.
http://cdiac.ess-dive.lbl.gov/trends/temp/angell/graphics/global.gif
Correlations of solar activity with surface temperature, rainfall, air pressure, wind, storms, you name it, abound.
As Willis has been repeatedly shown, but continues to ignore the inconvenient truth.
Please show me one.
George,
You’re kidding, right?
There are literally at least hundreds. Here’s a recent one (Dec 2014), on the Indian monsoon. It doesn’t find the cycle in rainfall, however. but many other studies of precipitation do:
http://www.sciencedirect.com/science/article/pii/S1364682614001370
Solar cycle effects on Indian summer monsoon dynamics
You could easily find at least dozens, with the least little bit of effort applied to searching.
The fact that the solar cycle shows up in climatic phenomenon is not the least bit controversial. It’s a repeatedly found scientific fact, d@nied only by true believers like Willis.
For dozens more, please search for O.M. Raspopov, et al. For example:
The role of solar forcing upon climate change
https://pure.rug.nl/ws/files/6657175/1999QuatSciRevvGeel.pdf
But it’s obviously not just Russians.
http://www.drroyspencer.com/wp-content/uploads/TSI-est-of-climate-sensitivity2.gif
~graph of dr. spencer. detrended data, smoothed three years to cancel out el ninos and la ninas, with early nineties pinatubo cooling removed.
Rob,
For every correlation between solar activity and climate, there are demonstrable causes, as I’ve repeatedly shown.
Besides, please explain why you imagine the correlations to be spurious or coincidental.
Thanks.
Gabro, sorry, I am not kidding. But you are. Your first reference is paywalled. Your second reference has nothing to do with solar cycles. Please show me which of “surface temperature, rainfall, air pressure, wind, storms, you name it” exhibit a 11-year cycle. Just one, not “too many to show”.
Rob,
As noted, I’ve showed it over and over again.
GCR flux is modulated by solar magnetism. The causation is obvious and well supported. Same with UV flux and ozone.
George,
I’m not kidding, but you obviously are just wasting time.
For me the first isn’t paywalled and the second most certainly does refer to solar cycles. I’m guessing that if I post a thousand references, you won’t like any of them. Just like Willis.
But here are some of Dr. Reddy’s findings, a real scientist whom Willis disses and ignores. This is the paper which Willis first dissed, then refused even to read, after his idiotic, lying diss was exposed.
CLIMATIC FLUCTUATIONS AND HOMOGENIZATION OF NORTHEAST BRAZIL USING PRECIPITATION DATA
http://citeseerx.ist.psu.edu/viewdoc/download?doi=10.1.1.1016.9561&rep=rep1&type=pdf
Clearly, your moniker is a misnomer. You in fact aren’t the least bit curious, or you’d already have found hundreds of solar cycle-climate papers.
It’s hardly just Dr. Reddy:
The Indian summer monsoon during peaks in the 11 year sunspot cycle
http://onlinelibrary.wiley.com/doi/10.1029/2012GL051977/abstract
Meehl is even a usual climate consensus suspect.
Rob, what are you suggesting? (that the temperature of the earth affects the solar cycle?)
Rob,
You might be new here, so not exposed to the abundant evidence of effects onsolar magnetism and EM flux on climate.
As for magnetism, I’ve already cited the strength of the solar magnetic field in shielding earth and other planets from GCR flux, with concomitant effect on CCNs. I’ve also mentioned here, without going into the great detail as in other comments, on the effects of UV variation on climate via ozone and seawater penetration. Ozone alone has profound effects not only on solar EM penetration, but upon atmospheric pressure and hence winds.
Lots of studies are available should you wish to educate yourself further on these topics.
Rob,
I’ve already showed that the record high solar activity of recent decades caused global warming since AD 1850 and that record low solar activity caused the depths of the Little Ice Age Cold Period.
Well, Rob, can we deduce anything from correlation? Either the sun is causing temp change, or the earth is causing the solar cycle, or something is causing them both. Any other options here? (spurious, sure, but could an eleven year cycle be coincidental on both the earth and the sun?)
Rob,
The fact that the 11 year cycle shows up in every climatic phenomenon is so trivial that no Nobel could possibly be awarded for it.
No matter how many studies I provide (hundreds already), your and Willis’ religious faith won’t accept them.
For instance, rainfall:
Rainfall, drought and the solar cycle
https://www.nature.com/articles/251594a0
The solar cycle and Indian rainfall
https://link.springer.com/article/10.1007/BF00867947
Solar cycle effects on Indian summer monsoon dynamics
http://www.sciencedirect.com/science/article/pii/S1364682614001370
Influence of the solar activity on the Indian Monsoon rainfall
https://www.sciencedirect.com/science/article/pii/S1384107604000739
As you easily could have found for yourself, had you the least interest in the truth. But facts are anathema to you, Willis, and all other enemies of reality and humanity.
Rob,
Seriously?
Clearly, you’ve never studied climatology. Nothing could be simpler than showing the repeatedly demonstrated connection between the solar cycle and temperature:
http://hyperphysics.phy-astr.gsu.edu/hbase/thermo/solact.html
Gabro, you say:
“Nothing could be simpler than showing the repeatedly demonstrated connection between the solar cycle and temperature”
But the link you provide refutes you. Discussing correlation b/w temperature and solar activity, it states:
“when the last few years of data are included, the curves diverge and severely weaken the case for the driving of temperature by this measure of solar activity”
Perhaps you have a case of only seeing evidence that supports your position?
“AND AS ALWAYS: My polite request, which is that when you comment you QUOTE THE EXACT WORDS THAT YOU ARE REFERRING TO.”
I prefer to refer to the words that are missing from this commentary, that is, the 2016 results from the CERN CLOUD experiment.
The CERN website reported on November 11. 2016 the discovery “…that aerosol particles can form in the atmosphere purely from organic vapours produced naturally by the biosphere. … By raising the baseline aerosol state, this process significantly reduces the estimated aerosol radiative forcing from anthropogenic activities and, in turn, reduces modelled climate sensitivities…” (CERN Courier, Nov 11, 2016, CLOUD experiment sharpens climate predictions.)
The CERN 2009 results are mentioned in passing. If the CERN experiments are important to this commentary, why are not the most recent results discussed? Most of the comments above address thinking more than 5 years old.
Dr. Roy Spencer, already in 2010, sliced HadCRUT3 according to the 11-year solar cycle, and after detrending it, calculated the effect of the solar cycle on global surface temperature.
http://www.drroyspencer.com/wp-content/uploads/TSI-est-of-climate-sensitivity2.gif
http://www.drroyspencer.com/2010/06/low-climate-sensitivity-estimated-from-the-11-year-cycle-in-total-solar-irradiance/
I guess Willis Eschenbach, despite writing dozens of articles on the lack of solar effect on climate, hasn’t read it yet. Too much writing and too little reading never result in good science.
Especially when the little reading is totally ignored.
Willis’ idea of “research” is reading as few as possible of studies on the solar effects on climate, while ignoring all results he doesn’t like.
Javier, Dr Roy also smoothed the data three years to cancel out ENSO. There were two very large el ninos in the temperature series that he used that occured at solar minimums. (’73-’74 & ’97-’98) Had he just taken them out altogether, the temp change would be even higher than .12C…
Also, Willis has read the piece. See solar periodicity in the list of his own posts. (he starts with dr roy and then goes into fourier analysis)…
If the ‘year’ refers to year within the 11-yr cycle with 1 being the beginning of the cycle [at minimum], 4 or 5 being the maximum of the cycle and 11 being the end of the cycle [and the beginning of the next cycle, then the TSI-graph is completely wrong as the maximum in TSI should be at the time of sunspot maximum [at year 4 or 5]. Graphs like this are cause for ‘dismissal out of hand’ and very hurtful for the credibility of anybody who runs with and pushes the Graphs.
Svalgaard, Spencer was constrained by the data in the study that he was critiquing. 1 started with the first year of the data. Regardless of which year numbers are used, they make the same point anyway. (.12C warming from min to max)…
According to Spencer, the data goes from 1959 on, so the year 1 might refer to 1959, 1959+11, and so on. Your “dismissal out of hand” on grounds you haven’t even checked if true is very telling of your bias.
Javier December 26, 2017 at 5:26 pm
Nope, I hadn’t seen it. But I’m happy to take a look at it. However, you attempting to diss me for not having already read every single study ever written?
That’s just ugly. Based on your past posts, I had thought better of you.
Yes, I’ve written up my own studies, and not only have I read stacks of other studies, I’ve invited people to point out the ones they though were good. To my knowledge, this is the first time I’ve heard of it.
So I’ll do what I always do. I’ll take a look at the study and report back on what I find. And in the meantime, piss off with your ugly accusations. I am an honest and honorable man doing my honest and honorable best. You may not be acquainted with my brand of humans. We don’t appreciate ugly untrue attacks by people like you who don’t have the balls to sign your own name to your own words. I don’t mind people using an alias.
I do mind when they hide behind the alias to throw mud and launch vile attacks. As I said, I’d thought better of you in the past, and I might in the future. But that was beneath you.
w.
OK, javier, a quick look at Dr. Roy’s post finds the following.
First, I was shocked that Dr. Roy only used data since 1959 … when both of his datasets go back a hundred and fifty years, that sure seems like cherry picking. He appears to have done it to match the study he was discussing, but that hardly qualifies as a valid reason in general. In particular, that means that there are only 4.5 solar cycles during that time, far too short a number.
Second, I don’t see how Dr. Roy is doing this part:
Since the sunspot cycle is only approximately 11 years long, and historically has ranged from 9 to 15 years, how do you shoehorn that into an 11-year cycle? Not only that but times between sunspot peaks are different from times between troughs. Hang on … OK here are the peak-to-peak times:
11.0, 11.3, 9.9, and 10.8 years
And here are the succeeding trough-to-trough times
11.3, 10.2, 10.2, and 12.4 years
I truly don’t understand how one would make a “composite 11-year cycle in TSI” from cycles whose lengths range from 9.9 to 12.4 years. But since you are recommending the study, I’m sure you can explain how it is done.
And if you can’t explain how it’s done … why on earth would you recommend it?
Next, HadCRUT data. He is using HadCRUT3 data, which is now deprecated in favor of HadCRUT4 data. However, I doubt if that makes much difference. So … is there a regular 11-year cycle in the HadCRUT data?
All I can say is, I can’t find one, even in the cherry-picked region from 1959 to 2004. I took that HadCRUT data and repeated it on an 11-year cycle … the results look nothing like Dr. Roy’s.
Next, he says:
Yep, I did that, although it’s totally against my principles to use smoothed datasets as input to a comparison. Still didn’t get what he shows.
And he says:
This seems totally bogus, as the cooling after 1991 is in no sense remarkable … however, even when I do that I STILL don’t get Dr. Roy’s nice results. But you must know how to Dr. Roy did it, since you say the study is valid.
My main objection, however, is the cherry picking and the crazy analysis, stuffing a variable length cycle into an 11-year straitjacket. Why not just LOOK AT THE CYCLES IN HADCRUT?!? I mean, that’s why we have scatterplots and Fourier and CEEMD analysis … and while we’re at it, let’s not restrict ourselves to 45 years of the record.
A scatterplot of the overlap in the two datasets, which goes from 1850 to mid 2016, shows no relationship between temperature and sunspots. A periodogram shows no peak at 11 years. A CEEMD analysis also shows no peak at 11 years.
Now, I think Dr. Roy’s post was saying “If, as in this study over here, we restrict ourselves to less than a third of the temperature record, we can sorta kinda get a result like theirs”. Not sure how serious he was regarding any generalization of that very limited result.
I say that because when we look at the full temperature record, or even just the record since 1900 when data is likely better, there is no sunspot related cycle. Fourier says none. Scatterplot sunspots vs temperature says none. CEEMD analysis says none.
So now, the ball is back in your court. Perhaps you can explain how Dr. Roy jams a variable-length cycle into a regular 11-year cycle. Perhaps you can do the analysis of the HadCRUT data and get his results. I can do neither … and even if I could, the objections of cherry-picking and smoothing still stand.
I fear it’s not Dr. Roy’s best work, which is generally very good …
w.
Willis Eschenbach: You said, “A scatterplot of the overlap in the two datasets, which goes from 1850 to mid 2016, shows no relationship between temperature and sunspots.” Did you detrend global temperature? Did you try a scatterplot of global temperature vs. sunspot abundance a year earlier? Did you use monthly or annual (or what?) figures in the data? I expect a low correlation due to lots of short term noise when sampling periods are short, and better correlation if sampling periods are at least a year, better still with the 3-year smoothing that Dr. Roy Spencer did at least on global temperature.
Something else: Global temperature (especially according to HadCRUT) has a roughly 65 year cycle. This seems to be from any or any combination of the AMO, ENSO smoothed by a decade or two, the longer period component of PDO, and/or the Gleissberg cycle (which should be checked for influencing Earth’s multidecadal oscillations). (I expect that if solar cycles affect global temperature, longer period ones would have more effect than shorter period ones because the ocean mass above the thermocline takes decades to have its temperature achieve most of its response to a forcing.) A strong ~65 year cycle could cause a scatterplot to show low correlation between global temperature and sunspots, because the ~11-year cycle only affects land and the uppermost ocean and has an appropriate lag of a year or two, and if the Gleissberg cycle affects weather/climate then the lag from it is longer due to a thicker layer of the upper ocean being affected. I suspect global temperature (smoothed by 3 years) might correlate better with the (3-year-smoothed) sunspot count one ~11-year cycle plus one year before, than with the (smoothed) sunspot count one year before.
Another thing I think is worth trying: Smoothing by only one year, but removing from global temperature the part of it that correlates with ENSO 3 months previously (or whatever the lag is).
Donald L. Klipstein December 26, 2017 at 10:06 pm
Yes.
Nope. That’s the slow method. Instead I did a cross-correlation analysis, which shows a maximum correlation of 0.04 with a lag of about 26 months. Not anywhere near significant.
Monthly.
I, on the other hand, side with Matt Briggs on the question of using smoothed data as input to an analysis. In particular, “boxcar” smoothing is horrible as it easily turns peaks into valleys and vice versa.
In addition, the Hurst exponent of smoothed data gets higher and higher. So as you increase correlation with smoothed data, you also increase the p-value of the results … so smoothing actually doesn’t help although it appears to.
See my post on data smoothing and spurious correlation … in addition, google the Slutsky-Yule effect:
In other words, smoothing causes spurious results.
However, hang on … OK, I just did a cross-correlation analysis with the annual data … max correlation is 0.08 with a ridiculous lag of 13 years. Not significant.
Sorry, amigo, still no correlation at any lag with either monthly or annual data.
w.
I don’t understand what mud and vile attacks you refer to. Perhaps you can quote my exact words where I do that. You have yourself manifested multiple times that you don’t want to read the articles where the evidence is discussed, but you just want to do your own statistical analysis of the data discussed. Your lack of interest on previous published research is well known and contrary to well established scientific principles.
I don’t see how you can feel insulted by my pointing out of what you yourself manifest. Perhaps by adding my opinion that lack of reading is a poor scientific practice.
I had said to Javier:
I then went on to point out the flaws in the science of the post that you cited. Rather than reply to my scientific objections, you now continue focusing on the trivial;
I already quoted your exact words when I made the statement, Javier, but I’m glad to do it twice, as this is important.
Now, that is a personal attack that has NOTHING to do with my science. It is a claim that because I hadn’t read a random blog post, not even a random study in a scientific journal but a random blog post, that my work could “never result in good science”.
That’s not objecting to my scientific claims about the sunspot cycle. Instead, it is an ugly ad hominem attack that has nothing to do with the quality of my or anyone’s science. I call that kind of an attack “throwing mud”, because you are attempting to smear my name rather than attack my scientific claims.
And while that is bad enough, what makes it vile is that you don’t even have the balls to sign your own name to your attack. That’s dirty and underhanded. I don’t mind people posting scientific claims or objections under an alias. I do object to people using an alias to hide behind while launching personal attacks, as you did.
Gabro, of course, followed your lead and jumped right in on your unpleasant and unscientific bandwagon in the first comment on your ad hominem claim;
Gabro December 26, 2017 at 5:31 pm
Note that now we have another person without the courage to sign his own words who is attacking me instead of disputing my science. That’s what you are encouraging, Javier, personal attacks by cowards who won’t sign their own words instead of scientifically based attacks on my sunspot claims, and that’s why such an attack is vile.
Finally, in response to your comment I did a quick analysis of the scientific faults in Dr. Roy’s blog post, the main one being that it doesn’t have enough information to replicate his results. I commented that no doubt, since you saw his blog post as being so critical to understanding the field, that you could explain to us all how to duplicate Dr. Roy’s results.
Perhaps your reply to my scientific objections to his blog post got lost in the mail …
Hope this helps,
w.
It is your own recognition that you don’t read the existing bibliography on what you write, and it has to do EVERYTHING with your amateurish takes on science. If you take it as a personal attack that’s up to you, but it is a fact.
Before writing left and right that the 11-year solar cycle has no effect on climate you should read what others have done about it. As you don’t do that your contributions are both wrong and irrelevant. You think you are doing science. You are not.
Roy Spencer is not the first or the only one to claim (and show) that the 11-year cycle has an effect on tropospheric temperatures. This is so known and accepted that it is non controversial and it is also shown by climate models. Ask your friend Leif, he knows. But of course you don’t know that because you don’t run searches about what you write and don’t read scientific articles about what you write. Worse to you.
Camp, C. D., & Tung, K. K. (2007). Surface warming by the solar cycle as revealed by the composite mean difference projection. Geophysical Research Letters, 34(14).
http://onlinelibrary.wiley.com/doi/10.1029/2007GL030207/full
By projecting surface temperature data (1959–2004) onto the spatial structure obtained objectively from the composite mean difference between solar max and solar min years, we obtain a global warming signal of almost 0.2°K attributable to the 11-year solar cycle. The statistical significance of such a globally coherent solar response at the surface is established for the first time.
Zhou, J., & Tung, K. K. (2013). Observed tropospheric temperature response to 11-yr solar cycle and what it reveals about mechanisms. Journal of the Atmospheric Sciences, 70(1), 9-14.
http://journals.ametsoc.org/doi/full/10.1175/JAS-D-12-0214.1
Using 54 yr of NCEP reanalysis global data from 1000 to 10 hPa, this study establishes the existence and the statistical significance of the zonal-mean temperature response to the 11-yr solar cycle throughout the troposphere and parts of the lower stratosphere.
Oh boomer. You are wrong. Once more.
Your Tung paper claims of their tiny effect:
The statistical significance of such a globally coherent solar response at the surface is established for the first time
This flies in the phase of your claim that there are hundreds of papers that have already shown such a connection…
Uhh, what are we talking about? Climate or surface temperatures? Cause I don’t remember saying that hundreds of papers have shown a connection between the solar cycle and surface temperatures. Perhaps you can refresh my memory when did I say that.
Climate or surface temperatures?
Climate as measured by surface temperatures. Perhaps you now claim that climate and surface temperatures have nothing to do with each other?
Well, they ain’t the same. Places with similar average temperatures can have very different climate. And I have never said that there are hundreds of articles on the effect of the solar cycle on surface temperatures. I think you are misquoting not only what was said, but also who said it, and you are referring to something Gabro said above.
Places with similar average temperatures can have very different climate.
That is why we compute global temperature anomalies. But, OK, so now you claim that there is no correlation between said anomalies and the climate defined by them. And therefore, no correlation between solar activity [as Tung et al. found] and climate defined by the global temperature anomalies. Fair enough, people claim so many things.
The claims are in the articles, Leif. I just agree with some and disagree with others. I disagree with Svensmark and I agree with Tung. That the solar cycle affects the global average temperature by 0.1-0.2°K is well known and non-controversial. Willis is obviously wrong on that.
I just agree with some and disagree with others.
Called cherry-picking…
That the solar cycle affects the global average temperature by 0.1-0.2°K is well known and non-controversial.
Buit, as you also claimed, global temperatures are not indicators of global climate. this seems at variance with the commonly accepted wisdom.
Willis is obviously wrong on that.
The Tung claim is vague [less than 0.2 C] and is controversial as the statistics is poor [high auto-correlation] and is anyway at the noise level and is not much different from the expected TSI-effect [0.1 C], so can hardly be taken as showing that solar activity is a dominant player in climate variation over the period Tung et al. investigated.
Willis is quite right that it is very difficult to dig a strong [or even just convincing] solar effect out of the noise.
Nope. Scientific articles often disagree with each other. It is called having an opinion.
Temperature is just one variable. Precipitation, humidity, wind strength and direction, cloud cover, pressure, temperature gradient, albedo. Climate is composed of many variables. Perhaps that commonly accepted wisdom is not so wise.
The question was if the solar cycle effect on climate is discernible, not if it is dominant. Do not raise strawman arguments. It is discernible if you know where to look and how to look.
No he is not. You just have to know where to look.

30 mbar temperature over the North Pole segregated by QBO phase.
Nope. Scientific articles often disagree with each other. It is called having an opinion
Opinions are not science. It is more correctly called confirmation bias.
Temperature is just one variable. Precipitation, humidity, wind strength and direction, cloud cover, pressure, temperature gradient, albedo. Climate is composed of many variables.
Global climate is usually described by global temperature determined by incoming solar radiation [TSI] averaged over the globe. All the other things derive from that. And with so many things to pick from you can always find some spurious correlations somewhere.
The question was if the solar cycle effect on climate is discernible, not if it is dominant
The great climate debate is whether it is dominant. If not, it is not of interest.
You just have to know where to look. 30 mbar temperature over the North Pole segregated by QBO phase
More cherry-picking. Looking for what you want to find and you will find it somewhere.
There are many papers that show that the QBO is not of solar origin.
Javier said:
Javier, thanks for the graphs of the 30 mbar temperatures above the North Pole. I can’t think of a part of the atmosphere that we know less about but what the heck. You do realize that what they are looking at is an altitude of about 22,000 meters, right?
In addition, your graph shows the authors selected two out of the possible twelve months of those rarely measured temperatures at the 30 mbar level.
And when I look at the original document I find no mention of any Bonferroni correction or correction for autocorrelation in their assessment of statistical significance.
In any case, you seem to have misunderstood my request. I’m a licensed ham radio operator, so of course I know about the sunspot cycle’s influence on the outermost layers of the atmosphere.
What I have NOT been able to find evidence of is an equivalent influence on any surface datasets. And that is what I’ve requested … so I fear your discussion of what happens 22 kilometers above the North Pole is not responsive to my request.
Still waiting,
w.
PS—Next time cite the provenance of your graph. I had to find it on the web. Wasted time. Next time I won’t even bother, I’ll just ignore whatever it is.
Javier
3 hours ago
From the Tung paper …
You claim that the effect is “well known and non-controversial” … the Tung paper you cite says it’s brand new, never seen before, this is the first time it’s been shown to be significant …
More to the point, the Tung paper says:
You appear to have not noticed that they are NOT comparing sunspots with observations made here in reality.
Instead, they are comparing them to the output of a computer climate model which is supposed to emulate reality. You know, the kind of model where when they don’t have temperatures, they make up temperatures.
Now, these climate models are known to have a host of problems. I’m sure you’ve seen their poor showing over the last couple of decades. You likely don’t trust their output … well, except when it agrees with your theories. Then, I guess, computer models are just fine …
There is a worse problem, however. These models have been shown have outputs that are just scaled, lagged linear transforms of their inputs. So whatever you put in as input will be reflected in the output. Note that this is NOT true in the real world. The interactions of the actual Earth systems of land, ocean, atmosphere, biosphere, and electrosphere are far too dissipative, things simply get lost in the overwhelming noise of reality.
And since in your whiz-bang computer model the inputs necessarily appear in the outputs, and they use solar variations as inputs, if you are surprised to find traces of the solar inputs in the outputs, it either means you’re not a computer programmer or you haven’t thought this all the way through …
And as a result, finding such traces of solar inputs in the entrails of a computer climate model’s output is as meaningless as finding them in the entrails of a chicken …
w.