I was notified by a friend that Tamino is slagging Anthony and me over at his blog, where I was banned from commenting years ago because I pointed out some unwanted facts to him. Of course, Tamino is still free to comment here, we don’t censor the views we might disagree with—that’s science.
To begin with, attacking a man where he cannot reply is just scummy. But that’s no surprise, it is Tamino after all. He doesn’t even have the albondigas to sign his own name to his own words … so I expect nothing from him and am yet to be disappointed. As Churchill is reputed to have said of one of his opponents, “He’s a humble man … and he has much to be humble about”.
Tamino’s post is called Why I call Anthony Watts and Willis Eschenbach “denier”. Charming. Of course, Tamino knows that this term “denier” was picked because of its association to “Holocaust denier”, and that it is an objectionable, anti-scientific term designed to pluck at his reader’s heartstrings and avoid their intellect … but like I said. Pond scum.
He claims that Anthony and I are “deniers” because in a post about the USCRN, the US Climate Reference network, I pointed out a fact, which is that the US has not shown any statistically significant warming since the USCRN started.
Tamino starts by agreeing with me:
The estimated trend is upward, but its uncertainty is large because the time covered is so short. I estimate the warming rate at 10 ± 14 °F/century (95% confidence limits). Because the uncertainty is so large, we say that the claim the trend is upward fails to reach “statistical significance.”
But he goes further:
If this was the only data we had, we would know that the trend was highly uncertain; it could be as low as cooling at 4 °F/century, but it could be warming at a whopping 24 °F/century.
But we do have more data for the “lower 48” states of the U.S., from the National Climate Data Center, all the way from 1895 to the present.
He then proceeds to post up a graph comparing the NCDC data from 1975 to the USCRN data from 2005.

Regarding this graph, Tamino says:
This makes it abundantly clear that ignoring the trend from NCDC data, mentioning only the USCRN data, helps our understanding not at all. It only serves one purpose: to muddy the waters.
Look, folks, that is comparing apples to oranges. By that logic, we should be able to throw up the trend from say 1940 to 2017 and claim that that “helps our understanding” of the much shorter trends … sorry, but that simply doesn’t work. And why did he pick 1975 as his start date?
So … what’s next? Is Tamino going to tell us that the trend from 1850 can help our understanding of the current hiatus in warming? How about the trend since 1650? Hey, it’s been warming since 1900, and according to Tamino, that should disprove the general warming hiatus from 1945 to 1975 … but actually, it does nothing of the sort.
Here’s a protip for Tamino. If you want to compare trends, you need to compare them over the same time span. I’d do that for the NCDC data that Tamino used, as I suspect that there is no significant trend in that as well … but then like far too many folks masquerading as scientists, he didn’t post a link to his data as used.
And in any case, as I said in my previous post:
So … still no significant trend. Yes, the dataset is short, 13 years … but there are a number of 13-year periods in US temperature history which do have significant trends.
Facts are stubborn things, and I know Tamino doesn’t like it, but the facts are that the best data we have say there is no significant warming since 2005. Adding other data from 1975 onward doesn’t tell us anything further about the post-2005 trend.
Ah, well, I take comfort in knowing that when I start taking flak, it means I’m over the target.
I’m still in the Solomon Islands, for reasons I related in my first post from there, Feasting. My second and third posts from the islands, entitled Munny and Hauling Out, are up at my blog, Skating Under The Ice. So while Tamino is gnashing his teeth and pointing fingers and angrifying his blood and wailing “Deniers! Deniers!” at Anthony and me … well, me, I’m living the dream … you’re welcome to come along.
My thanks as always to Anthony for this amazing blog, where people are free to hold far-ranging discussions on scientific matters. The current mania for censoring speech that people happen to disagree with, from Tamino’s and Gavin Schmidt’s blogs, to the Democratic Party refusing to condemn Antifa’s violent censorship, to the college campuses all across the US, is a horrible and worrisome trend. I stand for free speech, this blog stands for free speech. Tamino and Gavin stand for censorship, which should tell you something about the quality of their science. Go figure …
My best wishes for everyone,
w.
Added: It is important (at least to me) to point out that “Tamino” is actually Mr. Grant Foster of Portland Maine. I don’t have a whole lot of respect for people who label other people with pejoratives such as “denier” while being too cowardly to put his/her name to such labeling – Anthony Watts
Thanks, Anthony. Also, there are some interesting links in the “Related Posts” just below.
Man, the sockpuppets have been triggered tonight.
You have no idea.
yeah I think we do, the trench warfare loons are out barking at the moon tonight.
Maybe it is the ‘supermoon’, lol.
Willis (and others)
There seem to be three basic propositions that one could ‘deny’ in the overall climate debate, and the alarmists seem to have adopted a deliberate strategy of confounding the three. From mildest to most extreme, I would categorize them as:
1. The average temperature of the earth, as far as we can tell, seems to have warmed about 1 degree C over the past 125 years, with increased levels of CO2 at least partly responsible.
(My observation: Most alarmists and skeptics agree on this rather humdrum and not at all exciting conclusion; many of those who accuse folks of being ‘deniers’ trot this one out to use as a straw man in claiming that skeptics are fools.)
2. Global temperature increases are accelerating due to the the amount of CO2 in the atmosphere, and we will see an additional 2-4 degrees C tempterature rise over the next 80+ years. This temperature rise will cause dangerous increases in sea levels, strong storms, and prevalence of tropical diseases.
(My observation: Most of the scholarly debate inside both the alarmist and skeptical communities relate to these set of propositions. It is in evaluating the future prognostications that the hockey stick and ‘warmest temperatures since…’ memes come from. Declining station coverage, questionable bias adjustments, and valid/invalid proxies all are important parts of these debates.)
3. Increasing CO2 emissions, especially under BAU scenarios, will cause the earth’s climate to spiral out of control, perhaps making the planet unliveable for humankind. Melting of the Antarctic and Greenland ice masses, failing of the thermohaline circulation, and boiling oceans are some of the imagined consequences of these doomsday predictions.
(My observations: Among the alarmist crowd, only the committed crackpots like Al Gore and Bill Nye seem to talk about this regularly, although James Hansen has been in this camp from time to time. Unfortunately, these are the scenarios that seem to be believed by a lot of journalists, members of Congress, and more than a few entertainers. Furthermore, although folks like Tamino, Gavin Schmidt, and Michael Mann would probably not be caught dead spinning this kind of tripe, they seem more than willing to let others do it.)
So, you can put me down as a denier of proposition #3, a skeptic about proposition #2, and a believer in proposition #1. I guess that makes me……??
Good name.
point number one is reasonable.
points 2 and 3 are utter nonsense unsupported by either real world science or history.
I see now why David Appell, aka crackers 345, is not thought of well here. He is a good example of a bad example. His mean-spiritedness exemplifies the attitude of the CAGW “believers” while he/they ignore actual science an its uncertainties. I’m much happier being called a “skeptic” than being called what he and his ilk are: “pathetic”.
I didn’t think crackers was Appell. I always considered Appell a knowledgeable jerk. Crackers345 seems to be just a jerk with too much time. Pity.
That may be the funniest thing I read all day!
“I see now why David Appell, aka crackers 345, is not thought of well here. He is a good example of a bad example. His mean-spiritedness ”
Yeah, Appell is the reason I don’t partake in Roy Spencer’s blog. Who wants to put up with Appell’s kind of BS constantly. Now he is over here starting trouble.
http://images.remss.com/figures/climate/RSS_Model_TS_compare_trop30v4.png
Tropical (30S to 30N) Mean TLT Anomaly plotted as a function of time. The black line is the time series for the RSS V4.0 MSU/AMSU atmosperhic temperature dataset. The yellow band is the 5% to 95% range of output from CMIP-5 climate simulations. The mean value of each time series average from 1979-1984 is set to zero so the changes over time can be more easily seen. Again, after 1998, the observations are likely to be on the low side of the simulated values, indicating that the simulations as a whole are predicting more warming than has been observed by the satellites.
http://images.remss.com/data/msu/graphics/TLS/plots/RSS_TS_channel_TLS_Global_Land_And_Sea_v03_3.png
Global (80S to 80N) Mean TLS Anomaly plotted as a function of time.
Nocooling for over 20 years
But there is at the C10 level and above.
http://images.remss.com/msu/msu_time_series.html
Tho not for 20 years admittedly.
“Again, after 1998, the observations are likely to be on the low side of the simulated values, indicating that the simulations as a whole are predicting more warming than has been observed by the satellites.”
I would suggest that all stat temp products after ’98 are suspect due the disconnect at the change over from the previous MSU sensor to the AMSU onboard NOAA-15 …..
Nonsense, it’s replicated in the surface data as long as they actually use measurements, and don’t make up data.
It’s just what temps are following the distribution of water vapor over land, and the ocean cycles alters that.
“Nonsense, it’s replicated in the surface data as long as they actually use measurements, and don’t make up data.”
What? – the fact that radiosonde data diverge form a single instrument when that SINGLE instrument is replaced, is “replicated” on the surface?
Bizarre comment micro.
“It’s just what temps are following the distribution of water vapor over land, and the ocean cycles alters that.”
As I’ve told you several times (just basic meteorology).
You have it backwards.
WV follows temperature my friend.
And what you show is proof of the GHE of H2O.
Of course, what you don’t seem to understand is it adjusts how much GHE is emitted to control how cool it gets late in the morning while still dark. And no, you have it backwards, but it is meteorological, you guys just aren’t used to designing and simulating regulating circuits, and failed to recognize that nonlinear conductance (in this case temps from the surface to space) when controlled by a different parameter (the effect is tied to temperature with high RH) is how you design a regulator. you can verify by seeing if the output follows the control signal.
Which it does.
It also explains the wide range of Min T across the planet, varies appropriately with water vapor,as that is the stored energy source, and in fact that’s another requirement for a good regulator, a place to store energy to use to regulate. For regulators, that’s a capacitor. And in some ways, temps work like a switching power supply, a single pulse of energy comes in, some powers the load(geothermal), some goes into storage(water vapor), when the input pulse drops, energy from the capacitors supply the load, if the RC constants are sized to the load, you’d see a steady supply output. In the planets case, the energy is supplied only when air temps near dew point, then condensing water vapor, releasing the heat of evaporation as sensible heat slows cooling of the surface, that’s your GHG Effect, the only one that matters because that’s the only one that’s non-linear. But since you don’t know that is how a transistor works, this all means nothing to you. And why you never figured this out and I did.
Believe it or not, this will become part of the science of our planets climatology, and is why we do not have to be concerned for increases in Co2, or the stupid temperature series that don’t matter, that we’ve argued about for 20 years.
And I don’t know what the radiosonde results have to do with changing a surface station, when comparing data for the entire surface station record set.
“Of course, what you don’t seem to understand is it adjusts how much GHE is emitted to control how cool it gets late in the morning while still dark.”
Err, YES.
Why do you think that is news to me or any meteorologist??
I’ve seen/measured it more times than you’ve hot dinners.
But the ALL OF the surface of the planet does not have it’s emission to space regulated in such a way. Irrelevant anyway as there is quite a few miles above the surface in which non-condensing GHG’s also “regulate” emission to space.
Look up the Beer-Lambert Law re reference to path-length.
Surface inversions trapping WV/H2O still radiate to space above …. they can (almost) just as efficiantly as the surface as there is little temp drop over such a distance. At ~ 8km where the effective radiating surface of Earth lies, efficiency is very much reduced however, with the ave temp there 270K.
That, along with the drier zones of the planet and aloft is why CO2 does what it does.
“And no, you have it backwards, but it is meteorological, you guys just aren’t used to designing and simulating regulating circuits”
Circuits have nothing to do with it – meteorology and radiative physics very much does however.
> I pointed out a fact, which is that the US has not shown any statistically significant warming since the USHCN started.
Typo? I think you mean since USCRN started?
Tru dat … I’ll change it. Thanks. I hate typos.
w.
Tamino’s Open Mind (Already Made Up)
The snide remark is that his mind is so open his brains fell out.
The important things about CRN is this.
1. CRN represents the golden standard in stations. Triple redundant, high temporal resolution,
documented siting that comports with the LeRoy standard.
From this we can test certain things.
A. If CRN is the gold standard and other stations are “corrupt”, then we can expect a trend difference between them. We check this. Other stations do not differ from CRN. If anything they have to be adjusted
UP to match it.
B. There is a concern that adjustment codes will corrupt good stations. For example, people commonly
believe that if you have 1 good CRN station and 10 bad stations surounding it that the bad
stations will force a change in CRN stations. This is false.
C) There is a common belief that most stations are not like CRN stations in their siting. This comes from
incomplete census of other stations, like just checking USHCN. We can ( I have ) characterize
the CRN stations using metadata. We can examine
1. the distance to the nearest airport
2. the surounding population
3. The land class — urban, trees, feild etc
4. the impervious area. the amount of land that is paved. We are able to do this down to a 30
meter resolution and in the near future to a 5 meter resolution.
5. the distance from any body of water
6. the amount of water surface nearby.
7. In the near future we will be able to count the buildings in the area automatically
This allows us to build a filter. The Filter is constructed by summing the features of a CRN station.
population less than x, y km from an airport, z% imperivous surface within a radius of r,
etc etc.
Once you have a filter you can Score all the other stations in the US and the world and see
how many match the siting criteria.
You would be amazed how many sites match the CRN criteria.
The last thing you can do is check this AUTOMATED process against the answers you get if you
send people to do the job of site survey
This gives you an accuarcy measure for your automated classification.
As the years go on the answer will not change. year in and year out the CRN stations will match
the so called ‘bad” stations. Year in and year out folks will compare and see that the adjustments
are correct.
And CRN will spread out to other countries.
When We first “discovered” this network years ago ( almost 10) we had a theory. After a few years
CRN would show us how bad the bad stations were.
well its been 10 years.. and the answer is…
The “non crn’ network is pretty good. Better if you adjust it.
Mosh, I fear I’m done with you until you answer the question I’ve asked over and over regarding the BEST “scalpel” algorithm. The issue, as you well know since I’ve asked so many times, is this:
Suppose we have a station in the middle of town. The town is growing, and the UHI is causing the temperature to rise.
So they move the station to the outskirts, which are cooler. However, the town grows up around it, leading once again to a spurious rise.
So they move it to the nearby airport … but prop planes are replaced with jets, and the runways are extended, and the suburbs grow up around it …
Assuming that the temperature overall is stable, neither warming nor cooling, this gives a trendless saw-toothed wave, with a temperature drop at each move.
BUT the “scalpel” method cuts that record into three records. Then it reassembles them into a single record. Presto! The “scalpel” method just converted a trendless record into a clear trend.
Now, I’ve asked both you and Zeke Hausfather about this time after time. You used to tell me that yes, you’d checked that and it wasn’t a problem. Fine, I said, provide me with the test methodology and the results … crickets.
So I asked again … and again … at which point you’ve given up answering me altogether. I even asked in a comment on your blog, and I’ll be hornswoggled if you didn’t censor my comment without any indication that it ever existed!
Really? Foolish me, I was astounded that you would sink that low.
As you might imagine, therefore, at this point I don’t believe a damn word that comes out of your mouth. So you’re free to talk to the hand, because my head is not listening. And when you say above that
I just laugh. Why would anyone believe you at this point? I used to believe you when you said things like that, but hard reality has stripped away both my illusions and your façade of honesty.
I’m still awaiting your answer. In the meantime, feel free to impress the rubes with your unsupported, uncited, unverified claims. I don’t believe a word of them.
w.
PS—It is worth noting that I was an early supporter of the “scalpel” method until someone pointed out the sawtooth wave problem. I thought “Mosh and Zeke must have considered this” … and the whole farrago began with that innocent inquiry.
Tamino who?
“Look, folks, that is comparing apples to oranges.”
No, Willis, I think it’s more like comparing appells to crackers.
co2isnotevil December 4, 2017 at 11:37 pm
I’m sorry, but that’s not true. The laws of physics say that increasing CO2 will cause an increase in atmospheric absorption. And we have verified this both in the lab and by real-world measurements.
But whether that in turn causes a surface temperature change is NOT either falsified or confirmed by the laws of physics.
Let me give you an example of why that is true.
Suppose that I want to find out about how temperature affects solids. I take a 75 kg block of steel, and I put the bottom end of it in a bucket of hot water. I duct tape a thermometer to the top end in the best experimental fashion, and I start recording how the temperature change with time. At first, nothing happens. So I wait. And soon, the temperature of the other end of the block of steel starts rising. Hey, laws of physics, right?
To verify my results, I repeat the experiment with a block of copper. I get the same result, the end of the block that’s not in the hot water soon begins to warm up. I try it with a block of glass, same thing. My tentative conclusion is that the laws of physics say that if you heat one end of a solid, the other end will eventually heat up as well.
So I look around for a final test. Not seeing anything obvious, I have a flash of insight. I weigh about 75 kg. So I sit with my feet in the bucket of hot water, put the thermometer in my mouth, and wait for my head to heat up. Here’s the experimental setup:
After all, the laws of physics are my guideline, I know what’s going to happen, I just have to wait.
And wait … and wait …
I’m sure you can see the problem. Simple physics is simply inadequate for complex systems, and the climate is one of the more complex systems we’ve ever tried to understand. Your claim ignores the thermoregulatory systems of the climate.
For example. Albedo in the tropics is highly correlated with temperature. When the tropics is hotter, clouds form earlier. If the tropical cumulus cloud field forms on average fifteen minutes earlier, that will reduce the solar forcing by an amount equal to a doubling of CO2.
So no, the “laws of physics” do NOT say that incremental CO2 increases perforce must warm the surface as you claim.
Best regards,
w.
Agreed, Willis. Still nothing more than an ASSUMPTION that CO2 level drives the earth’s temperature, with NO empirical evidence in support, and plenty to counter it. They always conveniently forget that key portion of their pet hypothesis…”ALL OTHER THINGS HELD EQUAL,” OR – even WORSE, assume the feedbacks are POSITIVE, again with NO evidence to support this and plenty to counter it.
Willis,
But if you stick your feet in a tub of molten iron, the aforementioned laws of physics start to work again. If you put the feet of a corpse in the tub of cold water and die, again the laws of physics start to work.
In the case of a living person, there’s an active control system that maintains a constant internal temperature over a very wide range of external temperatures, the internal, implicit source of power being glucose. The planet has no such active control system, otherwise we would not experience much difference between summer and winter. The planet only exhibits dampening which slows down the response to change, none the less, the average response to average stimulus still must obey the macroscopic laws of physics.
The physics that supports the idea that power absorbed by the atmosphere in turn affects the surface temperature is COE, where in the steady state, the power being absorbed by the atmosphere is equal to the power being emitted by it which emits power both into space and back to the surface. Measurements show that the average distribution of power emitted into space and power returned to the surface is independent of everything, except geometry, and on average is split 50/50, thus some fraction of what the atmosphere incrementally absorbs must be returned the the surface, thus increasing the surface temperature until that much more is being emitted by it.
Oh yes it does!
Warm water and water vapor are both thermal energy storage, the equal of an electronic capacitor. And the that average matches because it self regulates, stop looking at 24hr averages, and start looking at what’s happening.
That is exactly what this shows, and why I have been showing it for a year now.
Look at how net radiation drops off with rel humidity, and the temp difference between the surface air temp and zenith temps are still relatively the same as when it’s cooling at 3-4F/hr.
micro6500,
The climate system is not an active system. The distinction between an active and passive system is active gain. Active gain is powered gain where more power comes out of the amplifier than goes in and the additional output power comes from an implicit power supply. This is what Bode means by the requirement for an implicit power supply powering the gain that he spells out in the first paragraph of his book.
More to the point, this implicit power supply can not be the same as the signal input (forcing). In other words the Sun is not an implicit power supply, but the forcing input to the system.
Temperature dependencies are not properly modelled as feedback controlling an active system and the fact that climate science subverted Bode to model the climate this way is why it’s so broken. The reason is that this is the only thing that provides any theoretical plausibility for the absurdly high sensitivity claimed by the IPCC and is why warmists are so resistant to accepting that Bode doesn’t apply to the climate.
Yes, the planet stores energy in a way similar to the way an RC circuit stores energy, but resistors, capacitors, inductors and delay elements are all passive components. To make an active system, you need to add a powered amplifier and nothing exhibiting this property exists anywhere in the climate system.
Consider a thermistor. This is a highly temperature dependent resistor, but still a passive component. Consider a voltage variable capacitor. This is also a passive component.
Here’s a little snippet of C code that shows how a delay element can make the surface warmer than the Sun can do on its own. The time step is representative of the average delay. Note that delay is not the same as feedback.
#include
int main()
{
double Pin = 240; // forcing power entering the system
double Pdelay = 0.0; // power being absorbed and delayed by the atmosphere
double Psurf = 0.0; // power arriving and emitted by the surface
double Pout = 0.0; // power leaving the system
double A = 0.75; // fraction of Psurf absorbed by the atmosphere
double F = 0.5; // fraction of Pdelay that’s returned to the surface
int i; // time step equal to the average delay
for (i = 0; i < 20; i++) {
Pout = Psurf*(1.0-A) + (1-F)*Pdelay;
Psurf = Pin + F*Pdelay;
Pdelay = Psurf*A;
printf("Pin = %g, Pout = %g, Psurf = %g\n", Pin, Pout, Psurf);
}
}
No, you’re wrong, you need a nonlinear function.
Consider the sun’s daily impulse of energy as the same as a half wave bridge supplying power to a switching regulation.
And there is the required nonlinear function.
Non-linearity is irrelevant to the distinction between active and passive. For example, you can put a chunk of ferrite in a wave guide and the combination is still a passive, albeit non linear, device. Ordinary diodes are not active components either. Active devices are transistors (current gain), tubes and fets (voltage gain) and even tunnel diodes that manifest gain by incremental negative resistance. Note that active devices used for Bode amplifiers are operated in the linear region of their transfer function and that class C amplifiers and logic switches that are non linear can not be modelled with Bode’s analysis.
I’ll also note I spent 3 years doing semiconductor failure analysis, and was a electronics design tool and simulation SME for 14 years.
micro6500,
I know your background which is why I’m using EE terms that I hope will resonate with you. Before I went dot com, I also spent a considerable amount of time in the semiconductor industry designing and directing the design of GPU’s, CPU’s and SW tools to accelerate chip design including logic simulation (before Verilog) a static timing analyser (before Pathmill), logic synthesis (before Synopsys) and design rule independent transistor level layout synthesis and optimization (nothing has come close since).
Then go look at how a switching power supply works. Pulse of charge goes into storage, storage and pluse supplies load
Transformers, diodes and capacitors are passive devices. A non regulated supply, switching or otherwise, is not properly an active system. It becomes an active system when an amplifier amplifies the difference between the required output voltage and the actual output voltage and uses this difference to vary the pulse width of the signal sent to the transformer, thus varying the output voltage until it matches the requirement.
No, active has a switching element. There is a switching element, basically you can’t use linear trends for cooling, it’s wrong, and because it is a temp switch it acts as a proper regulator.
And the surface data set confirms the correlation. Which doesn’t exist between either absolute or relative humidity
https://www.researchgate.net/publication/253127549_What_determines_the_nocturnal_cooling_timescale_at_2_m
And then at night just storage maintains voltage, or in this case temp. And you can see it here.

Look starting at about 17:00, that’s when the sky cleared
That steep drop in temp is the noncondensing GHG in operation, then air temp hit dew point and temps stop falling under clear skies till sunrise. And you can see in the ir measurements the delta temp hasn’t changed much, so there an equal energy loss as earlier for 30 or 40% of the spectrum. In the first chart you see net radiation dropping by over 60%, at the same time cooling slows. Something is either blocking that much energy only after rh goes up but not blocking the optical window, or the cooling rate doesn’t change during the night, just as rh goes up added energy appears to supplement loss from surface to slow cooling.
And we have a energy and water vapor loaded column that collapse at night, showing that it had to dump energy to space. And sensible IR from condensing water vapor would radiate in all directions. That imo fits better than blocking, as we know is has to be shedding heat.
Consider the surface to space radiative circuit as a depletion mode fet source is earth heat source, space cold is the drain, and is sensitive to rh on the gate, and load resistance is noncondensing GHG’s and absolute humidity. Water vapor is the capacitive element on the drain.
I think the actual circuit doesn’t operate like that, but they look the same.
micro6500,
” … depletion mode fet …”
But where’s the power supply? I see what you are getting at, but there’s still no active gain and this is the crucial requirement for active control. If the surface temperature was actively controlled, the temperature would be constant night and day, winter and summer. In your example, the fet is implementing a voltage variable resistance and not implementing gain.
Macroscopically, we can model the climate system EXACTLY with the following DE:
Pi = Po + dE/dt
where Pi is the power input from the Sun, Po is the power emitted by the planet and E is the energy stored by the planet (surface AND atmosphere). If we define an arbitrary amount of time, tau, such that all of E can be emitted in tau time, we can rewrite this as,
Pi = E/tau + dE/dt
You should immediately recognize this as the DE describing the charging and discharging of an RC circuit. Since Po is also equal to k*Ps (data confirms k=0.61). Ps is dependent on T^4 (SB Law) and T is linearly proportional to E, the time constant, tau, thus has a 1/T^3 dependence. Since tau = R*C, we can model this with either a R or C whose value has a 1/T^3 dependence.
No power supply and no active gain is required.
Except it’s not a single RC, it changes with high rh. That’s what nobody else saw.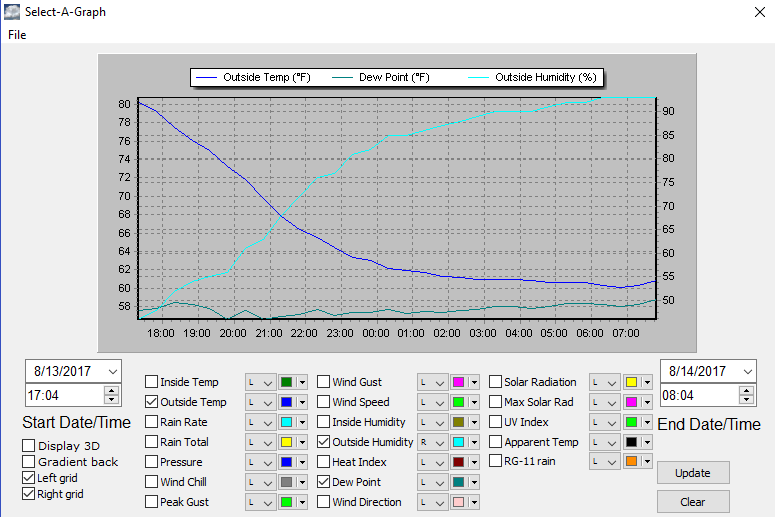
Look at this curve
And remember there’s a -40 or -50F zenith temp visible to the surface at the same time. Something has to supply that loss if energy.
Yes, it’s definitely not a simple RC circuit, none the less, its still a passive system, even if you model the temperature dependent R with a FET based voltage variable resistor.
The crucial missing element is active gain which is assumed by the consensus and is why they’re so wrong. The presumption of active gain provides the plausibility for runaway and a high sensitivity, both of which require an internal source of Joules powering the gain and which has no physical correspondence to any tangible component of the climate system.
It’s the missing internal power supply that provides the plausibility for 3.3 W/m^2 more power above and beyond the 1 W/m^2 of forcing in order to support an 0.8C increase in temperature arising from only 1 W/m^2 of forcing.
Let not argue about active. It’s temperature dependent nonlinear system. It is powered by water vapor (That fundamentally is external to a specific lication) and solar.
Cooling is regulated to dew point, regardless to our changes in Co2. For the same reason, cooling at night limits any amplification during the day.
Water (vapor or otherwise) is not a source of energy but a repository of stored energy and the energy it stores originally came from the Sun (input to the system and not an implicit power supply).
Yes, the interaction between temperature, dew point and relative humidity works to dynamically slow down cooling, but this isn’t a regulatory process with a set point and is just a causal response to change. There’s a significant difference between dynamic (which the climate certainly is) and active (which the climate is not) where consensus climate science conflates these concepts.
If you have Bode’s book, a few other interesting things are section 4.8 that defines sensitivity (climate sensitivity is actually the closed loop gain and unrelated to Bode’s definition of sensitivity). The first chapter also explains the differences between active and passive. Understanding this difference is crucial since Bode makes many contrasts between active and passive systems. For example, a passive system is unconditionally stable and he even offers a proof for that (start from page 108).
The concept of amplification itself doesn’t apply to the climate system as amplification requires the otherwise missing implicit power supply. The C code I showed earlier illustrates how delay can mimic gain. Note that starting from t=0, there is no ‘gain’ (i.e. Psurf == Pi). Only after delayed energy is returned to the surface can the surface emissions build manifesting an increasing temperature and which is universally confused as gain. Note that the inclusion of stdio.h is missing as it was interpreted as an HTML directive and dropped.
If course it’s an energy source as much as the charge stored in a capacitor is.
And yes there is a temperature set point, that’s the whole point, it’s called dew point.as you can see, the flux rate varies over rh for the same temp delta.
I agree that the interaction with the dew point is moderating the rate of temperature change. However; it still eventually cools down at night and warms up during the day. If there was a thermostatic set point, it would stay at the same temperature all day and all night through all seasons. What you’re describing is more like hysteresis which is a property of passive magnetic systems.
What temp does the moon drop to in the dark? Willis shows that thunderstorms breakout when water temps try to exceed about 31C, this shows what controls min T
97% correlation between min temp and dew over 75 million station records
Even 72-73 when station count drops by 80%
micro6500,
The average temperature of the Moon at night drops much lower than the Earth for 2 reasons, first the night is 14 Earth days long and second, there’s no atmosphere to transport heat from warmer portions of the surface to cooler portions.
I seems to me that where we differ is that that you believe that temperatures are a consequence of the due point when I believe it’s the other way around.
What changes first, the temperature or the dew point? Zooming in on your plots, they appear coincident which tells me that the dependency manifests itself in less time then the sample period. But then again, the ‘measured’ dew point is actually calculated from the measured temperature and measured humidity.
Dew point defines min T because the heat of evaporation is in excess to the energy just in enthalpy. It’s an energy barrier that stops temps from falling. True, it has limited capacity, and we see that play out as the seasons change, and each hemisphere warms and cools, unless there’s an incursion of warm humid air, and then it’s warm even though the sun is just as weak as it was a few days earlier.
How does this regulate the average temperature of the planet or the sensitivity of this average temperature to change?
I agree that there’s a connection between the dew point, relative humidity and temperature, since given any two, the third can be calculated. I don’t see how this is a regulating mechanism. If the Sun never rose, the temperature would keep falling. I think the fast rise/fall you see is associated with the short time constant of the atmosphere, while the slower rise/fall is associated with the longer time constant of the land.
At sunset it cools at a “high” rate, until aur temps reach a set temp, based on air temp and dew point. If max temp was warmer say because increasing co2, that night the cooling would change at the identical temp. If the high rate is 4F/hr and it starts 1F warmer, it will take 15 minutes longer to reach that switching temp. If the slow rate is 1F/hr , you exchange cooling rates, and reduce your 1F, to 0.25F increase in min t. The one chart temp stopped dropping completely, it would have cooled the entire additional extra 1F
Fine, but this isn’t a regulating mechanism and just sets a temperature threshold, below which it gets harder to drop further. It’s a non linearity, but is not characteristic of active control.
The relationships between temperature, relative humidity and dew point are deterministic.
http://www.dpcalc.org/
However; given constant absolute humidity, as temperature decreases, the relative humidity increases until the dew point is equal to the temperature at which point water condenses out of the atmosphere and the latent heat temporarily maintains the temperature until the atmosphere runs out of water to condense.
That is a regulating mechanism, and it turns on and off. Yeah deterministic just like a voltage regulator:)
As I see it, it’s just one of several mechanisms implementing the non radiant return to the surface of the latent heat that cooled it as the water initially evaporated and only relevant when the absolute humidity is relatively high to begin with. Another return mechanism is rain. Another is lightning, wind and weather in general.
It’s certainly a contributor to a non linearity relative to transient temperatures, but if the absolute humidity starts out low, it takes much longer to reach the point where the dew point is equal to the air temperature. In fact, where I live, it’s dry enough that dew in the morning is a rare event. In the mountains on a clear winter night, there’s not much absolute humidity to begin with and the temperature can drop quickly all night long.
Yes, and it has a very large drop in night time temps, which the tropics don’t.
And this is important in that it’s the base discharge rate, radiative cooling only, all those other involve convection.
I don’t think you’re ignorant Willis- I just think you’re genuinely stupid. You were probably banned because it takes a great deal of mental effort to debate with the intellectual equivalent of a dining room table and frankly, it’s a waste of everyone’s time.
Here’s a schooling for you which I’ll try not to make too complicated so your facile mind can understand the frankly high school level statistics behind it:
(1) Tamino starts her analysis from 1975 because that’s where the latest linear trend commences. This is clearly stated on her blog if you’d bothered to read it.
(2) As explained in very small simple words on her blog, 12 years is not long enough to show a significant trend- even though the point estimate on that trend is a massive 10 degrees Fahrenheit per century.
(3) That point estimate of the most recent warming is over double the rate of increase calculated from 1975. Interpreting this as “not significant” and that “warming is not occurring” is clearly erroneous as anyone with even a modicum of basic training in statistics will tell you. The correct interpretation is that the point estimate of the warming effect is large, but the standard errors are too wide to draw any firm conclusions because the dataset is far too small- more data is required. Hence the appeal to a larger dataset where that question can be answered with sufficient power.
Here’s a very simple question for you. What would the rate of warming have to be in order to be declared “significant” over the 12 year period assuming the same measured uncertainty in Tamino’s blog? Anybody with about 6 months training in simple undergraduate statistics could tell you the answer- but I honestly wonder if you or anyone on this pathetic excuse for a blog could tell me the answer. And when (if) you work it out, perhaps you might have an epiphany about why your post is so monumentally, unbelievably stupid.
‘monumentally, unbelievably stupid’
I think your name is about to become ‘bruce BANner’
“Tamino starts her analysis from 1975 because that’s where the latest linear trend commences. This is clearly stated on her blog if you’d bothered to read it.”
I just checked Tamino’s blog, and that’s complete nonsense. There is nothing linear about the data in NCDC from 1975 onward, in fact by some strange freak coincidence it seems that the NCDC data also seems to level off at, oh, say 1998-2000. Tamino just decided to hand-draw a curve through the data and chose to make it straight starting in 1975, data be damned. Tamino starts off by admitting that the red line being drawn is “an estimated trend which is not a straight line.” Tamino then uses his own subjective artistry as convenient excuse to then do a linear regression from 1975 and not surprisingly find a linear trend.
Tamino’s post does not make the slightest bit of sense. You can’t disprove the assertion of no statistically significant trend in a first data set from 2005 onward, by merely showing that a second data set shows a statistically significant trend from 1975 onward.
If you’re so gullible that you just blindly accept what someone writes on a blog post without critically evaluating it, maybe you should hold off a little bit before insulting someone else’s intelligence.
‘before insulting someone else’s intelligence.’ – I suspect that was brucie’s entire point, and that he hopes many people will see it his way.
You don’t have a clue how pathetic that post was, do you? Full of self-righteous projection.
Yelling and calling names is why you guys are losing this debate. That and your disingenuousness.
That, and the fact that Mother Nature isn’t doing what you’re (failed) models say Mother Nature should be doing.
This has been a very difficult & unpleasant thread to read. The inability to solve the “actual data” problem, attempting to substitute model results for actual data, and all the while claiming the science is settled is a never-ending echo-chamber…in the mean time, Mother Nature continues on with no perceived evidence of impending doom.
To Extreme Hiatus
your phrase,
They did not choose these deceptive names by accident. The people at the top of this propaganda pyramid are very clever. A more accurate name for Tamino’s blog would be Closed Mind or, even better, Settled Mind.
They need people with the mind open to pour in all the propaganda. If the mind of people is shut, they cannot discharge all the bullshit in.
Agree Leopoldo. They hope that their audience’s mind is not merely open but sufficiently programmed and pried open to be only, and eagerly, receptive to their selective information. But the blog from which the BS pours is not open at all. They want it all one way, their way, which is of course all supposed to be settled and undeniable.
Bruce December 5, 2017 at 2:06 am Edit
You talk to your momma with that mouth? One thing is clear. When a man begins by throwing mud as you are doing, it’s because he’s out of real ammunition.
Onwards. You say.
So what? All that does is guarantee results in one direction, that of the stated trend. That’s called “cherry picking”, look it up.
And as I explained, that’s bull. Since 1850 there have been 15 periods of the same length in the Berkeley Earth global temperature dataset that show a significant trend. You really ought to actually test your claims before you make them, it will save you from this kind of needless embarrassment.
Says the man who erroneously claims that 12 years is “not long enough to show a significant trend” … and now you are making things up out of the whole cloth about what I said in that post. I did NOT say that “warming is not occurring”, not in that post and not in this one. That’s a damned lie and you are a damned liar, but since you are defending Tamino I suppose that shouldn’t be a surprise.
As I pointed out above, your claim that “the dataset is far too small” can be easily falsified by looking at the data. However, obviously, you didn’t do that. The correct conclusion is that the result is not statistically significant, period.
So heck, why not use all the data we have since 1850?
The truth is, what the trend is since 1975 has ALMOST NOTHING TO DO with what the trend is since 2005. For example, the trend up to 1975, starting in 1900, is upward … but the trend 1945 to 1975 was downward. How much does the longer trend tell us about the shorter trend? Heck, it can’t even give us the sign of the shorter trend, much less the value.
If you want to compare trends, you need to use the same time period.
Here’s a simple answer for you. Who cares? If you wish to know that, go ahead and calculate it. For me, it is meaningless to say “if it went up this much it would be significant”. So what? It didn’t go up that much. For me that statement is in a class with the statement “if my aunt had wheels, she’d be a tea tray”. It’s a fantasy about a non-existent reality, and as such, stupendously uninteresting to me.
But since you asked, here’s the real answer—your question doesn’t have enough information to even be answerable. Among other things, it doesn’t just depend on the rate of warming. If it warmed in a slow steady fashion with little variance, a very small trend would do it. But if the data are widely scattered it requires a greater trend. It also depends, and quite sensitively, on the Hurst exponent of the dataset … get back to us when you know what that is, because if you already knew about all of these issues, you wouldn’t ask incomplete questions which cannot be answered for lack of specificity.
Finally, I gotta ask. Are you naturally this charming, or did you go to school or something to acquire your special patina of unpleasantness?
w.
That argument is not logically valid.
For one thing you are comparing a global data set with one for USA only. Global data obviously will have less variance than that for a specific country and so it will be much easier to find short significant trends in global data.
But the main problem is you can only find 15 examples of 12 year significant. This shows that 12 years is not normally long enough to establish a significant trend. It’s also unlikely that a statistically significant 12 year trend is going to be meaningful – if it’s significant it will because there’s an artificially steep trend.
For example, using BEST, the trend over the last 12 years is significant, but that’s only because the recent El Nino has pushed the trend up to an unrealistic fast rate of warming. (0.279 ±0.217 °C/decade).
By contrast most 12 year periods do not show significant warming, despite being part of a longer statistically significant warming period.
Bellman December 5, 2017 at 7:09 am E
First, you can thank tamino for me not using the same dataset, as he did not provide a link to what he used.
Second, while individual countries will have greater variance, they will also have larger trends.
Fifteen examples out of 150 years is around ten percent. So while it is unlikely, it is not statistically unlikely at the p<0.05 level …
Regards,
w.
I’m not sure what you mean by that. Tamino was comparing two US datasets, you were the one who introduced the BEST global set. Looking back I see in your original post you said “there are a number of 13-year periods in US temperature history which do have significant trends.”. But I’d be surprised if there as many short significant periods in US data than in global data.
That doesn’t really tell us anything about the likelihood of a trend being detected as significant. But it still makes my case – most 12 year periods do not show a statistically significant rise even when they occur during longer periods of statistically significant warming.
Your argument is that it means something to say the last 12 years have not shown significant warming – and imply that this means there is an ongoing pause in warming. Yet the majority of 12 year periods during the acknowledged warming periods do not show significant warming. (And as an aside the last 12 years of BEST data do show significant warming.)
Bellman December 5, 2017 at 1:23 pm Edit
As I said, I don’t know what dataset Tamino uses, so I was unable to use that one. But hang on, let’s look at Berkeley Earth data for the US alone …
OK, I just checked. Since 1850 there have been 14 significant periods of that length (13 years), one less than globally. So I would say, you are surprised … however, I’m not. Remember that I said there would be about the same amount in the US, because:
And since 1968, that’s a total of 33 starting years, there have been 9 significant trends more than a quarter.
Really? The frequency of trends in the past tells us nothing about the most recent trend? How does that work?
Actually, no. This is why I ask people to QUOTE MY EXACT WORDS. My argument was that whatever the trend is, it is NOT statistically significant, period, viz:
Since that is undeniably true, I don’t understand your complaint.
Only if you ignore autocorrelation, a far too common mistake in the field … when you adjust for autocorrelation, the p-value of the trend is 0.13, not significant at all. The problem, as Nature magazine put it, is that “Nature is naturally trendy”. As a result, you CANNOT use standard statistics to calculate the significance of a trend.
My best regards to you for persevering, and for avoiding the usual ad hominems to focus on the actual science.
w.
Because the trend since 1850 is clearly not linear.


Bellman December 5, 2017 at 7:43 am Edit
Yes, and the trend since 1975 is not linear either. No natural trend is linear, although we approximate them that way all of the time. We say, for example, that the temperature rose ~ half a degree over the 20th century. But that is a statement about a linear trend.
w.
At first glance it looks a lot more linear than pre-1975. There may be a better fit for the warming since the mid 70s, but unless there is a compelling statistical argument it’s generally best to start with the assumption of linearity.
You should care. Dichotomizing the results of statistical analyses into “significant” and “not significant” is not the correct way to do statistics, nor is it the correct way to interpret p values. The inventor of the p-value, Ronald Fisher never intended it to be used in this fashion and by doing so on a grossly underpowered dataset you’ve committed a cardinal sin and come to a conclusion that’s clearly incorrect. Absence of evidence is not evidence of absence blah blah blah.
Most folk who haven’t been trained in high level statistics don’t even know that there is a difference (and indeed a fundamental inconsistency) between “significance tests” as developed by Fisher and “hypothesis testing” as developed by Neyman and Pearson. You, nor the readers on this blog know any of these subtleties, because you haven’t undergone any meaningful training in basic, let alone high level statistical theory.
Take a freely available MOOC on interpretation of scientific data or basic statistics. It will take you about a month to do. Whilst you won’t be an expert, you’ll learn loads and it will help you avoid making silly statements like the ones in your previous post.
Tamino still exists? who cares?
Quite cool from you to give him some advertisement, but not really useful. Just let the dog bark.
Sure enough Nick but why should we assume that such a border would necessarily equate to the calculable or linear*.
*Scale being the matter of issue here!
While not dealing with this post over at Open Mind, Tamino truly loves to ignore inconvenient data when he has a point to make. His current post talks about the rainfall during Hurricane Harvey, and how it was “the heaviest rainfall ever” and “two of the top three”, with the two days at 250mm each day and a third day just under 250mm. And he then goes on to say that while Hurricane Harvey wasn’t caused by climate change, climate change clearly made it worse.
Fortunately, this is easily verifiable. And in doing so, we can see his claim of “worst ever” is lacking. According to NOAA, in 1979 TS Claudette dropped 42 inches on Alvin TX (a suburb of Houston located about halfway between downtown and the Gulf of Mexico) in a single day. And 42″ is equal to 1060mm! So his “3 of the 4 worst rainfall days” don’t even total to the rain in Alvin over a single 24 hour period! I posted this to his site and it appeared for a very short time before being removed totally.
He’s now embroiled in a “let’s hate Texas” battle with his regulars – and wonders why they are so insulting to Texans. Maybe if he took time to answer technical questions with more openness and less dismissiveness he would cultivate a better clientele.
In 1963 hurricane Flora stalled over Cuba for a few days and dropped over 100 inches of rain in one location. Harvey’s measly 60.58″ dropped over several days pales in comparison.
Living in the US, “holocaust denial” is a non issue. Recalling that Al Gore went to divinity school, I always thought of “denier” as a religious term. For instance, from the King James translation of the Bible:
Matthew 10:33
“But whosoever shall deny me before men, him will I also deny before my Father which is in heaven.”
2 Timothy 2:12
“If we suffer, we shall also reign with him: if we deny him, he also will deny us:”
So the way I see it, we’re called deniers because we deny the one true CAGW religion.
I see another religious reference in Tamino’s reply to Eschenbach: a confirming datum:
“…And when (if) you work it out, perhaps you might have an EPIPHANY”
While we all wait impatiently for the USCRN record to lengthen, there are some interesting longer records. The folks at the NWS office in Gray Maine (covers NH and part of ME) posted the following tables of the top 10 meteorological fall months (Sep/Oct/Nov) that are strikingly different.
While Portland ME is on the seacoast, and Concord NH some 100 km inland, the big difference is the period of record. Portland’s is 1941-2017, Concord’s is 1868-2017, stretching back before the typically used 1885-1890 start date of the USHCN record.
From Portland’s data, you could almost sympathize with Grant Foster for being so bent out of shape:
http://wermenh.com/images/portland-fall.png
I’m in walking distance to Concord’s northern boundary. The period around the 1880s were just as weird a time as the 1930s were, but different. Trend? What trend?
http://wermenh.com/images/concord-fall.jpg
Note that https://www.facebook.com/NWSGray/ uses a proper three decade average for defining the current climate normal. Good for them.
Willis noted at the top:
Indeed!
“albondigas” perhaps his cabbage is a little weak as well?
Anthony,
Could I suggest that rather than suffer deliberate attempts by identified posters to create ‘noise’ and thus devalue the standard of conversation, you move their posts to a separate thread, perhaps given a suitable title. This proposal would have the advantage that no-one could claim to be censored, or modded.
Of course you could also give their multiple identities if known, as that would alert everybody to their inherent mendacity.
I for one would welcome such a thread, as it would be a source of amusement.
TonyN
The best way to deal with trolls is once identified, just ignore them. Their reward is getting as many people as possible to react to them. Unfortunately, in a blog with this many readers, there are a lot of people who can’t ignore trolls’ posts.
Heck, I bet Tamino is checking in here several times a day, at least to look at the comment count.
Ric Werme wrote “The best way to deal with trolls is once identified, just ignore them.”
Alternatively, use them as a springboard to declare your beliefs, which then get counted in Google searches and shifts the balance of public opinion.
Unfortunately, the wordpress.com hosted version of code doesn’t allow moving comments.
That’s too reminiscent of the censorship tactics employed by Real Climate and its “Borehole.”
Perhaps we could have a rotating team of troll stompers. The rest of leave responding to trolls to the professionals.
“I estimate the warming rate at 10 ± 14 °F/century (95% confidence limits).”
Is that the same 95% confidence that they had in their models? At one point they said with a 95% confidence interval that “There will not be a 15 year period of CO2 rising where temperatures don’t follow”. Yet we had 18 years.
How, umm…INCONVENIENT!
Speaking of comments blocked, the CBC, Canadian Broadcasting Corp. the taxpayer funded PR machine for the Liberal government has banned me from making comments. I try to correct their false “climate change narrative” and the Meuller investigative sham and their treatment of Hillary as a goddess.
So much for free speech in Canuckastan.
The USA is the only place in the world where free speech still exists.
Socialists and other bad actors don’t like free speech because it interferes with their agenda. They don’t like it when you don’t agree with them, and have managed to take the ability to disagree away from most of the people of the world.
They are trying to take away free speech in the USA, too, but haven’t been successful as of yet.
“The USA is the only place in the world where free speech still exists.”
…
TA, have you ever been to Sweden?
No, I’ve not had the pleasure of visiting Sweden. Are you implying that there are no limits to speech in Sweden? What happens if one criticizes radical Islam in Sweden?
“we don’t censor the views we might disagree with”
But you do pre-moderate all the comments of people like myself who are off message?
And then search the net to see if I’m a real person?
Open is just that…
“But you do pre-moderate all the comments of people like myself who are off message?”
Deliberately and maliciously lying about the professional qualifications of contributors in order to attempt to damage their scientific credibility and thus their careers can hardly be described as being ‘off message’, you odious little troll.
Nor can boasting on the Guardian CIF blogs about how you visit AGW sceptic blogs in order to “tweak the tails of the deniers” (your words).
Griff, your comments are a source of inspiration to all here, you are polite if off message so why would anyone want to pre moderate you?
Tamino is more vocal than sharp, I found when engaging him on some topic which he was mis-interpreting some years ago — I think it was the Marcott data. He didn’t get it even when I explained it simply. Never went back there, no point.
there there griffy
I posted some bayesian analysis of the USCRN data on Tamino’s website. Using a model that allows for lag1 auto correlation (y(t) = phi*y(t-1) + alpha + beta * x(t) + err) I found as Nick states for an AR1 model above that the trend, beta, is at the margins of stat sig at 8.55 +/-8.67F. Presumably in a year or two, if the values more or less follow that trend, it will be ss.
Re the talk about commenters here, there does seem to have been a change over the last 12 months as far as I can see. Where are regulars like Paul Westhaver who I don’t see posting here anymore?