November 2017 La Niña update: She’s back!
Author: Emily Becker
Well, it’s November, and the CPC/IRI ENSO forecast is declaring the presence of La Niña conditions! I could just link to my November 2016 post and head home for the day… but that would be no fun! There’s about a 65-75% chance that La Niña conditions will continue at least through the winter. As we head into our fifth “double dip” La Niña (an unofficial term for when neutral conditions briefly prevail in between La Niña winters) in the historical record, let’s dig into what we talk about when we talk about La Niña.

A quick flashback
If you recall, last month there were several signs of the presence of La Niña conditions. East-central tropical Pacific sea surface temperatures were cooler than the long-term average, accompanied by signs of a La Niña-like atmospheric response (more clouds and rain over Indonesia, less over the central Pacific).
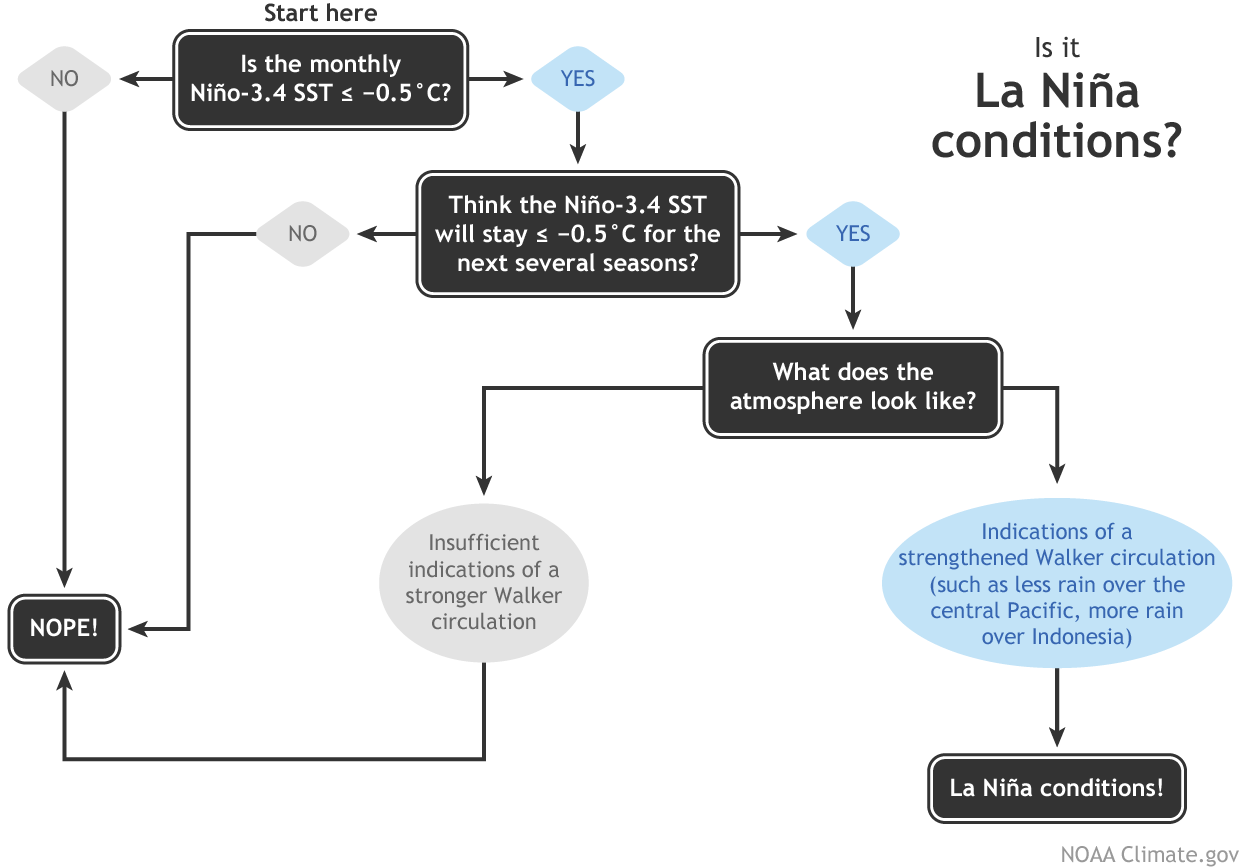
Sea surface temperatures in the Niño3.4 region during September came in at about 0.5°C cooler than the long-term average, the first step in our La Niña conditions decision tree. However, the sea surface temperature was showing some volatility, and we just weren’t confident enough in the second step of the flowchart—that the cooler sea surface would persist for several seasons—to be sure that La Niña’s seasonal pattern had locked in.

Flowchart showing decision process for determining La Niña conditions. Figure by Fiona Martin, adapted by Climate.gov.
What’s different this month?
In October, despite an active Madden-Julian Oscillation moving through the western Pacific (more on that in a minute), La Niña conditions dominated. Stepping through our flowchart, the sea surface temperature in the Niño3.4 region again averaged about 0.5°C cooler than average (check). Most of the computer models forecast that it will remain in weak La Niña territory (between 0.5°C and 1.0°C below average) through the spring (check).
Another factor bolstering forecasters’ confidence that La Niña will remain in place through the fall and winter 2017/18 is the substantial quantity of cooler-than-average waters below the tropical ocean surface. This will provide a source of cooler waters to the surface over the next few months.

Heat content in the upper few hundred meters of the tropical Pacific near the equator (5°N-5°S) from November 2016 (top of image) through October 2017 (bottom of image) compared to the 1981-2010 average. The western Pacific is on the left; the eastern Pacific is on the right. Each row of the image shows a 5-day average. Scan the image from top to bottom, and you can see the weakening and rebuilding of the La Niña cold pool in the central-eastern Pacific. (Still not quite sure what you’re looking at? Read more about Hovmoller diagrams.) NOAA Climate.gov image, based on data provided by the Climate Prediction Center.
Finally, the signs of an atmospheric response I described above continued to be present during October (check). In addition to the clouds and rain pattern, the upper-level winds were stronger than average, another sign of a strengthened Walker Circulation. Also, the Southern Oscillation Index was positive, also indicating a stronger-than-average Walker Circulation. Add it all together, and you get… La Niña!
You promised me an MJO!
Indeed I did. The Madden-Julian Oscillation operates on subseasonal timescales, meaning on the order of weeks or months. The MJO is essentially an area of enhanced convection, storms and clouds that moves eastward along the equator, and can circle the globe in around 4-8 weeks. ENSO (the whole El Niño/La Niña system), on the other hand, is a seasonal, stationary pattern, lasting for at least several months in a row.
The MJO can move through the tropical Pacific and temporarily change conditions, including the winds near the surface.

The surface and upper-atmosphere structure of the MJO for a period when the enhanced convective phase (thunderstorm cloud) is centered across the Indian Ocean and the suppressed convective phase is centered over the west-central Pacific Ocean. Horizontal arrows pointing left represent wind departures from average that are easterly, and arrows pointing right represent wind departures from average that are westerly. The entire system shifts eastward over time, eventually circling the globe and returning to its point of origin. Climate.gov drawing by Fiona Martin.
The near-surface winds in the tropics, called the trade winds, have a close relationship to the surface temperature of the ocean. The trades normally blow from east to west, helping to cool the surface and keep warmer water “piled up” toward Indonesia. If these winds relax, the surface waters in the central and eastern Pacific can warm up. This is a critical feedback mechanism for ENSO.
During La Niña, the trade winds are stronger than average, keeping the surface waters cooler (vice versa during El Niño). If the MJO is active, it can temporarily change the wind patterns. This past month, the MJO was active and moved through from the Indian Ocean into the western hemisphere, weakening the surface winds. But despite the winds temporarily weakening due to the MJO, the ocean remained cool. This leads forecasters to believe that La Niña conditions are in place and we can now see the forest for the trees.
This winter’s La Niña, although expected to remain weak, is likely to have some effect on North American weather and climate this winter. Be sure to check out Mike’s recent post for details on NOAA’s 2017/18 Winter Outlook, and stay tuned to the ENSO Blog for further updates on the great La Niña of 2017/18.
la nina makes it even more
odd that uah’s oct temperature
was a record high for
octobers….
When you can just adjust the numbers any way you like, I do not know why you would be surprised…
I it isn’t that simple; you need an accepted Mosel before you can do that.
Mosel? Motel? Model?
[The mods point out that, if you – the original writer of wrong letters – do not know which was the right letter you writed wrongly, then we – the mods of writing all letters rightly, cannot hope to right the wrongly writed letter the write way. .mod]
An acceptable Moselle – a white wine with a tangy woody flavour, hints of sharp raspberry, and an oriental aftertaste, should bake an accepted Moselle.
I prefers reds.
Auto
– bake – ‘make’
Apologies.
My fault.
Auto
It’s never too early for a Spätlese.
afonz: it’s too
bad you don’t understand
the science of the adjustments.
have you ever tried to?
btw, after adjustments the
long-term warming trend is
lower than before them.
so go ahead and calculate
trends using the raw data if you want
.
let us know your results.
No it doesn’t.
You are proving
your ignorance
again.
Warm anomaly
was not in
La Nina regions.
Remnants.
The UAH data from the “lower” troposphere is some 14,000 ft (4,500m?). It takes a few months for SST changes to propagate up there.
Even so, Roy Spencer and John Christy are surprised at the difference. See http://www.drroyspencer.com/2017/11/uah-global-temperature-update-for-october-2017-0-63-deg-c/ for more.
Being real scientists they are intrigued by the things that happen and leave us scratching our heads. That is where we learn from.
ric – the LT number is an integral
over the entire lower troposphere.
see the weighting functions
originally derived
by Christy & Spencer.
crachers by name, crackers by nature….probably a lot of people have written that…I don’t know why you bother dude? Your true calling is lying to little children…that’s the socialist way. They believe any old crap. This is the adults site where people think before they speak, and are free to say what they believe, this is something you will need to work on if you want to be accepted as an equal amongst adults…I know that this is not the socialist way…its just our way.
We all think you are an idiot. A man amongst children, but a child amongst men.
Bill Snape
After you have finished frothing at the mouth and acting like a child bully, maybe you could address where crackers345 is wrong? I think you will find there is a lot of head scratching from both sides of the argument as to why the satellite data is not declining (lie it did after the 1998 event). Maybe you have a theory, or perhaps you just prefer being a thug?
bill has no
reply, but he’s
a very good
name
caller.
why is that Cracky?
UAH measures LT temp… 1-5 km atmosphere.
ENSO 3.4 is a measure in tropical salt water.
Do you think those two very different bodies are physically connected in a fast response?
If you do, then your screenname is appropriate.
We don’t live in the troposphere.
By the way, why do you waste your time trying to be the first commenter? Do you have a life?
It looks like he is posting from a cellphone.
I find that the “first replies” are generally poorly thought out and not worth dwelling on. Then other people tack on to them to get their comments high up. I preferred the unthreaded style, despite its limitations.
Hugs, radiative gas theory (as reflected in the IPCC climate models) demands that the troposphere drive surface temperatures.
The lack of a tropical tropospheric “hot spot” fundamentally belies the CO2-centric climate models. It is so bad that IPCC AR5 arbitrarily reduced model-projected warming that the models otherwise get from their reliance on a high TCR/ECS.
Weather happens.
In maritime transportation – ship happens!
See –
http://www.cargolaw.com/
Countryman & McDaniel. I have no connection, but enjoy their accident photos and commentary.
And have used the snaps when trying to raise awareness of easily accidents happen.
Not least in enclosed spaces.
Which do, reliably, kill.
Note the tagged site now appears to require subscription for up-to-date news.
Auto
There is several months lag between cold SSTs and the satellite responding to such conditions, so do not expect to see a response before January, maybe February.
Further, the satellite is a lot less sensitive to La Nina conditions than it is to El Nino. This is possibly due to convection. In warm El Nino conditions there is more convection bringing with it warmer air to the altitude at which the satellite makes its measurements.
With cold SSTs there is reduced convection to high altitude and thus a more muted response.
Temperatures over short time scales are not of particular interest, let us wait and see what happens.
Crackers makes a silly uninformed comment. Land temperatures lag El Niño conditions. Therefor after an El Niño dissipates, it is usually still warm on land when La Niña conditions appear.
Faced with a warm September but a not quite record October, the Environment Canada rep interviewed by the CBC slipped in the stat that September and October were together a record. Clever sleight of lip. It gave the impression that both were records. Neat hey? Anything to make sure everything we hear is ‘on message’.
Australian BoM outlook …
http://www.bom.gov.au/climate/enso/#tabs=Overview
While the El Niño–Southern Oscillation (ENSO) remains neutral, the Bureau’s ENSO Outlook is currently at La Niña WATCH. La Niña WATCH means there is approximately a 50% chance of La Niña forming in late 2017. Climate models note that if La Niña does occur, it is likely to be short lived and weak, and effects upon Australian climate less than during the last La Niña in 2010–12.
Tropical Pacific sea surface temperatures (SSTs) have cooled since late winter. However, recent cooling has stalled slightly due to a pulse of tropical activity (known as the Madden-Julian Oscillation). Cooling is expected to resume in the coming fortnight. Atmospheric indicators of ENSO, such as the Southern Oscillation Index (SOI) and cloudiness near the Date Line have shown signs of shifting into a La Niña-like state.
All international climate models suggest further cooling of the tropical Pacific is likely, with most models reaching La Niña thresholds in late 2017. Six of eight models suggest that these levels will persist long enough to be considered an event. If La Niña does develop, it is likely to be weak and short-lived.
La Niña events typically bring above average rainfall to eastern Australia during late spring and summer. However, current temperature patterns in the Indian Ocean would typically push Australia’s climate into a drier phase. Hence current climate outlooks do not favour typical La Niña rainfall patterns across Australia for November to January. Weak La Niña events can also increase the chance of prolonged heatwaves for southeast Australia.
It’s comforting to know that the Oz BOM has so many climate models to choose from and therefore always be correct.
It also has several temperature datasets which makes the picking and choosing even easier. and if there is no match, there is always the option of adjusting temps.
Oh, boy, it is so easy to be a climate scientist.
The BOM has been so wrong about so much recently.
I almost feel like betting that it’s right this time!
The Bom ENSO outlooks are fairly amusing. Look through their archives to 14 February 2017 …
http://www.bom.gov.au/climate/enso/wrap-up/archive/20170214.archive.shtml#tabs=Outlooks
Climate models surveyed by the Bureau indicate that ENSO-neutral conditions are most likely for the remainder of the southern hemisphere summer and into autumn. However, all models indicate the central Pacific is likely to warm over the coming months, with some reaching El Niño thresholds in winter. This suggests ENSO-neutral or El Niño are the most likely scenarios for the second half of 2017.
Then look at the most recent outlook from 8 November 2017 …
http://www.bom.gov.au/climate/enso/wrap-up/archive/20171108.archive.shtml#tabs=Outlooks
International climate models surveyed by the Bureau indicate that further cooling of equatorial Pacific Ocean sea surface temperatures is expected during spring and summer. All of the eight models anticipate that SSTs will reach or surpass La Niña thresholds by January, with most reaching the threshold during November.
Apart from every single model and outlook being completely wrong, they were spot on.
I agree with BoM on this. No La Niña conditions yet. Last week Niño 3.4 temperature anomaly was -0.37°C. Not cold enough for La Niña yet, as the temperature has to be below -0.5°C for at least 5 months, and that is only one of the conditions.
Only 4 months ago Niño 3.4 anomaly was +0.5°C and they were talking about El Niño conditions.
http://www.bom.gov.au/climate/enso/monitoring/nino3_4.png
I think they are just ignoring their own rules and jumping the gun, declaring a La Niña just because their models say so. When the models turn out to be wrong, they’ll just declare a weak short La Niña instead of ENSO neutral conditions, that are what best describes the present situation where temperatures are oscillating between +0.5 and -0.5°C.
Let’s not forget what models predictions are worth. This was February 2017 forecast with what happened later:

Javier
That last chart is hilarious! Wow! Talk about a useless set of model runs. Any tuning going on over there? Any lessons being incorporated? What is set of runs being shown currently?
Crispin, ENSO models are a good example of climate models limited ability to predict future climate. ECMWF ENSO model is actually well considered. However, it has failed spectacularly already twice, when it predicted a strong El Niño in 2014, and again in 2017. The main problem is that ENSO has proven to be unpredictable so far.
The web page for ECMWF ENSO plumes is here:
https://www.ecmwf.int/en/forecasts/charts/catalogue/seasonal_system5_public_nino_plumes?time=2017110100,0,2017110100&nino_area=NINO3-4
You can select month and region.
Javier, ENSOs aren’t
“climate,” they are
natural fluctuations
that appear underneath
climate change.
over a long-enough
interval (~several decades)
they average to zero — or,
at least, used to, before
agw
A commonly held belief unsupported by evidence. Those that study past ENSO activity, report great variability over time in the decadal, centennial, and millennial time frames.
Thats a very odd statement from BOM. On their own side there is a equatorial cross section with a very huge amount of much colder than normal water below the surface. From 11.09 :
http://www.bom.gov.au/cgi-bin/wrap_fwo.pl?IDYOC002.gif
Therefore, it would be far better, BOM would reckon with a stronger La Nina.
CFS V 2:
http://www.cpc.ncep.noaa.gov/products/CFSv2/imagesInd3/nino34Mon.gif
The picture from BOM:
http://www.bom.gov.au/fwo/IDYOC002.gif?1510266074
Images have to end with an image extension, see the test page (link at top).
http://www.bom.gov.au/fwo/IDYOC002.gif
I was thinking about writing a post on this. Unless the rules have changed, the title is bogus. La Niña is La Niña conditions for a long time. The text refers to La Niña conditions.
I wrote on Facebook in a non-climate group:
Here’s a more precise definition from https://www.ncdc.noaa.gov/teleconnections/enso/enso-tech.php
That was my first reaction. We could be in a La Nina right now but it won’t be official until enough time has passed. If the 3.4 SST warms up then we are not now in La Nina. If the 3.4 SST stays cool then we are now in La Nina.
The article seems to make a case that La Nina conditions will persist for long enough to mean that we are now in La Nina. It’s a forecast.
Quite. I agree. When I read the headline, this was my initial reaction and I was going to make a comment to that effect, but you have covered the position very well.
We do not yet have a full blown La Nina. We will have to wait and see whether it actually materialises.
I think that the warmists are desperate to have a full blown La Nina since the 2016 peak has fallen away quite significantly.
BTW, our ENSO meter over on the right hand nav bar uses data from Australia’s BoM, their data was fetching more reliably than NCEP’s. I update it automatically on Monday morning. Data at http://www.bom.gov.au/climate/enso/nino_3.4.txt, e.g. October data:
BOM also has a bigger temperature anomaly threshold than NOAA for El Nino/La Nina conditions. I believe it’s +/- 0.8 for a “sustained period” (not sure if this period has a defined length – can’t find a reference).
Does this mean the climate ‘pause’ the last 18-19 years will continue? If temperatures at some point don’t match all those models from the last 15-20 years, then at what point do we have to have a reassessment about the very premise at the heart of CAGW? People here on this planet will not stand for this forever.
Real temperatures are already well below the models.
Only the very peak of the El Nino came close (UAH in red)
I bit of cooling will make them look even more ridiculous.

Wake me up when the chart(s) extend(s) back through a reasonable historic time scale, with every appropriate caveat about the “inferred” temperature accuracy. And if the chart wiggles and lurches ONLY since 1900 … Then I might PANIC and voluntarily surrender my Natural Born FREEDOM and hard-earned $$$ to “save the planet”. Until then, I will consider all of this just a masturbatory diversion from solving REAL WORLD problems.
in what data do u
see a 19-yr pause?
cite for graph?
@ur momisugly crackers345
Here is my take on the UAH data set.
There are actually TWO zero trend periods in the UAH and RSS satellite temperature data., separated by the 1998 El Nino.
1980 – 1997

and 2001 – 2015.5

cherry picking at
its finest.
No crackhead
Understanding
of climate
systems
Do you DENY that
There was
an El Nino from
1998 -2001?
Do you DENY that a
n El Nino started
mid 2015?
Why display
your IGNORANCE
so BLATANTLY.
let’s resume crackers in 3 post
crackers: I don’t believe that any pause happened, try to show it to me
andy: np, here are 2 of them
crackers: cherry-pick! you don’t have the right to do that. I still don’t believe that any pause happened
In a math classroom that would
crackers: I don’t believe that x²=1 has any solution, try to show it to me
andy: np, here are 2 of them: +1 and -1
crackers: cherry-pick! you don’t have the right to do that. I still don’t believe that x²=1 has any solution
everyone else: [facepalm]
There is no cherry picking. It is simply looking at all the data from the satellite data set removing the natural ENSO warming so as to see whether there is any signal to non natural event such as CO2.
crackers345,
The graph is mine. The data is from KNMI explorer. AndyG55 pasted a UAH graph from a different baseline period in red. I’ll update it in January, although since July temperatures haven’t really gone down. This might change during the winter and spring, specially if a La Niña finally shows up.
Speaking of UAH data:
No, “the pause” is not coming back any time soon. A weak La Nina will pull UAH temps down to more “average” levels. A return to “the pause” at the previous level requires temps to be so low for two years as to be implausible.
There is a very interesting conjecture that strong El Nino events cause a step change in the global temperature. If this is so, we may see a new pause at a higher level, but it will take 10 years to find out.
But the temperatures will quite likely drop down to the level of the pause before the El Nino.
Calculated linear trends are badly affected by transient and step type events,
… without really showing what is really going on.
tony, ensos are natural variations.
over a long enough time period they
average to near zero. that’s why
scientists look at 30+ year trends
for the AGW signal.
this will likely be the warmest la nina on record
just as 2015-6 was the
warmest el nino
on record.
these enso years keep
getting warmer.
why?
30 years is NOT a long period of time
It is the time of HALF the AMO oscillation.
It is a piddlingly small time.
2 El Ninos in 38 years of satellite data
2 big, totally natural El Ninos in a row.. WHOOPY-DOO !!
You seem to be a mathematical imbecile, crackpot !
Take your crackpot blinkers off and look at the strong solar cycles of the last 70 years,
and the ocean cycles of the AMO and PDO.
If you don’t comprehend these basic climate drivers,
you really should go back to primary school at not skip so much class this time.
“they
average to near zero.”
Yes, it looks
like once the
2015 El Nino
subsides com-
pletely, the temp-
erature will drop
back down
to where it
was
before the
El Nino.
When temps return to where they were in ’02 when the temp stopped rising, then the pause will be back. It will take significant cooling below the level of the pause for trend lines to read zero. (at which point the pause will have been long gone, being replaced by what we call cooling)…
What evidence do you have to make that claim?
I know it is often “claimed” by the professionally-funded CAGW apologist/alarmist community, but I have never seen any evidence that your claim is true.
The step change is pretty obvious.

kenji – why is the planet warming?
Natural forces that we do not yet fully understand. Yet there is no $$ in pursuing natural causes of temperature deviations, so no one is looking. The $$ is in creeping Marxist takeover Western capitalist societies under the guise of “saving the planet” from something we do not know exists.
In the meantime, here comes El Nino, La Nina, the Polar Vortex, ad retchinum. All I know is HOW DAMN MUCH $$$$ Jerry Brown, the CAPUC, and PG&E make me PAY (in the name of “greenness”) to heat my house and drive my automobile. And it appears as though its getting COLdDdER
http://vortex.plymouth.edu/uschill.gif
crackpot, why did the climate cool to the COLDEST period in 10,000 years.?
Be very thankful there has been some slight and totally beneficial warming.
and be VERY thankful for the fossil fuels that allow people like you to live in your inner city ghettos,
safely tucked away from any actual REALITY.
Thanks for coming on Crackers. We need the likes of you here. Your faith in the official numbers, your alarm over a 1˚C variation in the ‘observed’ Global temperature over 40 years…are you sure now that the ‘observed’ warming isn’t bolstered by say Greenland being at minus 17˚C when it would normally be at minus 20˚C?
Because if you understood basic physics you would understand that the warming of Polar regions in winter…well that would actually be an example of Global Cooling…because there’s not much in the way of radiative transfer going on up there in winter is there? And all that Ice Mass Gain in Greenland…how do you ‘feel’ about that? Cognitive dissonance right?
But as I said thanks for coming on, you’re always welcome, as a poster child for your cult you make a good practice target!
Charles – what is the area of
greenland,
compared to the
globe?
Crackers You crack me up .Do you want all the Ice in Greenland where you live .According to the IPPC the Ice was supposed to have but all melted by now .It looks like the northern hemisphere is going to have a cold winter and its starting early .Twenty years ago we were being told that snow falls in many areas of the world would stop and your children would never see snowfalls in areas where they only got a few weeks of snow a year..
Wake up the Vikings farmed in Greenland in the Medieval warm period a thousand years ago and with all this warming you are raving about because you were told that 97% of scientists said it was real and dangerous they still cannot farm there .
You might just learn something if you take your time and actually read these articles posted on WUWT.
The satellite and weather balloon record since 1979 shows little warming and the surface record has been deliberately altered .
How do you explain that the two longest running temperature records in the world from 1880 till present show NIL ,NONE ,NOT ANY . warming and they show that the 1930s and 1940s were actually warmer than at present .
No man made warming signal has been identified and the climate is driven by many things but CO2 is
a very very minor factor which has been blown up out of all proportion .
If you believe that CO2 controls the climate you would have to believe in magic .
PLANET IS
Greenland Ice Area is actually pretty much at its MAXIMUM in 8000 years

And any changes in Total Ice Mass since 1900 are basically immeasurable.

Certainly the gravity based GRACE data is nonsense because of the huge moving magma sack underneath.
Greenland is where much of the world’s ice is Cracker…or are you ‘denying’ that?
The two ice sheets on Earth today cover most of Greenland and Antarctica. During the last ice age, ice sheets also covered much of North America and Scandinavia. Together, the Antarctic and Greenland ice sheets contain more than 99 percent of the freshwater ice on Earth.
Quick Facts on Ice Sheets | National Snow and Ice Data Center
https://nsidc.org/cryosphere/quickfacts/icesheets.html
Charles, Glad you mentioned Antarctica.
No warming in the satellite data (ie usually unaffected by EL Nino events)

Total Ice Mass changes since 1900 are HORRENDOUS !!

The whole planet isn’t warming.
We don’t know if the planet is warming. It has warmed a little bit since 1950 and a little bt more since 1850. It is questionable if it is as warm as it has been during this interglacial. It is now probably cooler than during the peak of the previous interglacial, but advocates are working hard to get a lower estimate for the Eemian peak 100ka ago.
hugs – of course
we know the planet
is warming – ice is
melting, and sea level
is rising. these are macro
indications of a warmer
planet.
kenji, dude — a snapshot
of us-only temps says
absolutely nothing
about climate change.
or weather
change.
capisce?
charles GN: yes,
i deny that. most of the
world’s ice is in
antarctica.
crackpot. sea
ice is above
90-95% of extent of
last 10,00 years
warming only
from El Nino
No human signa-
ture in real data
Aligned 1980 as close as I could with HadCrud.
UAH will cool some over the next couple of years, making the CMIP look like a CHIMP.!
I’m reckoning by 2020 UAH will be somewhere around the 0 to +0.2 anomaly level.
The first trend is not zero, the second trend is negative but warmer than the first.

Trends for UAH 6.0
1980 to 1997 is +0.8C / Century.
2001 to 2015.5 is -1.2C / Century
1980 to 2015.5 is +1.1C / Century
Only one of these is statistically significant.
You have fallen into a basic mathematical trap when putting linear trends through cyclic data
The trend is PURELY an artifact of the way the cycles happen to occur.
Basic clue is that if you don’t know what you are doing… don’t do it.
What is the calculated linear trend of each of these graphs.?


AndyG55,
Enlighten me then. If the UAH data is just cyclical data, how did you deduce that “There are actually TWO zero trend periods in the UAH and RSS satellite temperature data.”? Id the data cyclic or does it show a step change?
I’m not here to try to teach mathematical basics to a primary school child.
I don’t have the time or patience.
That’s a pity. I was really hoping you could explain what you meant about cyclical data. My first thought was that you were talking about the 60 year AMO cycle, but that doesn’t make sense because that would imply the entire era of satellite data was rising continously, whilst you claim that it “clearly” shows a discontinous jump in the middle of two flat trends.
Then I thought you might mean a shorter cycle, and were suggesting I was cherry picking trends by starting at a peak and finishing on a low point. Butthat doesn’t make sense as the short trend periods I used were exactly the ones you had pointed to to claim there were two periods of zero warming. Moreover, if you are claiming there’s a cycle which can mask the actual trends, it would make it possible that your choice of start and end dates could result in an apparent flat trend, whilst ignoring the constant rise in temperatures.
Sorry to have wasted your time.
Bellman commented – “Trends for UAH 6.0 ….2001 to 2015.5 is -1.2C / Century”
this is a very very obvious
cherry pick, and wrong even at
that. the actual number
is +0.8 C/century
Yes, I was trying to make a point about AndyG55’s cherry-picking when he claimed there were two zero trends,
https://wattsupwiththat.com/2017/11/11/noaa-la-nina-is-officially-back/comment-page-1/#comment-2663341
But I’ve just noticed I had a typo, the 2001 – 2015.5 trend should be -0.12 C / century, not -1.2 C.
It is “La Nina conditions.”
It is not officially a La Nina yet. By definition: by historical standards, to be classified as a full-fledged El Niño or La Niña episode, these thresholds must be exceeded for a period of at least 5 consecutive overlapping 3 month seasons
So…
Sep-Oct-Nov (current)
Oct-Nov-Dec
Nov-Dec-Jan
Dec–Jan-Feb
Jan-Feb-Mar.
That probably won’t happen until Mach 2018.
Mach 2018 is pretty fast!
R matey.
Can you spell that without any R’s?
T-H-A-T.
The way I heard that riddle was via this spoken jingo:
Railroad crossing,
Watch out for the cars.
Can you spell that,
Without any R’s!
T-H-A-T
“Stepping through our flowchart, the sea surface temperature in the Niño3.4 region again averaged about 0.5°C cooler than average (check).:
But area averages of temperture dont make sense I thought?
And .5C? do we really have enough accuracy and measurements in the huge area to say its different by .5C?
Clearly La Nina does not exist
Yeah, ‘”temperature” don’t make sense’ to me either!
Why did autocorrect work for me, but not Mosher?
It’s a function of your browser, not HTTP or HTML.
The real data crime that interpolation does is averaging across large latitudinal bands.
The extreme example would be to interpolate from +90N to -90S. The equator would be well below freezing in that infill.
The surface data set is infilled junk, i.e. personal WAGs.
Mosh. Getting a little desperate now, right?
Thanks for letting us know. By the way…
how are you feeling about President Trump?
Steven Mosher: Taking your opponent’s premises and proving that their conclusion STILL does not follow is a time-honoured and powerful argumentative technique.
People think that the change In temperature in this part of the ocean is the most important thing in the world but I think this is more important because this does affect me.
http://www.natice.noaa.gov/pub/ims/ims_gif/DATA/cursnow_asiaeurope.gif
http://ocean.dmi.dk/arctic/meant80n.uk.php
http://ocean.dmi.dk/arctic/icedrift_anim/index.uk.php
The latest ONI Index available is ASO 2017 at -0.4 and so has not reached the La Nina thresh hold of -0.5 . How can NOAA say “La Niña is officially back” ?
and i thought ONI had to be <= 0.5
for 5 months to call and ENSO. what
happened to that?
They change their own rules whenever they want. For some reason they want a La Niña even if the conditions they used to define it have not happened yet.
Past weak Niño 3.4 temperatures were at -0.37°C, and 4 months ago they were at +0.5°C. Clearly not a La Niña yet.
Hmm, last week Niño 3.4 temperatures were at -0.37°C. A comment editor would be nice.
Javier
I owe you some thanks for what you said almost a year ago on something similar. I spent some time and I think the issues I had with my Nino region work have been fixed. For the three Nino regions that I furnished charts for the data that I use consists of monthly data from 1854 to 1990, weekly data from 1990 until 2014 and then daily data after 2014. The charts furnished are only for the daily data.
Nino Region 1.2
https://1drv.ms/i/s!AkPliAI0REKhgZYsVVhGVhdC8F4HZw
For all the data going back to 1854 the correlation coefficient is 0.855. For the portion shown in the graph which are the daily data the correlation coefficient is 0.87. Region 1.2 has the noisiest data of all the regions and has the lowest correlation coefficients.
Nino Region 3.0
https://1drv.ms/i/s!AkPliAI0REKhgZYrsy2pmeUpgMrrSA
For the full range of data going back to 1854 the correlation coefficient is 0.928 and for the daily portion shown in the graph the correlation coefficient is 0.943.
Nino Region 3.4
https://1drv.ms/i/s!AkPliAI0REKhgZYq3NYjh8HtWJPj5w
For the full range of the data going back to 1854 the correlation coefficient is 0.925 and for the daily portion shown in the graph the correlation coefficient is 0.943.
Javier, I listened and I think things have vastly improved. I did some other things too. Thank you.
Charles,
I read your comment at Clive Best’s site and checked your graphs at your open drive. I don’t remember how I helped you, but I am glad I was of use to your work. I do remember seeing your work in the past and I am very much impressed how well it has behaved through the 2015-16 El Niño. I have downloaded some of your graphs and I am looking forward to see its future behavior.
Just so the rest of the people know what we are talking about, here are a couple of them:
The Niño 3.4 cyclical model with its prediction:

The HadCRUT4 cyclical model with its prediction:

According to it, 2018 should see temperatures similar to 2012. Looking forward to it.
Javier
Thanks for posting the two graphs that you did. Just in those two graphs you posted there are things worth observing when looking at both of them.
In the Hadcrut 4 graph it is worth making note of the two modest humps in 2017. I think that comes from the clear hump seen earlier in the year in the Nino region graph.
The Nino region is going to bottom out early into 2018. At the same time, the Hadcrut 4 bottoms out a bit later. Then early in 2019 the Nino region reveals a hump. The Hadcrut 4 data does the same just a bit later.
I did not post it but I also look at the satellite records. In general, projections based upon such limited data are worthless but when I analyzed ;the global RSS data it sort of resembled the Hadcrut 4 data. It had a hump in 2017. It bottomed out in 2018. Further, it had another hump in 2019 but the height of the hump was excessive. In fact, the appearance of the 2017 hump was falsely indicated in the measurements. that has not happened yet but it is looking for it.
I know some were having a hissy fit over the October UAH value. Wait another month; it may be resolved.
How can they say that? Because they’re climate.gov, which I think is a blog. Certainly not a government agency. I think they’re referring to the most recent ONI which may not have been published yet. I think I saw a reference to a week ending 11/11 data point.
See my comments above.
Note that the text of the article refers to “La Nina conditions,” only the title claims “La Nina is back.”
ONI Index is updated every month. The last available ONI Index is ASO 2017 at -0.4 published for end of October 2017. ONI is calculated every month end and at -0.4 even a “La Nina conditions” does not exist.
It is interesting to shift the stratospheric polar vortex towards Europe.
North America is exposed to the Arctic air.
http://www.cpc.ncep.noaa.gov/products/stratosphere/strat_a_f/gif_files/gfs_o3mr_05_nh_f00.png
Regarding the coming season: “ For now we see through a glass, darkly; … ”
Well, that’s me, anyway.
I can tell you what has happened.
Some passes over the Cascade Mountains in Washington State have been closed by the WADOT — something about early and too much snow. Early? Yes. Record early? No.
Parts of Seattle did have the 2nd earliest snow since Old Shep’s great great great Grandma was a pup. That’s 1892 in Shep years.
The Warmists are in full screaming denial now…they will studiously ignore every indicator that says their predictions have failed to materialise but hey….after thirty years of this BS…it’s like music to my ears!
@crackers345 November 11, 2017 at 9:27 pm
“tony, ensos are natural variations. over a long enough time period they average to near zero. that’s why scientists look at 30+ year trends for the AGW signal.”
Why then, do ‘climate scientists’ rant about the hottest year/month/decade/hour/second EVAH!
You can not have it both ways, its either annual records and the like, or climate, not both…
I think the reference was to the fact that whilst global temperatures do respond to ENSO variations they differ in that over time temperatures show a warming trend, whereas ENSO does not, being an oscillation.
The chart below plots ENSO temperatures published by NOAA since 1982 against UAH global TLT anomalies over the same period. There’s a strong, if lagged, response from UAH to ENSO fluctuations, but UAH contains a warming trend which ENSO lacks.
http://oi65.tinypic.com/5peykk.jpg
dwr ,that is a good chart to show the effect of a several warmer peaks in the region in the early part of the time series vs less in the later part. note the lower peaks in the period of the pause .
“There’s a strong, if lagged, response from UAH to ENSO fluctuations, but UAH contains a warming trend which ENSO lacks.”
I’ve noted this several times: the apparent warming is a recovery from the cooling impact of 2 major volcanoes – El Chichon 1982 and Pinatubo 1991+. Some “real” warming probably occurred after the Great Pacific Climate Shift circa 1977.
Sara
The problem is that the ice melt is mostly from the base of the glaciers. Very little from the top. So whatever falls on the top, be it snow or, sadly, human beings, is not going to melt out for a long time. It just gets entrained into the ‘top-growth – base-melt’ system of glacial ice flows.
Ectually, looking at earthnullschool. Net Greenland is minus 37
If we get a compensating la nina, will it be as long, and as large.
It is going to be fairly weak, anything in the +/- 1.0C range has minimal impacts.
This is the best predictor of where the ENSO is going to go. It is good for 2 months out and one can be a little brave and predict the red line out a few more months if you understand the drivers. I think it will starting heading back toward neutral after the Nino 3.4 gets to the -1.0C value around December.

Data here:
http://www.cpc.ncep.noaa.gov/data/indices/sstoi.indices
http://www.cpc.ncep.noaa.gov/data/indices/wksst8110.for
http://www.cpc.ncep.noaa.gov/products/analysis_monitoring/ocean/index/heat_content_index.txt
A weak/moderate La Nina brings more “excessively interesting” weather to New England than a strong one. I won’t dismiss it out-of-hand.
Very warm Octobers often lead to stormy winters for us. Joe Bastardi is almost beside himself, but yeah, it doesn’t take much to set him off. 🙂
If you look at the temperature anomalies off the coast of South America at today’s tropical tidbits, it’s like shivering:
I’ve rarely seen such a large-scale temperature anomaly in the La Nina nursery. Although Tropical tidbits should be a little too dynamic, this is a sign that the change is large-scale. The bigger patterns for EL Nino / La Nina have changed drastically.
NOAA shows the same pattern:

Can anyone explain to me why the anomaly off the NE coast of the U.S. has been so persistently high for years now? Seems to me that it would be a function of the directional change in the Gulf Stream as it heads towards Europe, but why would it dump so much of its latent heat content there? Does it have anything to do with the continental shelf?
Region 1 + 2 is small, but very important. It shows the temperature of the Peruvian Current, which supplies water from the Antarctic to the equator. Observation of this region allows to predict the development of La Niña.
Crackers aside, does the repeat of a La Nina from last winter mean we’ll have the same winter weather as last winter? It should, if Ma Nature follows her own rules. Well, she always does, and we get the results.
in my kingdom, it should mean a cold, nasty December, with average snow and then – for no reason known to Man or Mann – reverse the cold/snow/bleah and go with a damp, gray, chilly winter kind of like what used to happen in England. Well, that’s fine with me. I don’t mind a hike to the bank (1.75 mile one way) or a quick trip to the bus stop to get to the grocery store, but I detest having to dress like a lumberjack all the time, just because it’s winter and I’m outside shoveling and grumbling.
As long as the birds know where to find my feeding station, it’s fine.I have some great stuff from winters past: red-bellied female woodpecker and blue jays coming for the peanuts I put out for them, squirrels galore (red, black, and gray) with that guilt-ridden startled look, and bazillions of sparrows, including some rare for my area. I’ll stock up on bird food, and make the little feather flockers happy.
Last winter’s “La Nina” can not be compared with the upcoming one, as it will be stronger. The “La Nina” last winter was indeed only by a change in the scale by NOAA a “La Nina”. I would describe the condition as neutral in winter 2016/17. So the effects on the weather in regions influenced by ENSO are different in 2016/2017 and 2017/2018.
Thanks. I’m also looking at the water vapor (GOES images) and which direction the wind is blowing, and it’s starting to blow southeast across the North Pole from Siberia. I stocked the pantry pretty well this time, but I’ll add even more next time.
Thank you see what happens.
Wait, WHAT?
So my stock in the Peruvian fishing industry is going to go up? Cool. More money for me! HA! Take that suckers! *tongue in cheek*
Where is the ocean circulation in this paper? DID I MISS IT??? Oh wait, it was ignored AGAIN…so freaking typical.
When are these people going to realize that the OCEAN is IMPORTANT TOO??!!!
Jenn Runion November 12, 2017 at 8:04 am writes: “… in this paper. …”
Jenn,
Maybe you missed it but the post starts with this information:
Author: Emily Becker
Emily writes a monthly post at NOAA Climate dot Gov and the name (highlighted) is a link to those postings.
You should not “freak out” until you have read about a year’s worth and begin to understand what this is and what it is not.
There are data and maps at the .gov site and these posts — Emily says “Be sure to check out Mike’s** recent post ” — are meant to monthly help “promote public understanding.” They are not meant to provide a full blown report of everything regarding our dynamic Earth.
**Author: Mike Halpert . . . . 3rd line up at the end of Emily’s post.
I bought 3 cords of wood this year. And am praying it will be enough. Just sayin.
Pamela,
If you run short, get in touch. In my pasture, there are 35,000 pounds of wildfire killed Ponderosa still needing cut into rounds, and split. Likely you can find some a bit closer to you though.
Stay warm.
Blew through that last HTML tag. Good morning World. I’ll go feed the animals and come back awake.
The 12 November 2017 Sun 1500 UTC Composite Water Vapor Satellite Imagery for full Earth is an amazing sight.
North America here: http://www.weather.gov/satellite?image=wv#wv
While the planet is in a ~ 350 year warming trend with no end in sight, for the past 21 months the planet has been cooling, since the big El Niño of 2014-16 ended. This is to be expected, and in fact the cooling has been slower and lesser than after prior big Niños. The interest in declaring a La Niña is because the cooling might continue for one or more years and there is a need to explain it within the global warming narrative.
The same as skeptics argued that the warming was due to El Niño, believers are going to argue that the cooling is due to La Niña. Both positions are thus resistant to any change in temperatures that might be observed. In my opinion we will have to wait until around 2020 to see how global average surface temperatures emerge from these ENSO episodes and the general trend can be better assessed. If by any chance a strong volcanic eruption takes place, any possibility that a decrease in temperatures might reinforce the skeptic position will disappear.
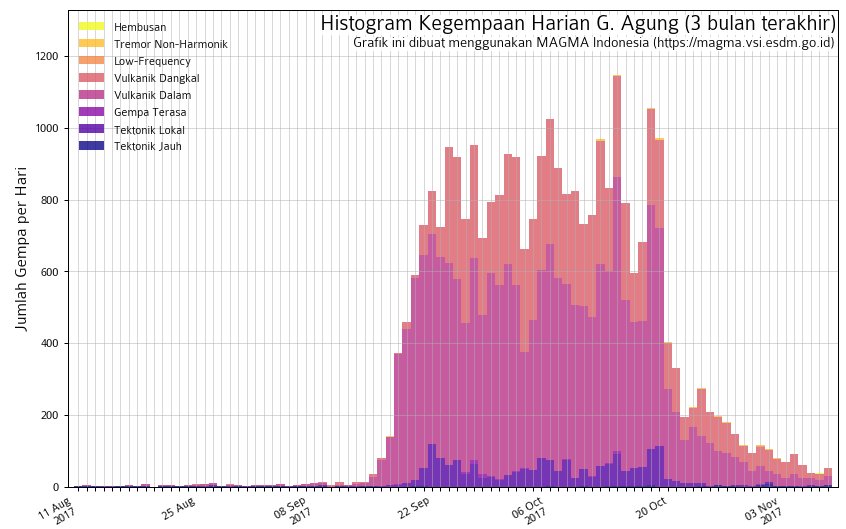
Luckily for Bali residents, and also for skeptics, Mount Agung has been decreasing its seismic activity and so the danger of a volcanic eruption there appears to decrease.
I agree Javier, it would be bad to have some natural external cooling event like a volcano be given the credit for any cooling. Even if a volcanic event happened well into an established La Nina the alarmist narrative would likely dismiss the cooling as all natural. Especially not ever a really big volcano that causes such extreme cooling that we have a ‘year without a summer’ like in 1816 after Tambora erupted a year earlier. Let’s hope that any chaos happens in a super El Nino period and the damages are minimal.
Regardless of what rational they use, with a la nina and the return of the pause the models will have been deemed a complete failure by those who created them. There is zero chance of a twenty year pause in warming in the models and only a 2% chance of a fifteen year hiatus. By then we shall all be singing, along with the ipcc itself, “ding dong the witch is dead”…
Afonzarelli, your confidence is moving, but if the hypothesis can explain the 1950-75 cooling, it can explain anything, I’m afraid. Even a glaciation return would be triggered by global warming.
Javier, the “crux” of the matter at this point is warming. Not only from the scientific view point (the 2C of warming), but the PR view point as well. It would be a mighty stretch to think that a theory that sold us on warming would then do an about face and sell us on cooling. At that point, if we do see cooling, large swaths of the scientific and political establishment will most certainly jump ship. (kind of like Dr. Curry, only on steroids) As well, AGW will be widely regarded as the most massive false paradigm in history since the days of the flat earth…
afonz – co2 is a
greenhouse gas.
this has always been
so and will always be so.
it will never be disproven,
any more than heat seeking
missiles will
suddenly be attracted
to icebergs and not
airplanes.
’cause physics.
javier – “Afonzarelli, your confidence is moving, but if the hypothesis can explain the 1950-75 cooling,”
no one cites ghgs for that very
small amount of cooling.
it was most likely
aerosols after post-ww2
industrialization and
autos and before the
era of clean air
regs. even maybe
some nuclear
testing.
crackers345 November 13, 2017 at 9:47 pm
Wrong again!
The post WWII cooling was far more dramatic than the slight warming from the PDO flip of 1977 until now.
And the post WWI, pre-WWII warming was indistinguishable from the late 20th century warming.
Instead MtAgung will then likly blow around 2020 at the bottom of the solar cycle as most volcanoes blow during solar maximums or solar minimums–that will be even worse than blowing now since it will cool for a few years and in 2024 is a malankovitch cycle while the northern hemisphere is in winter.. that will be some serious cooling on top of the volcanoes.. also David Dilley globalweathercycles: cold arctic pulses hit around 2020! no way will there be anything other than colder than shit throught the 2020’s.
Or in between.
Mt St Helens and Pinatabo are exactly 11 years apart at the top of solar cycles, in around 2010 at the previous bottom were more volcano’s including a 5 VEI5 level. That’s why I predict that more will blow around 2020..
I griped at https://www.climate.gov/news-features/blogs/enso/november-2017-la-ni%C3%B1a-update-she%E2%80%99s-back about the La Nina claim. They included it and replied:
I know this is somewhat off topic, although it was mentioned above by someone else (Crackers, in fact).
In regard to Greenland’s ice sheet depths, Fox News reports that Fallen American Veterans Foundation is attempting to recover the remains of US servicemen who went missing in Greenland during World War II, in 1942 when the amphibious biplane that carried them crashed. The problem with recovery is that they may be buried under 350 feet of Greenland’s ice and snow.
http://www.foxnews.com/us/2017/11/08/leave-no-man-behind-expert-team-prepares-to-retrieve-remains-fallen-wwll-servicemen-from-up-to-350-feet-below-ice.html
Now, since that World War II date (1942) is 75 years ago, and the ice depth is expected to be as much as 350 feet, what is with this notion that the entire ice sheet may melt any time soon? Wouldn’t that have already happened by now? That’s an average annual added load of 4.66 feet of snow (about 1.414 meters), which becomes ice when compressed.
I’m as serious as cancer when I ask if reality EVER sinks in with any of those people?
Seriously Sara, then you should understand that ice forms continuously on top of the Greenland ice sheet, and then slowly moves sideways until reaching the coast where it becomes icebergs or melts at the sea. So while things on top the ice sheet sink in the ice, the ice sheet is becoming a little smaller most years because iceberg losses are bigger than surface mass gains.

https://www.dmi.dk/en/groenland/maalinger/greenland-ice-sheet-surface-mass-budget/
Ja, okay, javier, did you understand that the number 350 in the article refers to the depth of ice under which those remains may be buried? Seriously? And have you taken the 75 years between the 1942 crash and now into account, in your gains/losses phrase? Or that with ice sheet movement, the crash site may not even be where the plane was guesstimated to have crashed?
You do know, don’t you, that at some point far back in planet Earth’s history, Greenland was not only ice-free, but temperate and green with forests? Those have been found by paleontologists, just a few years ago.
I’m not sure what your point is, but that’s a nice drawing. However, Greenland is flatter than that.
Sara, from what I have read regarding the WW2 airplanes in the Greenland Ice, is that a large part of the 350 feet in the ice now is that airplanes rapidly sank through the top layers of snow before it became ice, and somewhat even lower into the ice layers itself, through heat conduction of the airplane itself. Only some of it, perhaps less than 20%-25% of the ice covering the planes now came from new snowfall in the last 46 years when they discovered the airplanes. I hope you don’t think that somehow 350 feet of new ice formed over them in 46 years from snowfall? That just don’t add up.
Let’s compare the strength of the polar vortex in 2015 (high magnetic activity of the Sun) and in 2017 in October and November. You can see that this year the polar vortex is weak.
http://www.cpc.ncep.noaa.gov/products/stratosphere/strat-trop/gif_files/time_pres_UGRD_MEAN_ALL_NH_2015.png
http://www.cpc.ncep.noaa.gov/products/stratosphere/strat-trop/gif_files/time_pres_UGRD_MEAN_ALL_NH_2017.png
The bottom polar vortex graphic is faulty and not comparable.
It is already correct.
The 2016 el Nino was a Modoki.
This La Nina is also a Modoki.
ie different.