November 2017 La Niña update: She’s back!
Author: Emily Becker
Well, it’s November, and the CPC/IRI ENSO forecast is declaring the presence of La Niña conditions! I could just link to my November 2016 post and head home for the day… but that would be no fun! There’s about a 65-75% chance that La Niña conditions will continue at least through the winter. As we head into our fifth “double dip” La Niña (an unofficial term for when neutral conditions briefly prevail in between La Niña winters) in the historical record, let’s dig into what we talk about when we talk about La Niña.

A quick flashback
If you recall, last month there were several signs of the presence of La Niña conditions. East-central tropical Pacific sea surface temperatures were cooler than the long-term average, accompanied by signs of a La Niña-like atmospheric response (more clouds and rain over Indonesia, less over the central Pacific).
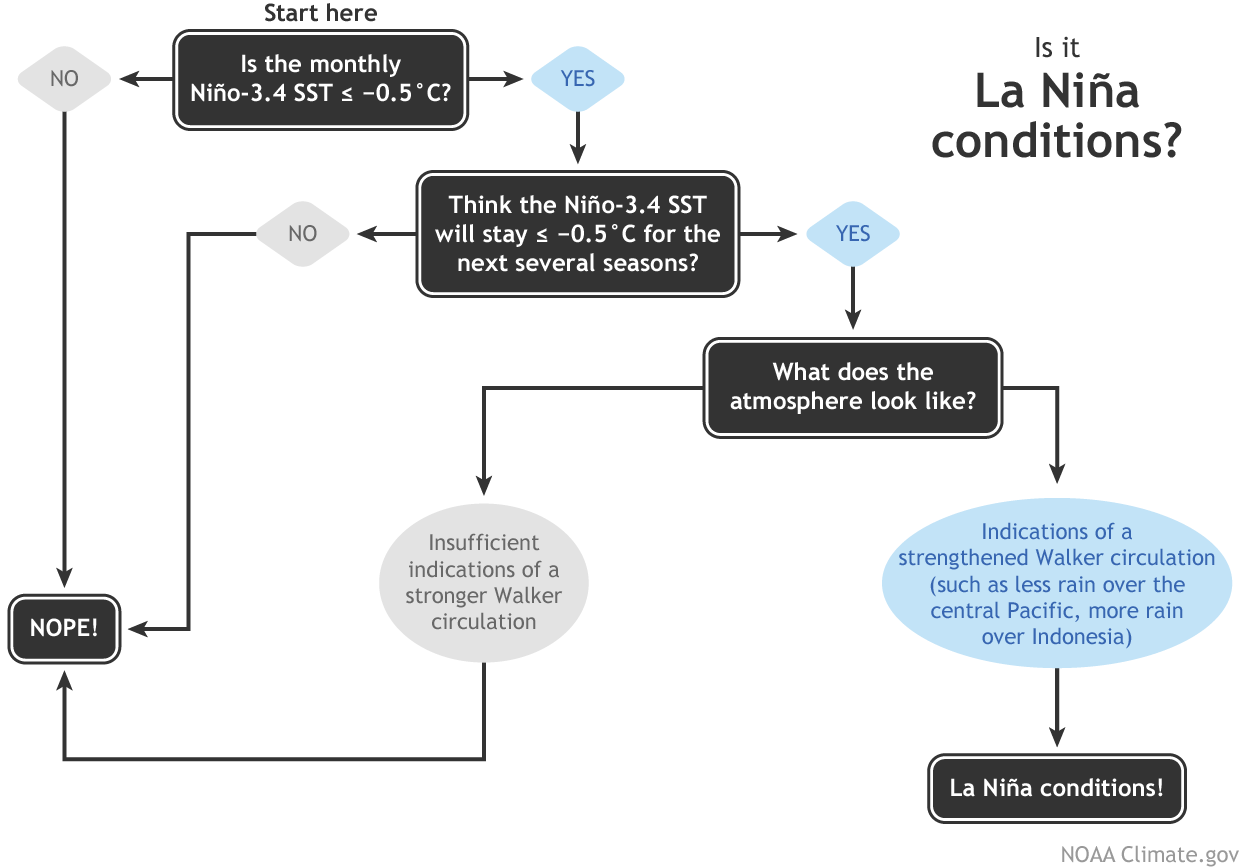
Sea surface temperatures in the Niño3.4 region during September came in at about 0.5°C cooler than the long-term average, the first step in our La Niña conditions decision tree. However, the sea surface temperature was showing some volatility, and we just weren’t confident enough in the second step of the flowchart—that the cooler sea surface would persist for several seasons—to be sure that La Niña’s seasonal pattern had locked in.

Flowchart showing decision process for determining La Niña conditions. Figure by Fiona Martin, adapted by Climate.gov.
What’s different this month?
In October, despite an active Madden-Julian Oscillation moving through the western Pacific (more on that in a minute), La Niña conditions dominated. Stepping through our flowchart, the sea surface temperature in the Niño3.4 region again averaged about 0.5°C cooler than average (check). Most of the computer models forecast that it will remain in weak La Niña territory (between 0.5°C and 1.0°C below average) through the spring (check).
Another factor bolstering forecasters’ confidence that La Niña will remain in place through the fall and winter 2017/18 is the substantial quantity of cooler-than-average waters below the tropical ocean surface. This will provide a source of cooler waters to the surface over the next few months.

Heat content in the upper few hundred meters of the tropical Pacific near the equator (5°N-5°S) from November 2016 (top of image) through October 2017 (bottom of image) compared to the 1981-2010 average. The western Pacific is on the left; the eastern Pacific is on the right. Each row of the image shows a 5-day average. Scan the image from top to bottom, and you can see the weakening and rebuilding of the La Niña cold pool in the central-eastern Pacific. (Still not quite sure what you’re looking at? Read more about Hovmoller diagrams.) NOAA Climate.gov image, based on data provided by the Climate Prediction Center.
Finally, the signs of an atmospheric response I described above continued to be present during October (check). In addition to the clouds and rain pattern, the upper-level winds were stronger than average, another sign of a strengthened Walker Circulation. Also, the Southern Oscillation Index was positive, also indicating a stronger-than-average Walker Circulation. Add it all together, and you get… La Niña!
You promised me an MJO!
Indeed I did. The Madden-Julian Oscillation operates on subseasonal timescales, meaning on the order of weeks or months. The MJO is essentially an area of enhanced convection, storms and clouds that moves eastward along the equator, and can circle the globe in around 4-8 weeks. ENSO (the whole El Niño/La Niña system), on the other hand, is a seasonal, stationary pattern, lasting for at least several months in a row.
The MJO can move through the tropical Pacific and temporarily change conditions, including the winds near the surface.

The surface and upper-atmosphere structure of the MJO for a period when the enhanced convective phase (thunderstorm cloud) is centered across the Indian Ocean and the suppressed convective phase is centered over the west-central Pacific Ocean. Horizontal arrows pointing left represent wind departures from average that are easterly, and arrows pointing right represent wind departures from average that are westerly. The entire system shifts eastward over time, eventually circling the globe and returning to its point of origin. Climate.gov drawing by Fiona Martin.
The near-surface winds in the tropics, called the trade winds, have a close relationship to the surface temperature of the ocean. The trades normally blow from east to west, helping to cool the surface and keep warmer water “piled up” toward Indonesia. If these winds relax, the surface waters in the central and eastern Pacific can warm up. This is a critical feedback mechanism for ENSO.
During La Niña, the trade winds are stronger than average, keeping the surface waters cooler (vice versa during El Niño). If the MJO is active, it can temporarily change the wind patterns. This past month, the MJO was active and moved through from the Indian Ocean into the western hemisphere, weakening the surface winds. But despite the winds temporarily weakening due to the MJO, the ocean remained cool. This leads forecasters to believe that La Niña conditions are in place and we can now see the forest for the trees.
This winter’s La Niña, although expected to remain weak, is likely to have some effect on North American weather and climate this winter. Be sure to check out Mike’s recent post for details on NOAA’s 2017/18 Winter Outlook, and stay tuned to the ENSO Blog for further updates on the great La Niña of 2017/18.
For those harping on the 3-month NOAA definition for defining official ENSO conditions should know that the definition is entirely arbitrary. You don’t wait until the third day of having the flu to declare that you’re sick, you base that diagnosis on the current conditions. Right now we unequivocally have La NIna conditions, whether it will be strong enough to be declared “official” remains to be seen, but NOAA’s official declarations mean little to nature.
It’s also important to remember that it’s based on an anomaly, an anomaly compared to a baseline defined from revisioned-adjusted-molested data.
Economists do wait a similar amount of time before declaring we’re in a recession.
I wouldn’t say “Right now we unequivocally have La NIna conditions,” the Australian BoM hasn’t reported it (they might tomorrow), and I’ve only read word-of-mouth reports from climate.gov which didn’t report their source!
(Ric, economists have their heads up their you know whutts… ☺)
Ric,
I am a meteorologist and have been using ENSO as a forecasting tool for many years. We are in a La Nina and what ever criteria you want to look at, it is in La Nina mode and has been since last NH spring. The fact that the rather restrictive and lagged NOAA criteria for the Nino 3.4 region has not sustained official Nina SST level criteria is irrelevant if the atmosphere is merrily behaving as though a La Nina is occurring…which is most certainly is.
Remember it has only been relatively recent that observers have started naming different versions of El Nino
(e.g. Modoki). So why should La Nina’s be any different?
afonzarelli
“(Ric, economists have their heads up their you know whutts… ☺)”
my bet – you have never
published a single paper in
econ, never will, and cannot
meaningful critique any research
from a prof economist
am i wrong?
you’re a legend in your
own mind.
From: John Christy
Date: November 4, 2017 at 7:28:22 PM GMT+7
To: Allan MacRae
Cc: Anthony Watts, Roy Spencer, John Christy, Joe D’Aleo, Joe Bastardi
Subject: Re: Sorted – atmospheric cooling will resume soon
Allan
Yes. We’ve seen this correlation since our first paper about it in Nature back in 1994. The Pacific gave up a lot of heat between July and October – and some of it is making its way through the atmosphere. We think the anomalies will drop soon too.
John C.
Sent from my iPhone
On Nov 4, 2017, at 6:03 AM, Allan MacRae wrote:
FYI friends.
I was curious why the UAH LT was diverging above its predicted value based on the East Equatorial Upper Ocean Temperature Anomaly – I re-plotted the data vs UAH LT Tropics (instead of UAH LT Global) and the situation became more clear- atmospheric cooling will resume soon, imo.
Best, Allan
https://wattsupwiththat.com/2017/11/02/while-global-surface-temperature-cools-the-lower-troposphere-has-record-warmest-october/comment-page-1/#comment-2654147
Sorted – atmospheric cooling will resume soon. See the plot below of the UAH LT TROPICAL Anomaly vs the East Equatorial Upper Ocean Temperature Anomaly and the situation becomes more clear.
This is a typical pattern after major El Nino’s, in which atmospheric (LT) temperature diverges above the level predicted by the long term relationship with the East Equatorial Upper Ocean Temperature Anomaly. The pattern will converge again soon, and atmospheric cooling will resume. WHY this happens after major El Nino’s is still to be explained. Perhaps the El Nino heat in the atmosphere just needs time to dissipate.
https://www.facebook.com/photo.php?fbid=1483830358361188&set=a.1012901982120697.1073741826.100002027142240&type=3&theater
My further analysis suggests the UAH LT temperature anomaly will cool to about 0.0C within about 6 months.
WOW, Allan, you reckon that far, that quickly.
That’ll make things interesting, especially if it continues to drop after that.
I was thinking we would probably see the 2019 yearly anomaly being around zero
Won’t that make a mess of the models! lol !!!

Hi Andy
The above plot has a six-month offset between the UAH LT Tropical Anomaly vs the East Equatorial Upper Ocean Temperature Anomaly. It is a close relationship most of the time. After 6 months I have no prediction.
Best, Allan
Correction:
I have no prediction based on the above correlation.
I published in 2002 that global cooling would resume by ~2020-2030, based on low solar activity. This would be similar or cooler than the global cooling that occurred from ~1940-1975.
I am now leaning towards cooling starting circa ~2020 or earlier. Hope to be wrong.
Regards, Allan
Minor nit:
Plot shd read “leads UAH LT TROPICS by 5 months ( not 6)
This La Nina will grow slowly, but will attain a remarkable extent and intensity of cold at its end in a year or two’s time.
It may not actually be “officially” La Nina, but here in New Zealand we can testify that ‘La Nina conditions’ are already in play! After 16 months of below average sunshine hours and above average rainfall throughout the country, we now see anti-cyclones crossing the Tasman Sea at our latitude or lower! The tap has been turned off, the sun is shining at long last. unlike other parts of the globe, the Girl Child is welcome in our house because that is what she brings. Yes there will be the threat of drought this austral summer, but after the ‘non summer’ of last year we will put up with that possibility just to enjoy a ‘real summer!’
Our sunniest, and warmest summers come from La Nina. According to the best weather predictors in the land, MetVUW (Victoria University Wellington) we are in for a prolonged period of anti-cyclones crossing our country. Classic signs of La Nina.
https://www.metvuw.com/forecast/forecast.php?type=rain®ion=swp&noofdays=10
The debate here reminds me of the similar situation that arises with the onset of a drought. The drought isn’t declared until certain criteria have occurred. In the mean time drought conditions have already been occurring. I could make the call right now that a drought is under way in my area, and it may well come to pass, but that would be too presumptive of me at this early stage, even though droughts here are common with La Nina at this time of the year.
The Nino3.4 index little variance at time-scales longer than a decade. El Ninos and La Ninas will come and go, but the critical question is the truly secular, much longer-lived changes in surface temperatures. We’re looking mostly at the trees in the forest here.
El Ninos and La Ninas will come and go…
But surface temps remain the same. That is your forest (for the trees). Climate models do not allow for pauses in warming of over fifteen years regardless of the cause. If we do see pauses like this, then models have a poor understanding of natural variability and thus should be scrapped…
Indeed, that’s been the case in tropical Pacific waters. The Nino3.4 index is virtually trendless throughout its entire history.
afonzarelli commented-
“But surface temps remain the same.”
hardly
“Climate models do not allow for pauses in warming of over fifteen years regardless of the cause.”
wrong. ENSOs can cause +/- 0.2-0.3 of warming/cooling. That’s 1.5-2 decades of agw warming.
“If we do see pauses like this, then models have a poor understanding of natural variability and thus should be scrapped…”
climate models will never be
“scrapped,” because they are the
only game in town, just as
maxwell’s equations are the only
game in town for electromagnetic
phenomena. climate models are’
merely sets of equations that solve
a very difficult problem and are
solved numerically. do you have any
other way of solving physics
problems????????
no, you don’t
Actually “Los Niños” and “Las Niñas.” The plural affects also the article. Just adding a -s at the end is not enough.
Since these episodes, unlike children, come strictly one at a time, pedantically invoking Spanish grammar in English usage seems out of place.
Things are either correct or incorrect. You either use “El Niño” and “La Niña,” or you use “Los Niños” and “Las Niñas.” Saying “El Niños” is incorrect, whichever way you look at it.
If Spanish grammar is too difficult for you, you can always resort to say “El Niño” events to indicate more than one.
In English usage, we have “mea culpas,” not “mea culpae.” Pedants who find such accepted usage too difficult won’t get either from me.
Those who insist in making a mistake never learn.
The English Language is whatever the common man says it is. Beyond a few of the highly educated perfectionists, nobody cares about the grammar of a dead language: Latin. I know a smattering of Latin grammatical rules, but that is only because I like to read and I’m eclectic in my tastes.
I do know many of the grammatical rules of Spanish. And I still use El Ninos. People understand it, and probably don’t know nor care what ‘Los’ means.
Oh, Javier, just realized that ‘El Nino’ is a thing. Therefore one would say ‘Los El Ninos.’
Javier,
IMO, since we can speak of “an El Niño”, it’s OK to refer to a number of these events as “El Niños”.
The two-word term has become an English phrase referring to a recurrent weather event.
I’ve been speaking Spanish for 52 years now and my wife is a native Spanish-speaking South American.
Above the Kamchatka there is an area of elevated temperature which blocks the circulation in the stratospheric polar vortex.
http://pics.tinypic.pl/i/00946/tzxqtqlcgc5o.png
La Nia develops.
http://www.cpc.noaa.gov/products/analysis_monitoring/enso_update/sstweek_c.gif
Can anyone direct me to a paper or website that explains what if any interactions there is between ENSO and Pacific Decadal Oscillation and Atlantic Multi-decadal Oscillation. It looks like something else is at play besides ENSO when you look at past winters on the NOAA seasonal forecast.
I don’t know of a good resource, online or in print. It would be a good topic for a book.
Joe D’Aleo is one of the most knowledgeable people on the subject and his name makes a good search term. If you hear him talk, you will be lost in minutes. I used to be lost within 1 minute. 🙂
A couple links you can peruse. (I included NAO (North Atlantic Oscillation) because that has a big influence on New England winters, and sometimes midwest.) All the combinations quickly get out of control.
http://myweb.wwu.edu/dbunny/pdfs/aleo-easterbrook_ch5Relationship-multidecadal-global-temps-to-oceanic-oscillations.pdf
http://journals.ametsoc.org/doi/pdf/10.1175/JCLI-D-14-00521.1