From the way media and climate scientists portray the global air temperature this past year, you’d think there was only one place to go – up. For example, Gavin is holding on to hope:
With update thru September, ~80% chance of 2017 being 2nd warmest yr in the GISTEMP analysis (~20% for 3rd warmest). pic.twitter.com/k3CEM9rGHY
— Gavin Schmidt (@ClimateOfGavin) October 17, 2017
Next year will be interesting.
However, oceans rule the temperature of the planet, and as this most recent SST shows, there’s a lot of cool water and a clear signature of La Niña shaping up off the coast of South America:

Source: http://www.ospo.noaa.gov/Products/ocean/sst/anomaly/
Ron Clutz of Science Matters writes:
September Sea Surface Temperatures (SSTs) are now available, and we see downward spikes in ocean temps everywhere, led by sharp decreases in the Tropics and SH, reversing the bump upward last month. The Tropical cooling in particular factors into forecasters favoring an unusually late La Nina appearance in coming months.
HadSST is generally regarded as the best of the global SST data sets, and so the temperature story here comes from that source, the latest version being HadSST3.
The chart below shows SST monthly anomalies as reported in HadSST3 starting in 2015 through September 2017.

The August bump upward was overcome with the Global average matching the lowest level in the chart at February 2015. September NH temps almost erased a three-month climb; even so 9/2017 is well below the previous two years. Meanwhile SH and the Tropics are setting new lows for this period. With current reports from the El Nino 3.4 grid sector, it seems likely October will go even lower, with downward moves across all oceans.
Note that higher temps in 2015 and 2016 were first of all due to a sharp rise in Tropical SST, beginning in March 2015, peaking in January 2016, and steadily declining back to its beginning level. Secondly, the Northern Hemisphere added two bumps on the shoulders of Tropical warming, with peaks in August of each year. Also, note that the global release of heat was not dramatic, due to the Southern Hemisphere offsetting the Northern one. […]
Summary
We have seen lots of claims about the temperature records for 2016 and 2015 proving dangerous man made warming. At least one senator stated that in a confirmation hearing. Yet HadSST3 data for the last two years show how obvious is the ocean’s governing of global average temperatures.
Good to see the 1930s have finally been put in their place! Cheekly blighters with all that “false” warming they used to show…
Forgot your /sarc tag! I agree: on what planet we’re the early 40’s warmer than the mid 30’s? Surely not Earth…
we’re?
CLIMATE CHANGE/WARMING is just another tax scam fabricated by usual suspects, government, i.e. politicians. The original tax scam in USA is the income tax. Too bad citizens never bother to read their own laws and regs.
“Exempt income” and “Income that is not” … are ALREADY legally defined, codified in U.S. tax regulations.
Look it up…
“exempt income means”
“income that is not considered tax exempt”
ecfr g ov
Any ocean cooling currently being experienced is due to vast melt off at the poles which is also due in part to solar/earth dynamics and the fact that earth’s orbit has changed enough since 2004 to expose far greater swaths of the planet to high incidence angle sunlight. Volcanic activity, especially oceanic, has markedly increased due to the increase in crustal stress from orbital changes. What is occurring in the Antarctic alone is truly remarkable. The moon, ever the handy dynamic lever that it is, now moves through dozens of degrees of latitude per MONTH rather than the former total of 10deg per YEAR. Many quakes are easily predictable by simply observing the moon’s orbital changes.
Also, they don’t aerosolize the atmosphere the world over just for giggles. It is largely to mitigate increased solar radiation. The sun now rises and sets over canada in summer, far north of 23.5deg north at the tropic of cancer that runs through central mexico.
See divulgence dot net
net search – “Huge Media Blackout Regarding ‘Supermoons’, Orbital and Axis Changes, Quakes and Tsunami”
Also related, see – “Ancient High Performance Electric Motors Discovered….That Are Still In Production!”
Good Journeys
Fisheries on Mars, flying craft and contrails on Mars? Rockets, cities, ice oceans. Your blog is bizarre. You can’t just have an opinion and declare it as a fact. You need empirical evidence, collected over time and cogent analysis of that data. Your blog is none of those. Pure irrational supposition.
divulgence dot net is a waste of time. An entertaining one, for a glimpse of confabulation-in-process, certainly. But still, a waste of time.
>vast melt-off at the poles
WTF? Greenland gained ice in the last ice-year. Meanwhile Arctic sea ice has been steady for about five years. And, that other pole, Antarctica, different methods show different things. consensus graph, last five years of sea ice
Once more, in English this time.
Giant bugs, giant snails, and earthworms a mile long on Mars?
https://marsimages.wordpress.com/
I’m having trouble taking techstufblog seriously.
Too long
“The moon, ever the handy dynamic lever that it is, now moves through dozens of degrees of latitude per MONTH rather than the former total of 10deg per YEAR. ”
_________________________
Are you suggesting the Moon fell out of its orbit?
Better put anouthef layer on that tin foil hat,their out to get us…..
Yup. All that melting and run off:
http://www.dmi.dk/en/groenland/maalinger/greenland-ice-sheet-surface-mass-budget/
http://www.cnn.com/2015/11/03/world/antarctica-ice-gain/index.html
Weirdly, actual real-world measurements disagree.
any changes in overall salinity with the melt off
Can I have some of what you’re smoking please?
On the other hand, no thanks.
“is due to vast melt off at the poles ”
ROFLMAO
Antarctic is about at its norm for this time of year
Arctic is currently on its freeze-up heading into winter.
TRY AGAIN, with some actual pre-thought this time !!
And Green land has had one of its largest positive Surface Mass Balances in quite a while.
AndyG55 says: “Arctic is currently on its freeze-up”
..
Which is true.
…
AndyG55 fails to mention that the Arctic is below 2 standard deviations the average for this time.
….
http://nsidc.org/data/seaice_index/images/daily_images/N_stddev_timeseries.png
…
AndyG55 must not understand what 2 standard deviations means.
PS AndyG55, Greenland Surface Mass Balance (SMB) is the output of a MODEL
PPS, WordPress must be caching the image(s) of Arctic sea ice extent. The link I posted was current to Oct27th, but WordPress shows you Oct 4th.
I want a job where you can make at least $1000 a day and you don’t have to get out of bed. And someone else could make the phone calls for me.
Apparently for Mr Johnson, history began in 1981.
https://www.canadiangeographic.ca/article/northwest-passage-trailblazer
In 1940, ice conditions were comparable to today. That boat had a wood hull then, they use reinforced steel now. I hardly see this year’s NH ice figures as a spiral downward.
By the way sir, you just invalidated any future statements you make which are validated by “the output of a MODEL”.
techstufblog: It’s a long time since I’ve seen so much guff in one comment. Was this written by a marauding netbot?
Rich.
Astronomer here. The moons orbit in not aligned with the ecliptic. It is offset by about 20 degrees I think. Lines of latitude run east /west. The moon would naturally move through several lines of latitude per day, if you were measuring it against the Earth. This is because the moon is in motion, in an orbit that is 20 degrees off. There may be some relevance that the moon’s gravity is strong enough to help drive, or at least, partially direct plate tectonics. It certainly did in the past, so it is possible that weaker areas of the Earths crust would be sensitive to it. The oceans are cooling because solar activity has weakened. As far as the tropics. The Earth is not locked in its current tilt direction. As the seasons change, different areas of the Earth receive different amounts of sunlight. Looking at a time-lapse series of photos of Earth taken from orbit reveals this. In the winter, for example, the Whichever hemisphere that is in winter has a shaded pole. That shade is due to the Sun not rising. The light/shade mark is the day/night division. In the summer, that same pole will be fully illuminated. But as far as the tropics are concerned, there is this thing called the “Precession of the Equinox.” This is caused by the physical wobble of the Earth. The effects as observed from the ground would cause Constellations to rise and set when measured against fixed points in time, such as the solstices and equinoxes. A “Supermoon” is a “click-bait” type of talking point. The Earth is almost 5 Billion years old. How many “Supermoons” has it survived? Ancient motors? Cant be ruled out, you could have had a more advanced form of humanity that died out from this or that co-existing along side a more primitive people. As my ultimate example of this, I give you either the untouched tribes of South America or the Aborigines of Australia. Imagine, if you will, 100,000 years from now, a race of people that have very little knowledge of where they came from. Mostly legends with no real documentation. Through trial and error they make many of the same discoveries as their forgotten ancestors. One day, an archaeologist discovers the Smithsonian itself, perfectly preserved, with all its wonders. Clearly labeled, easy to date, they can tell that unquestionably, these artifacts are 1 million years old. Now, that same team, two years later discovers an ancient village on the other side of the world where a stone spear dates to the EXACT SAME TIME as the rockets and wonders discovered at the other sight. What conclusions would be drawn from such discoveries? Was one set the Gods to another? Did aliens give one set advanced tech while letting the others suffer? Was one side the slaves to the other? IOWs, it would not make much sense to have these two peoples from the same time and yet so different, and yet, there it is. Right here, right now. And if it happened now, it could have happened then. Go back in time far enough and ALL objects on the surface are scrubbed and recycled through plate tectonics. Go into the future far enough and the exact same things happened. This is science. Not myth or “ancient book” or “Rock with scribble”, no. This is predictable, presentable, and repeatable.
For Troll Johnson, history began whenever his handlers tell him it started.
Troll Johnson, all models are wrong, some are useful.
Just because one group of models has proven to be useless is not evidence that all models are useless.
Your only skill is embarrassing yourself.
When the moon is in the Seventh House
And Jupiter aligns with Mars
Then peace will guide the planets
And love will steer the stars
This is the dawning of the age of Aquarius
Age of Aquarius
Aquarius
Aquarius
Did you hope to counter reality with your gibberish? It failed. Buy a parka.
Little Johnson,
Current Arctic sea ice levels are above what they have been for some 90-95% of the last 10,000 years.
They have dropped down from the EXTREME highs pf the LIA, The late 1970’s was up there with those LIA EXTREME highs.
Again you show you have zero cognizance and are just plain ignorant of reality.
Greenland is also very near its highest level in 8000 + years.
You were probably ignorant of that , as well.
That seems to be all you little rants are based on. lack of knowing anything..

And to try to help little johnson overcome his obvious ignorance and get some general perspective into his troll/worm-like existence, here is a graph of the “Greenland Total Ice Mass since 1900”.

Didn’t anyone notice the graph Mark S Johnson put up was for 2015-2016 and not the current graph for Arctic sea ice? And that the point below 2 std dev is from end of March 2016?
Would it make a point about current sea ice extent for me to put up a graph from 1977?
Or? You could just look at the current satellite composite image from NSIDC which shows Arctic Sea covered with tropical beaches and palm trees. Wait, what? Ice coverage is not disappearing, that is all you really need to know.
Sun cycles 24-27 will be colder
The current solar cycle is 24. Do you mean 25-27?
Actually, if you look at the data the trends are very stable. This makes sense, considering a volcano produces more atmospheric pollutants than all the human industrial production ever. But of course that’s inconvenient for a political class that banks their power on everyone else’s fear of the intangible.
The Dalton minimum coincided with a massive volcano eruption and the New Madrid earthquake. If we see that kind of activity during the present solar minimum, it might suggest a correlation between anomalously low solar activity and elevated tectonic activity.
Volcanic eruptions do seem to coincide with solar minimum so we can expect more in the next few decades. As for tectonic shifts which are earthquakes, they are driven by increases in the solar wind and occur where the stream hit the atmosphere. The why is a bit more difficult but try looking at the solar wind any time there is an earthquake in the news and certain you will see it at the top of the speed range.
I think I just saw the same guy saying the same thing, and not bothering to elaborate.
love the way 1880 starts at zero…..must have been perfect then
Exactly, if we did have actual temperature data from say 14000 years ago when Ohio was under 5000 feet of ice, we would see a steady upward increase in temperatures as the ice age receded. The Earth has been warming for 14000 years with some small periods of cooling and it may continue warming until all the ice caps are melted as they were in the past? Man’s contribution is minuscule compared to the power of the universe.
Climate change… the way you know it is a political tool to tax USA and pay the largest CO2 emitter – China, are the facts are not following the scientific method. They only talk about the supply of CO2, never the demand. They only talk about the affects of raising temps, never the agricultural affects of more CO2 (Hint, it is plant food).. But most important fact missing from these “scientists” – The Earth can only sustain 2 billion people without burning fossil fuel.. John Deere does not run on batteries. So, what to do with the 5 or 6 billion corps ?
From 12/15/2016: https://electrek.co/2016/12/05/john-deere-electric-tractor-prototype/
Their workin onit. Next up: Nuclear!
Pilot Dave & Yirgach – That green and yellow thing isn’t a tractor worthy of pulling a plow. These are real tractors:
https://youtu.be/vLNQyJqcE5I
They will be plowing long after that green and yellow thing is buried in a toxic waste landfill.
Yirgach:
“Zero emission agriculture”! Whence does the electric tractor charge its batteries? Unless the power source is nuclear, hydro, wind or solar, there will be emissions. And even with those, more CO2 and/or environmental degradation.
Fewer birds and bats to eat insect pests, so more need for fossil-fuel-based pesticides.
Neil,
Now that is maximal emission agriculture. But I shudder at how much those monsters must compact the soil they plough.
My god, it takes too long to refuel a combine now. We only have a short window to cover all our acreage, planting or harvesting. Can you imagine the battery capacity and charge time required to replace a 325 HP (242.4 kilowatt) diesel?
“The Earth can only sustain 2 billion people without burning fossil fuel”
This is not sustainable! Fossil fuel is the accumulation of the sun’s energy by plants and warehoused as hydrocarbons for millions of years. Fossil fuel is being burned faster than it is being replenished. Fossil fuel will one day run out.
Fossil fuels are a good way for the human society to bootstrap itself into the next method of power generation and use. God gave humans fossils fuels so that we could build first generation solar panels (you can’t build solar panels using the power from solar panels that have not yet been produced) and deserts to put them into so that we could generate renewable power to run society and built the next generation of solar panels.
If the earth can only (renewably) sustain 2 billion people… we had better start colonizing new real estate (mars is a good start).
“The Earth can only sustain 2 billion people without burning fossil fuel.. ”
Where does that ‘fact’ come from? BTW, where does the hydrocarbons on Titan come from? Fossil fuels? Did the dinos fly to Titan? Or maybe, just maybe there is a abiotic source for hydrocarbons too?
Do we know all hydrocarbon resources on Earth?
What about all those new CH4 vents recently found in the ocean? Or about the methane clathrates at the ocean bottom?
“Saturn’s orange moon Titan has hundreds of times more liquid hydrocarbons than all the known oil and natural gas reserves on Earth, according to new data from NASA’s Cassini spacecraft”
https://www.nasa.gov/mission_pages/cassini/media/cassini-20080213.html
Just off the top off my head, diesel/electric makes sense for a tractor. They don’t need to go fast but have need for lots of low end torque.
There may be drawbacks such as extra complexity or weight.
Spot on!!!
funny how the same places will have a positive anomaly for 40 years…..
…that’s not an anomaly!!
40 years is an anomaly. The little ice age was an anomaly.
[??? .mod]
Or they represent cycles of roughly that duration of time. Which then cycle in the other direction, as has been demonstrated in countless climate reconstructions, some going back eons.
Well crap. Anything is an anomaly compared to a “norm” of a different value. The trouble is that “norms” are subjective sorts of things.
“The little ice age was an anomaly.”
Yep , and can’t we all be VERY THANKFUL that we have has some SLIGHT warming out of that COLDEST of times.
Krakatoa- 1883….
Krakatoa erupts – Aug 27, 1883 – HISTORY.com
http://www.history.com/this-day-in-history/krakatoa-erupts
God I miss 1880 (sigh).
Inconvenient: oceans continue to cool
No problem:
Correcting Ocean Cooling
Possibly the most glaring example of widespread and group confirmation bias in modern science.
They took direct sea temperature measurements with XBT probes and later, ARGO buoys. They did not like what the direct measures told them, so they corrected them using indirect measurements from ERBE and CERES flux measurements, satellite sea level measurements, GRACE gravity measurements, and inferences. All, in their minds, much better than direct measurements with some of the most advanced instrumentation available.
For those of you who have not seen the article, follow the link and give it a once-over. It is on the NASA website.
@Steve Case and @TonyL
Can’t agree more Tony. When they found the result (Ocean cooling) didn’t match their religion or hypothesis of Ocean warming they spent all their efforts trying to prove why the results were wrong! I’ve never read so much scientific bull, ever! Just sums up global warming ‘research’. They must follow an alarmist methodology; the ‘scientific’ method they follow being – whatever the data shows how can they make any inconvenient results prove their global warming alarmist prophecy.
@ur momisugly Hot:
Indeed!
A first read shows how they sought out other data sets for confirmation of their results. Fair enough, so far so good. It all sounds reasonable and plausible. Then down near the bottom of the article we find this:
They took as a foundational principle that Sea Level Rise is accelerating. Then they were unrelenting in bashing the data until it conformed with that need.
The trouble is that SLR is *not* accelerating.
I took a look at the Boston Tide Gauge data recently. There is absolutely 0.00% acceleration in the data. I *was* able to see the moon’s orbital inclination cycle (18.60 years) in the data.
If you ignore all the previous data and just look at 1993 on, it looks like acceleration but is really just the long term orbital cycles at play.
If you do not understand the effects of the moon on sea level, you probably should not be messing around with sea level data.
East Anglia was not an outlier but rather exposed the lengths to which these flimflam artists will go. They will never acknowledge stagnant or declining temperatures until they decline by whole numbers over many years. They will claim warming where none exists and they will program their models to make it so. And when people declare that seasonally winters are getting colder and snowier in their home towns, they will be called idiots for not realizing that weather cannot be conflated with climate unless it destroys property and takes life in which case it is man made.
We will need a mini-ice age for these charlatans, with government funded agendas, to scurry off into hiding places and desist with this global ending global warming nonsense. They will disappear without so much as a “never mind!”
However they will lay low for a few years and then they will dust off all the academic papers from the 70’s and declare shamelessly that the coming Ice age is all because of man burning fossil fuel and they have determined sans polling that they have a 97% consensus which has been thoroughly peer reviewed and anyone who disagrees with them is a science denier and call for a Government inquisition. Second verse same as the first.
This is not representative of the scientific method at all. In the scientific method, you:
A. Make an observation
B. Form a question
C. Form a hypothesis
D. Conduct an experiment
E. Analyze the data, and …
F. Draw a conclusion
These are the simple steps provided for children to understand how science is SUPPOSED to work.
What we clearly see from Willis is that warming is the foregone conclusion, to linearly match the increase in atmospheric CO2, and a breakdown of the integrity of science and the scientific method.
http://www.schoolofdragons.com/how-to-train-your-dragon/the-scientific-method/scientific-method-steps
Guess you don’t understand or appreciate the IMPORTANCE of presenting all information in manner that supports the Progressive Agenda du Jour!??? Well shame on you for trying to be objective – TOTALLY uncalled for!
Thanks Steve for the link & reminder. I value that article as a classic masterpiece, really worth a read.
Steve
Interesting paper in that it contains admissions of errors and looks for ways to correct them. I get the impression that ‘correcting the XRT data’ was not entirely without bias, meaning that it seems awfully convenient to have the data corrected and it finally matches (sort of) the models they admit were not able to reproduce the ups and downs observed by every set of measurements. It really does sound as if they corrected the data until it matched the expectations of the models and independent approaches.
I am not saying definitively that is what happens, I think the details are not in the paper to support that opinion categorically. It seems to conclude that the warming from 1993 was less than thought because the warming 1980-1993 was more than thought. Is that correct?
Many papers and opinions have passed under the bridge of ‘acceleration’ in sea level rise and ocean heat content. Time and again, it just isn’t there. Why is anyone surprised? The expected temperature rise isn’t there either. Neither is the hotspot. In the search for something alarming, many stoves have been turned over yet the little bugger remains elusive.
It is just not that exciting or alarming or anything we have to worry about compared with economic injustice, international lawlessness and the fundamentally cybercrime-nature of the banking systems. Global *yawn* warming….yeah, right.
And yet Public Agencies are left to drift about in a warmist sea and develop “Adaptation Strategies” with a CO2 mitigation component. This due to an over reliance on faulty modelling projections.
See http://www.trpc.org/580/Thurston-Climate-Adaptation-Plan
for a rather politically distorted view on a simple issue.
If I were to adjust the parameters of interpolation gridding to produce anomaly maps that create the unrealistic blotchy patterns that climatastrologists seem to prefer, my boss wouldn’t take me or my results too serious.
Two choices: Recover the Argo floats and check their calibration to determine if they are reading correctly or use imprecise data from other indirect sources and torture it until it matches the models. Obviously, the first choice is wrong as it will give the wrong answers. Welcome to climate “science”.
then, we must heat the oceans.
I work with people like these.
Your link is not comforting. Gov’t scientists. Ha!
“With update thru September, ~80% chance of 2017 being 2nd warmest yr in the GISTEMP analysis”
And how much of those data are simply made up rather than actually measured? Most, correct?
mini ice age coming soon to a neighborhood near you.
That’s no doubt part of it, but satellite data has also seen a fair number of warm months. My view is this is due to the absence of a real La Nina (driven by Bjerknes feedback) following the 2014-2016 El Nino. There was lots of warm water left over that was not pushed back into the Pacific Warm Pool. It is that warmer ocean water that has driven the warm 2017 temperatures.
I mentioned early this year that it looked like we might get a La Nina even as all the models were predicting El Nino. It just took a long time wind/ocean current positive feedback to take hold.
Of course, this means a lot of warm water was cooled during this period. As mentioned often here, this is truly a cooling of the planet as the warmth temporarily passes through the atmosphere on its way to space.
So planetary orbit is going to come into play. Saturn has a 535 year orbit and Jupiter has a 11.5 year orbit. In 2021 they will both be opposite the earth during the winter. I imagine the tides caused by the planets on the sun will prove to have a profound effect on our winters. I expect colder winters for the next decade with 2021 being rather cold.
Their gravitational influence will have effectively zero effect.
No, Saturn and Jupiter are massive enough to affect Earth’s orbit and rotation. I would assume this effect applies especially to when they are aligned. The Earth is not rotating around the sun, everything including the sun is rotating around the gravitational center (barycenter) of the solar system, which the gas giants (especially Jupiter) help to create, and this point is constantly changing relative to the motions of these bodies.
https://www.sciencedaily.com/releases/1997/12/971218090305.htm
https://weathercycles.wordpress.com/2016/01/08/earths-climate-linked-to-jupiter-saturn-and-the-solar-system-barycentre-discussion-open/
Jupiter’s gravity influences the Earth’s rotation?
What exactly have you been smoking?
I haven’t been smoking anything MarkW, I’ve been reading, apparently something that many here could benefit from.
http://www.pattern-recogn-phys.net/1/107/2013/prp-1-107-2013.pdf
Found this cool site that shows the sun’s displacement via planetary gravity. Picking both jupiter and saturn gives an interesting loop to the sun with approx. a 1.5 diameter displacement.
http://astro.unl.edu/classaction/animations/extrasolarplanets/ca_extrasolarplanets_starwobble.html
Saturn has as 29.5 year orbit.
Ya, my goof. Every 595 years of so because of the variation in the orbit of Saturn and Jupiter, they end up on the opposite side of the sun for our winter.
Saturn has an orbital period of about 30 years, not 535 years.
The planets have far less effect on the tides than the Moon. That was proven in the last “celestial lineup”.
Just a correction: Saturn’s orbital period is 29.457 years, and Jupiter’s is 11.86 years.
“Saturn has a 535 year orbit”
Saturn has a 29 1/2 year orbit.
Saturn has a 29 1/2 year orbit. There is symmetry if they perturb Earth’s orbit to the point of colder winters, then hotter summers would occur too. More likely an effect will be the solar minimum approaching the Marauder Minimum.
“approaching the Marauder Minimum”
Does this mean there will be less marauders? or there will be smaller marauders?
That could turn us all into berserkers..
or as the AGW crowd say.. there must be a bucineer !!
When the temperature dropped, the Norse tended to go a-Viking.
The cycle may be broken, though – decades of the Nanny State has turned them into patsies that can’t even defend their own territory.
(Note, though, that Minnesotans are not quite so wussified – that could be a problem…)
Excuse me, Donald Hudson, but Saturn has a 29.457 Earth years orbital period, NOT 535 years. I do not know where you got the number 535, but it is incorrect. Even Pluto’s orbit is NOT 535 Earth years.
Never mind. I see everyone else caught that 535 number, too. I will regard it as a typo and let it go.
Don Hanson:
A we all know, a gravitational force diminishes as the distance squared…the inverse square law. A tidal force is a differential gravitational force, so it diminishes as the distance cubed. That’s why earth’s tides are primarily caused by the moon, and only secondarily on the much more massive sun, because the moon is so much closer to earth than the sun. As for the major planets Jupiter and Saturn, Jupiter is about 5 times farther from earth than the sun, and less than 1% the sun’s mass, so Jupiter’s tidal effect on earth is less than 0.01% that of the sun. Saturn is twice as far from earth as Jupiter, and about a third the mass, so it’s tidal effect on earth is less than 5% that of Jupiter.
But your statement is about Tidal effects on the sun, caused by the planets, which you imagine (your word) can cause a profound effect on our winters (Northern or Southern hemisphere or both?)?
Also, take a look at what is happening in Antarctica atm. The ice extent is increasing, which is very unusual for this time of year.
http://nsidc.org/arcticseaicenews/
not that unusual at all: the El nino warm waters are leaving the antarctic… next year the antarctic will be again “normal” to above avarage if it’s trend continues….
Yes, and Antarctica had one of the latest maximums on record – a “double bump” with an early ‘faux max’ that got all the doomsters excited. However, I have heard only ‘crickets’ on the second (higher) maximum, and the current slowdown in extent loss. Something is definitely going on down there, and few seem to be talking about it.
Imo, that is likely due to the change in surface wind patterns around the continent. For the last several years there were strong southern surface wind intrusions which pushed into the edge of the continent, bringing warm surface winds which also carried more moisture into areas. That steady stream of south flowing wind flows stopped around June of this year as a circular buffering wind pattern asserted itself which lead to increased protection of the ice shelves from warm surface wind flows. I have saved several years of daily screenshots of temperature changes in Antarctica. The surface wind effects clearly show up as they are an important factor in temp changes across Antarctica and the surrounding sea ice extent.
goldminor
Please show your proof, your examples.
From 1992 through 2015, the Antarctic sea ice steadily increased. At its satellite-era record high in June 2014, the ANtarctic sea ice area was 2.14 Mkm^2 LARGER than average, an anomaly larger than the entire land area of Greenland’s 2.06 Mkm^2.
Shortly therefter, the Univ of Illinois Cryosphere sensor crashed, and they have been out of service since then. The Cryosphere principles have separated/retired/been fired, and the ANtarctic sea ice extents suddenly dropped about 1.3 Mkm^2 to a 2016 low averaging 1.5 Mkm^2 BELOW average ANtarcic sea ice extents.
Since mid-summer 2017, ANtarctic sea ice extents have recovered another 1.0 Mkm^2 (1/2 Greenland increase in area), and are ow approaching their long-term average extents.
May yet increase past normal the next few weeks, as they apparently continue to expand despite the “reset” when the Cryosphere lab died/changed/came under new management.
Now, nowhere in these recent three years have the winds changed consistent with the area changes. For your theory to hold, you must explain each deviation from the long-term growth (1992-2015), the 2015-2016 decrease – NOT consistent with the El Nino north of the Antarctic by tens of thousands of kilometers – unless you’re willing to show how currents flow backwards, and the 2017 recovery towards normal.
I could be convinced, but not yet.
I drew my inferences from watching and saving daily screenshots of Antarctic temps using earth null school. Looking at temps allowed me to come to understand in part how incoming flows of warmer, lower latitude surface air flowing south into Antarctica would influence sea ice extent and temps on the continent.
I noticed how the warmer, southern flowing surface wind flows coincided with the daily sea ice extent changes around the continent. I could further explain with pictures, but my XP computer died several months back, motherboard most likely. All of my years of saved material is on the drive though. So I will have to eventually buy a cheap used XP based computer.
I remember the unisys sst chart was reset a few years ago because there were “instrument problems”. The reset changed the predominant cooler blue color to the warmer yellow orange. Now the sst charts are become more predominantly blue again
Love those cooling waters Makes surf fishing great
+1
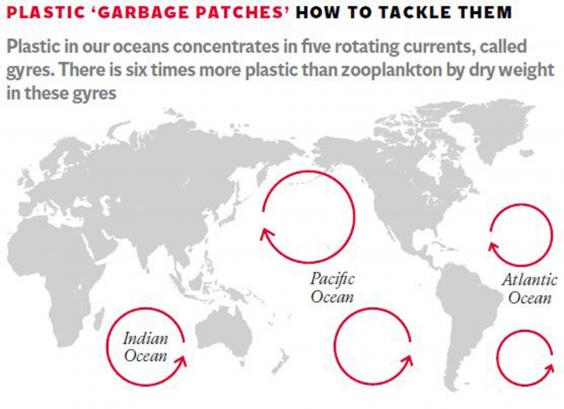
I saw a video of the enormous floating plastic garbage “island” in the oceans. Maybe we should abandon this human caused global warming nonsense and focus all those resources, time and money at cleaning up that trash in the oceans.
Good idea. We also need to use more bio-degradable plastics.
It seems the ocean gyres are garbage collectors.
Greenies like to recycle.
Why aren’t they out there scooping up all this plastic and changing into chairs or something ?
Soros and Al Gore could fund such a worthwhile environmental venture.. couldn’t they ? 😉
The bio-degradable plastics break down into “harmless” nano-particles. But now we are finding them being eaten by fish. Still no proof they are digested, or impact the fish. But they are part of the food chain now.
I noticed the salmon I eat are now more chewy. /sarc
Plastic is bio-degradable. Even more so when exposed to sunlight.
A bit of simple chemistry on three common plastics: Polyethene – (C2H4)n; Polypropylene – (C3H6)n; Polystyrene – (C8H8). And Cellulose (wood fiber) – (C6H10O5)n. Even if the said plastic garbage island exists (which it doesn’t) what is the problem?
There is one in the Caribbean. Off of Honduras. Fairly large, actually.
Ther are parts of the Sargasso sea just north Of Navidad bak and there are EPS (expanded Styrian Balls ) Styrophone broken down to the little white plastic balls
As far as the Eye can see if this is not a Plastic island I don Know what is.
it also supports a very large Ecosystem.
one of the tuna boats caught 28,000 Bluefin under a rotten paddle in the Pacific some years ago
Barnacles and other crusty stuff grows on the plastic and eventually it gets too heavy to float. While it does float it supports a micro-habitat. Far from shore most of the deep sea has little life, but where there are floating objects (such as a fouled boat-boittom) there are little swarms of fishes.
we do http://www.fishingforlitter.org.uk/ a friend of mine takes part in this scheme.
This “garbage island” consists of something like one small chunk of plastic for every square mile.
Yes
“Thanks for the truth” Very refreshing! We are in a Grand Solar Minimum, and things are going to get cooler, just wish the MSM would tell the truth, but thats just to inconvenient.
the problem I see is that it can become too cool, perhaps. If too cool we must go to sunbath on some rather tropical islands.
To gleefully misquote James Carville, “Its the Sun, stupid!”. Ya know? That big, flaming ball in the sky that has been rather quiescent during the last few years?
Wow, that was fast. This article is linked on Drudge Report… Cool.
NO, not cool. That was caused by global warming…
Well, thing have been heating up for the Watermelons, lately. 🙂
La Niña develops.
The heat is just going to its safe zone.
What do you expect when climate haters are allowed to speak!
That ‘cold blob’ that started a couple of years ago in the Pacific NW is now on the Alaskan/Canadian coast. Looks like another one developing in same region of NW Pacific now. May be a loong time for cold eastern Pacific coastal waters along North America if the flow mimics the earlier ‘warm blob’.
A sign of a return to a negative PDO?
Not sure what, if anything, it’s a sign of. Just an observation over several years. The ‘warm blob’ began in the same area and moved in the same direction.
Climate “scientists”. LOL!
Climastrologists performing climate séance.
Anthony, I was remarking on low volume of warm water in the equatorial Pacific despite temperatures being warm prior to the development of the El Nino on some of the last threads here by Bob Tisdale when the El Nino was having a long doubtful zig zag development. I was surprised (and suspicious) of the peak it reached, but not surprised when it just dropped like a rock.
I noted also, the stubborn hot blobs in the temperate/north Pacific suddenly turned to cold Blobs and rather than simple upwelling in the eastern equatorial, the growing cold Blobs in both the NH and SH were slanting down to the equator feeding the ENSO band.
Accordingly, I predicted a major cooling and have repeated this over the months here. It’s surprising to me that climate scientists haven’t picked up on this (Gavin still blaring about warming). I also predict it will become someone’s PhD thesis over the next year or so.
Doubtful that a sane PhD student would undertake a dissertation project that is orthogonal to the conventional wisdom, let alone find an advisor who would agree to this topic. See Judith Curry’s resignation letter and her comments at Climate Etc. for further edification.
that’s right. Not student with two fingers of front would dare to challenge “kosher” science with heretical paper.
i can remember those posts on bobs thread gary .looks like you were spot on regarding the lack of heat at depth .
Sea Surface Temperatures are entirely weather and solar driven, with help from nearly totally-not-understood forces behind ocean up-welling and down-welling currents. SSTs do not relate to ocean heat content (necessarily).
SSTs affect “Global Surface Temperature” because they are part of the formula.
Has anyone else noted that the Gav’s graph is struggling to maintain 1 degree above “the late 19th century”- while we have heard claims of much higher temperature rise claimed.
As if Gavin (or anybody else) knows what the global temperature was at the beginning of the twentieth century! I noticed he put error bars on his prediction for 2017. He should also put error bars on the temps before 1900 – any predictions on how wide those should be?
+/- 5 degrees C
One of the mysteries of climastrology is that often their reconstructions claim greater uncertainty for modern temperatures than for 100 year old temperatures.
Leftist agendas drive leftist governments and leftist models, but not Earth’s climate.
Leftist climate “models” are intentionally inaccurate because leftists:
(a) fudge climate warming/cooling cycles predating man-made emissions;
(b) fudge fluctuations in total solar irradiance (TSI);
(c) fudge temp data pre- and post-man-made emissions;
(d) fudge man-made and pre- and post-natural emissions;
(e) fudge absorption rates;
(f) fudge heat retention;
(g) fudge consequences . . .
Love to see some comparisons between Gavin’s farcical global temp graph and a bunch of rural, well sited temperature stations from around the world. That graph to me looks like pure fiction.
Go to https://realclimatescience.com/
Download the code and data base of USHCN stations that Tony Heller has provided and you can do your own plots and analysis to see how their claims match up for the United States.
As far as “global temperature” goes, there simply are not enough surface stations reporting for Gavin or anyone else to make the claims they know what the average surface temps of this planet is at any given time EVER! The fact that they claim to know using such limited data tells anyone honest and familiar with the situation all they need to know about the veracity of the claims of GISS.
https://realclimatescience.com/2017/10/the-wildly-fraudulent-noaa-climate-extremes-index/
100%
When some 200,000 standardized surface stations (about one for each thousand of Earth’s 196.94 million sq miles), placed at all elevations, have been reporting for 60 years, so that two 30-year units can be compared, then we might have a reasonably accurate and precise handle on global average surface temperature. No need for anomalies.
Your number is short by at least an order of magnitude. Probably several.
Forecast of the polar vortex in the lower stratosphere on November 1st. North America.
https://earth.nullschool.net/#2017/11/01/0000Z/wind/isobaric/70hPa/orthographic=-93.64,59.10,393
Cool! Ought to be nice and chilly by November 6th for the Scream At The Sky Because Trump Keeps Winning event.
Hope for sleet!
Plan for sleet if Gore participates! But then Gore is always barking at the moon and screaming. He should have a ‘bark collar’.
we are getting some southern vortex action here in scotland tomorrow wren, my first winter cod trip of the season ,perfect start weather wise.should be a nice northerly swell running by the time i start.
When ice caps melt, they dump cold water into the oceans.
Duh.
Warmist excuse.
Lame.
Which melting ice caps would those be?
The by far largest ice sheet, the East Antarctic, which contains most of the fresh water on earth, is gaining mass.
Not to mention that the vast majority of meltwater, almost 400 feet of sea level rise, occurred when the Earth was rapidly warming. So the mechanism the warmists are claiming is causing the cooling of sea surface temperatures only functions when it’s convenient, per climate séance.
That’s right, because everyone knows ice caps are floating on hot water and tropical land masses (where the temperature is SO much higher; maybe the ice just didn’t like the neighborhood!).
Indeed. Now…if only they oblige you and actually melt!
http://www.cnn.com/2015/11/03/world/antarctica-ice-gain/index.html
and
http://beta.dmi.dk/en/groenland/maalinger/greenland-ice-sheet-surface-mass-budget/
(duh?)
Follow the money! Those that argue and scream may have their federal grants up for renewal.
of course the sea is cooler, do you know how much ice has melted into it over the past decade? what do you think caused the ice age? It is coming to a wide consensus within the geological community that a large meteorite impacted the great north american ice cap causing sudden and catastrophic flooding, immediately cooling ocean temperatures and thus cooling the entire planet. But obviously it took a tremendous amount of heat to do so. Thats what we are looking at now, things are heating up, ice is melting, ocean temperatures are cooling, simple
So we had an ice cap, which means we were in an ice age. Then a meteor hit and caused an ice age. Then it warmed up which cooled the oceans.
I must have forgot to carry the one or something.
You didn’t throw your chicken bones correctly.
Bingo!
roflmao john 🙂
Ehh, no. The rate of melt water entering the oceans has been relatively constant for the past 8,000 years. The vast majority of melt water entered the oceans ca. 15,000-12,000 years ago when the atmosphere and oceans were rapidly warming. No one credible is claiming extraterrestrial debris has anything to do with the glacial/interglacial cycles.
“ice is melting, ocean temperatures are cooling, simple”
Ummmm.. NO.
Antarctic is currently skirting along its normal maximum
Arctic sea ice is GROWING as winter approaches, and is well above what it has been for some 90-95% of the last 10,000 years.
Greenland has just has it largest +ve SMB in a long time.
Its cooling ….. BECAUSE ITS COOLING !!!
Famous sayings uttered throughout human history:
Global Warming is real. The science is settled.
Phrenology is real. The science is settled.
Drapetomania is real. The science is settled.
Alchemy is real. The science is settled.
Phlogiston is real. The science is settled.
The Ptolemaic Model is real. The science is settled.