From the Fabius Maximus Blog. Reposted here.
By Larry Kummer. From the Fabius Maximus website, 21 Sept 2017.
Summary: The gridlock might be breaking in the public policy response to climate change. Let’s hope so, for the gridlock has left us unprepared for even the inevitable repeat of past extreme weather — let alone what new challenges the future will hold for us.

The below graph was tweeted yesterday by Gavin Schmidt, Director of NASA’s Goddard Institute of Space Sciences (click to enlarge). (Yesterday Zeke Hausfather at Carbon Brief posted a similar graph.) It shows another step forward in the public policy debate about climate change, in two ways.
(1) This graph shows a climate model’s demonstration of predictive skill over a short time horizon of roughly ten years. CMIP3 was prepared in 2006-7 for the IPCC’s AR4 report. That’s progress, a milestone — a successful decade-long forecast!
(2) The graph uses basic statistics, something too rarely seen today in meteorology and climate science. For example, the descriptions of Hurricanes Harvey and Irma were very 19th C, as if modern statistics had not been invented. Compare Schmidt’s graph with Climate Lab Book’s updated version of the signature “spaghetti” graph — Figure 11.25a — from the IPCC’s AR5 Working Group I report (click to enlarge). Edward Tufte (The Visual Display of Quantitative Information) weeps in Heaven every time someone posts a spaghetti graph.
 Note how the graphs differ in the display of the difference between observations and CMIP3 model output during 2005-2010. Schmidt’s graph shows that observations are near the ensemble mean. The updated Figure 11.25a shows observations near the bottom of the range of CMIP5 model outputs (Schmidt also provides his graph using CMIP5 model outputs).
Clearing away the underbrush so we can see the big issues.
This is one in a series of recent incremental steps forward in the climate change policy debate. Here are two more examples of clearing away relatively minor issues. Even baby steps add up.
(1) Ocean heat content (OHC) as the best metric of warming.
This was controversial when Roger Pielke Sr. first said it in 2003 (despite his eminent record, Skeptical Science called him a “climate misinformer” – for bogus reasons). Now many climate scientists consider OHC to be the best measure of global warming. Some point to changes in the ocean’s heat content as an explanation for the pause.
Graphs of OHC should convert any remaining deniers of global warming (there are some out there). This shows the increasing OHC of the top 700 meters of the oceans, from NOAA’s OHC page. See here for more information about the increase in OHC.
(2) The end of the “pause” or “hiatus”.
Global atmospheric temperatures paused during period roughly between the 1998 and 2016 El Ninos, especially according to the contemporaneous records (later adjustments slightly changed the picture). Activists said that the pause was an invention of deniers. To do so they had to conceal the scores of peer-reviewed papers identifying the pause, exploring its causes (there is still no consensus on this), and forecasting when it would end. They were quite successful at this, with the help of their journalist-accomplices.
Now that is behind us. As the below graph shows, atmospheric temperatures appear to have resumed their increase, or taken a new stair step up — as described in “Reconciling the signal and noise of atmospheric warming on decadal timescales“, Roger N. Jones and James H. Ricketts, Earth System Dynamics, 8 (1), 2017. Click to enlarge the graph.
What next in the public policy debate about climate change?
Perhaps now we can focus on the important issues. Here are my nominees for the two most important open issues.
(1) Validating climate models as providers of skillful long-term projections.
The key question has always been about future climate change. How will different aspects of weather change, at what rate? Climate models provide these answers. But acceptable standards of accuracy and reliability differ for scientists’ research and policy decisions that affect billions of people and the course of the global economy. We have limited resources; the list of threats is long (e.g., the oceans are dying). We need hard answers.
There has been astonishingly little work addressing this vital question. See major scientists discussing the need to do so. We have the tools to do so. A multidisciplinary team of experts (e.g., software engineers, statisticians, chemists), adequately funded, could do so in a year. Here is one way to do so: Climate scientists can restart the climate policy debate & win: test the models! That post also lists (with links) the major papers in the absurdly small literature — and laughably inadequate — about validation of climate models.
There is a strong literature to draw on about how to test theories. Let’s use it.
- Thomas Kuhn tells us what we need to know about climate science.
- Daniel Davies’ insights about predictions can unlock the climate change debate.
- Karl Popper explains how to open the deadlocked climate policy debate.
- Milton Friedman’s advice about restarting the climate policy debate.
- Paul Krugman talks about economics. Climate scientists can learn from his insights.
- We must rely on forecasts by computer models. Are they reliable? (Many citations.)
- Paul Krugman explains how to break the climate policy deadlock.


(2) Modeling forcers of climate change (greenhouse gases, land use).
Climate models forecast climate based on the input of scenarios describing the world. This includes factors such as amounts of the major greenhouse gases there are in the atmosphere. These scenarios have improved in detail and sophistication in each IPCC report, but they remain an inadequate basis for making public policy.
The obvious missing element is a “business as usual” or baseline scenario. AR5 used four scenarios — Representative Concentration Pathways (RCPs). The worst was RCP8.5 — an ugly scenario of technological stagnation and rapid population growth, in which coal becomes the dominant fuel of the late 21st century (as it was in the late 19th C). Unfortunately, “despite not being explicitly designed as business as usual or mitigation scenarios” RCP8.5 has often been misrepresented as the “business as usual” scenario — becoming the basis for hundreds of predictions about our certain doom from climate change. Only recently have scientists began shifting their attention to more realistic scenarios.
A basecase scenario would provide a useful basis for public policy. Also useful would be a scenario with likely continued progress in energy technology and continued declines in world fertility (e.g., we will get a contraceptive pill for men, eventually). That would show policy-makers and the public the possible rewards for policies that encourage these trends.
 Conclusions

Science and public policy both usually advance by baby steps, incremental changes that can accomplish great things over time. But we can do better. Since 2009 my recommendations have been the same about our public policy response to climate change.
- Boost funding for climate sciences. Many key aspects (e.g., global temperature data collection and analysis) are grossly underfunded.
- Run government-funded climate research with tighter standards (e.g., posting of data and methods, review by unaffiliated experts), as we do for biomedical research.
- Do a review of the climate forecasting models by a multidisciplinary team of relevant experts who have not been central players in this debate. Include a broader pool than those who have dominated the field, such as geologists, chemists, statisticians and software engineers.
- We should begin a well-funded conversion to non-carbon-based energy sources, for completion by the second half of the 21st century — justified by both environmental and economic reasons (see these posts for details).
- Begin more aggressive efforts to prepare for extreme climate. We’re not prepared for repeat of past extreme weather (e.g., a real hurricane hitting NYC), let alone predictable climate change (e.g., sea levels climbing, as they have for thousands of years).
- The most important one: break the gridlocked public policy by running a fair test of the climate models.
For More Information
For more about the close agreement of short-term climate model temperature forecasts with observations, see “Factcheck: Climate models have not ‘exaggerated’ global warming” by Zeke Hausfather at Carbon Brief. To learn more about the state of climate change see The Rightful Place of Science: Disasters and Climate Change by Roger Pielke Jr. (Prof of Environmental Studies at U of CO-Boulder).
For more information see all posts about the IPCC, see the keys to understanding climate change and these posts about the politics of climate change…
- Why the campaign to warn people about climate change fail: incompetence.
- Ignoring science to convince the public that we’re doomed by climate change.
- Look at the trends in extreme weather & see the state of the world.
- Focusing on worst case climate futures doesn’t work. It shouldn’t work.
- Paul Krugman shows why the climate campaign failed.
- Manichean paranoia has poisoned the climate debate.
- What you need to know & are not told about hurricanes — About Harvey and Irma.
It is true the Ocean Heat Content is the best metric for ‘global warming’. Now provide a mechanism showing how a small increase in carbon dioxide in the atmosphere can provide the amount of energy to raise that ocean heat content, given that the top 10 meters or less of the oceans hold more energy than the entire atmosphere which itself has only increased in ‘temperature’ by a very small amount.
The quantities do not match.
There must be a major energy input to raise the ocean heat content and small amounts of claimed ‘back radiation’ are insufficient. It is far more likely to be energy from the Sun.
Ian W: Here is one of many places to find an explanation of how atmospheric CO2 causes heating of the oceans: https://scienceofdoom.com/2010/10/06/does-back-radiation-heat-the-ocean-part-one/
(Sigh). No, really it doesn’t. Here is why it doesn’t. It does not separate out the difference in radiation. What part is specifically attributable to the increased CO2. What part is attributable to natural causes if, for instance, the amount of CO2 was low and steady in the atmosphere.
Tom,
Given the claimed increase in ocean heat content calculate the number of joules of energy required. Now calculate the amount of ‘downwelling’ infrared in watts per square meter due to CO2 from anthropogenic sources and see how long ‘the oceans’ need to warm by the amount claimed. If at all.
Even the reference you gave admits that the top micron of water surface absorbed most of the infrared and would be raised in energy given Raoult’s law this will lead to an increase in evaporation removing that energy from the surface of the ocean – cooling the surface.
Your idea that 3 watts per square meter of infrared from CO2 will warm water at the rate claimed in the CIMP graphs is extremely simple to test. I propose that you attempt to falsify / validate your hypothesis by testing it. Remember as Earth’s surface is 70% or so water this is actually a test of the entire anthropogenic global warming hypothesis. You could become famous.
Tom Dayton, The s-o-d blog does not explain how OHC increases are caused by ghgs in the colder atmosphere. The only ocean-atmosphere heat exchange process that adds heat/thermal energy to the oceans is solar radiation. The other ocean-atmosphere heat exchange processes, conduction, latent heat/evaporation, and longwave radiation all cool/transfer heat out of the oceans.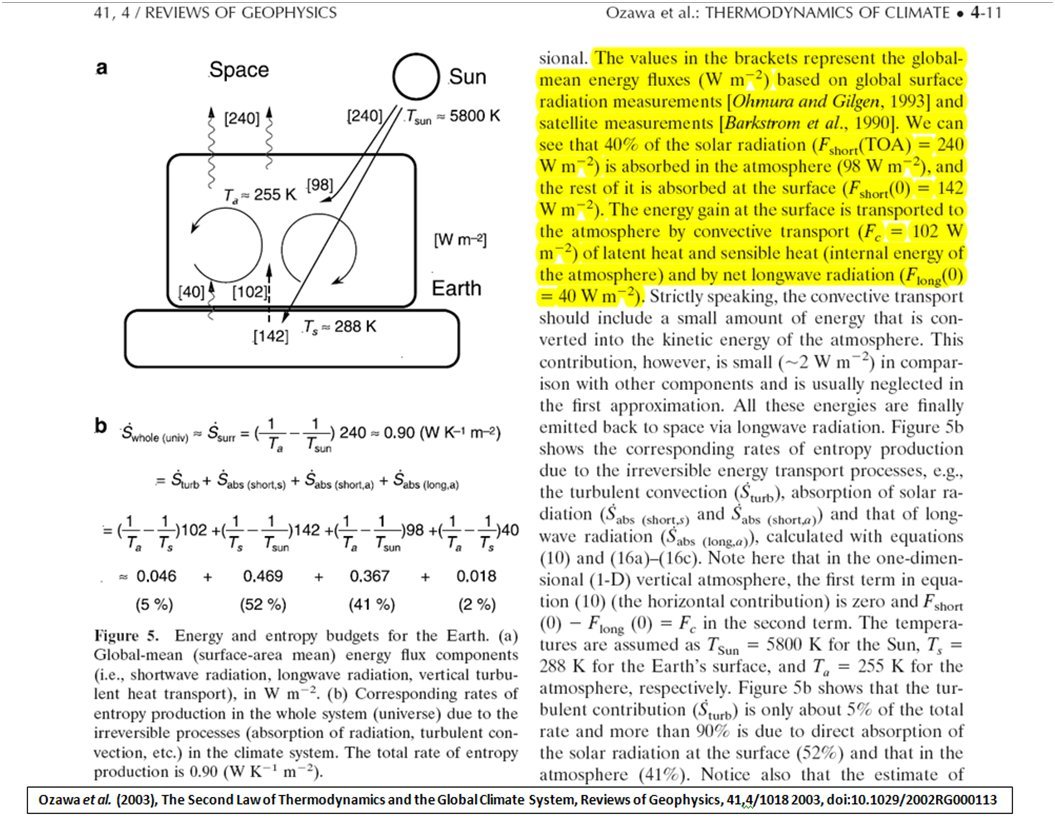 . Notice: a) this paper was written explicitly from the perspective of the 2nd Law of Thermodynamics and b) there is no energy flux component from the colder atmosphere to the warmer surface of the Earth.
The transfer of thermal energy via longwave radiation is one directional from the warmer ocean surface to the colder atmosphere. There is no two way flow of thermal energy, for that would violate the 2nd Law of Thermodynamics as it would require the transfer of thermal energy/heat from the colder atmosphere to the warmer (on a global average) surface of the ocean, causing the warmer object to increase its temperature. That can’t happen in the real world. 2nd Law. Here is the real Earth energy budget, from peer reviewed science,
The claim that the ‘missing heat’ during the ‘pause/hiatus’ is in the ocean actually supports natural/solar-caused climate warming, not anthropogenic ghg caused warming. And since the temperature the atmosphere didn’t increase during the pause, there can be no increase in OHC due to less heat escaping the ocean due to more ghgs in the atmosphere.
Here is Part 4 of that series. At its start it has links to Parts 1, 2, and 3: https://scienceofdoom.com/2011/01/06/does-back-radiation-%e2%80%9cheat%e2%80%9d-the-ocean-%e2%80%93-part-four/
Tom, Hypothesis C is based on oversimplification. And still doesn’t explain the transference of all those joules into the ocean.
I’m interested in why you quote scienceofdoom as an authoritative source.
JonA: I linked to Science of Doom because apparently most people at WUWT are unwilling to open any textbooks. Despite being able to get them for free from any college or university library. Or by interlibrary loan from their local public library.
Oh barf, Tom. The elistist, you are all stupid stuff is for the little kiddies in mommy’s basement. I would assume you are above that.
Ian, you really should read that four-part series. Clearly you have not, because you are entirely misunderstanding the mechanism.
Why is this kind of material published here? I see no value in this post.
because the real al gore was getting his chakra released so his understudy came in his place.
Leonard: Je n’ai pas besoin d’assistance ; au contraire, je suis ici pour vous aider.
Both the originating article, and especially this comments thread provide a succinct sample and rebuttal of the climate fraud we know as CAGW. I’ve bookmarked it and archived many of these comments as easily understood examples for the further argumentation, which is surely in our future.
[Disclaimer: I am not a French scholar, but I did sleep in my own bed last night. Alas, alone.]
Lets see, with:
1,347,000,000 cu km – Volume of oceans
1 gigatone of water = 1 petagrams (10×15 grams) of water
Number of grams of water in oceans = 1,347,000,000,000,000,000,000,000 grams
300,000,000,000,000,000 Joules (300Zj) – Energy entered into oceans
It takes 4.18 joules per gram of water to raise the temp 1 Kelvin.
A little conversion journey takes us down this path:
10×3 – 4.180 Kjoules per kgram water kelvin – Amount of energy to raise temperature of 1 kgram of water, 1 degree kelvin.
10×6 – 4.180 Mjoules per 1 Mkg water kelvin – Amount of energy to raise temperature of 1 Mg of water, 1 degree kelvin.
10×9 – 4.180 Gjoules per 1 Gg water kelvin – Amount of energy to raise temperature of 1Gg of water, 1 degree kelvin.
10×12 – 4.180 Tjoules per 1 Tg water kelvin – Amount of energy to raise temperature of 1Tg of water, 1 degree kelvin.
10×15 – 4.180 Pjoules per 1 Pg water kelvin – Amount of energy to raise temperature of 1Pg of water, 1 degree kelvin.
10×18 – 4.180 Ejoules per 1 Eg water kelvin – Amount of energy to raise temperature of 1Eg of water, 1 degree kelvin.
10×21 – 4.180 Zjoules per 1 Zg water kelvin – Amount of energy to raise temperature of 1Zg of water, 1 degree kelvin.
300 Zj is enough energy to raise 300 Zg water 1 kelvin. However, we have just over 4 times that volume of water in the ocean.
With 1,347 Zgrams water, 300 Zj is enough to raise the temp of the water roughly 0.25 Celsius. How is this a concern?
Something occurred to me in reading this article. There has been a lot of talk about “red teaming” climate science, and the attendant issues of wrestling that big a topic to the ground. However “red teaming” the climate models, or at least the major ones, seems doable, and the expertise and even methods are reasonably well understood.
We are expected to base our lives and our economic systems on their output, so why not understand their fitness for purpose? I’m not talking about trying to measure their skill, just their quality and robustness, first of the architecture and code, and second of their assumptions.
An associated effort would be to red team the RCPs. It’s been a long time since those were formulated and particularly RCP 8.5 has caused a lot of unjustifiable mischief.
“Tiger Teams” should analyze both the data and the models. The “adjustment”, “infilling” and “reanalysis” of the data should be investigated in detail. The “fitting” of the models should also be investigated in detail. We’ve seen quite enough of the “magic” of “the man behind the curtain”.
Should a Fed Team / Blue Team exercise occur, neither team should be permitted to make assertions based on data or model code which has not been publicly available for analysis.
The spaghetti graph does convey important information: None of the individual model runs matches the model ensemble mean. That’s because all of the model runs realistically reflect the swings up and down of the temperature that are due to internal variability, in particular the shifting of heating between oceans and air. Most models get the sizes and durations of those swings correct, but most get the timings incorrect.
Weather prognostications and lottery tickets demonstrate the same problem more tangibly.
+1
I can predict with 100% confidence that I can pick the correct sequence of winning lottery numbers. Timing is what always frustrates my retirement in Tahiti.
+2
How do statistical models further our understanding of the science of climate change? Without a more fundamental model of the dynamics involved – which includes water vapor and cloud formation, these statistical models will eventually no longer fit the observed data. Since the alarmist community want to impact political and social behavior 100 years from now, I don’t see this model as very useful.
These models are not statistical models. They are physical models. Here is an introduction: “The Physics of Climate Modelling” by Gavin Schmidt in Physics Today, 2007: http://doi.org/10.1063/1.2709569
….Really ??? ROTFLMAO …..
You should pay attention more closely to what was written in the article above. The author refers to ” The graph uses basic statistics, something too rarely seen today in meteorology and climate science.” Now you may want to pretend that the things they use for models are “physical,” but unfortunately, they are currently incapable of describing all but the most basic influences on atmospheric temperatures. Couple that with the cherry picking of weather stations to represent the global condition and you can see their problem with prediction.
No, no, no, no Pat. Like all good shamans, they want to impact political and social behavior NOW, based on fear of events 100 years from now.
No satellite data, only mangled surface data sets that are not temperature data sets, they are rubbish.
No no no
Not even the RSS satellite data, eh…
The RSS satellite data that shows 1998 only 0.009C below 2016?
The RSS satellite data that shows 2005, 2006, 2007, 2010, 2014, 2015 to be WELL BELOW 1998 ?
You mean that satellite data ?
Again, griff puts foot in mouth and starts yapping !!
As problematic as RSS is, it is at least close to being usable. Unlike the ground based measurements.
Once a data set is “adjusted”, what remains is an “estimate set”. While it is highly unlikely that the errors in the near-surface temperature data set are random, it is ludicrous to suggest that the errors in the “adjusted” estimate set are random.
This article is founded on utter rubbish called science
Larry cites Krugman.
Not a rational report, no matter the many other citations.
subtle,
You should read before making your knee-jerk criticism. Citing Krugman in support of skeptical positions is a powerful argument — something like “admission against interest” in the courtroom.
https://www.nolo.com/dictionary/admission-against-interest-term.html
Cooking surface data sets so they keep the model output relevant, and this is called science?
meanwhile the only data sets worth looking at are left out.
I call nonsense
Ah logic in a box, is not logic
Wait, what does the following (from “conclusions”) have to do with “public policy response to climate change”?
“4. We should begin a well-funded conversion to non-carbon-based energy sources, for completion by the second half of the 21st century — justified by both environmental and economic reasons.”
Advice on theory testing from Paul Krugman? Are they serious? Many feel that he has made a lifetime career out of being wrong.
“A climate science milestone: a successful 10-year forecast!”
Sorry to be a party pooper. But there are two things wrong about this approach.
1) First, can the input data or the results be considered cumulative data series?
The reason is that any two sets of random data, when cumulated over time, will show high correlation–spurious, but very convincing.
Jamal Munshi has a nice video on cross-correlation of cumulated variables. I think the accent is Irish, but Dr Munshi is a professor at a US university.
Munshi, Jamal. “The spuriousness of correlations between cumulative values.” (2016).
https://tinyurl.com/y8sw5luj
2) Statisticians and econometricians warn us that trending time series are also subject to spurious correlation. Which is why Granger and Engle won a Nobel Prize for their work on co-integration.
See this approach applied to climate data:
Beenstock, M., Y. Reingewertz and N. Paldor (2012), Polynomial cointegration tests of
anthropogenic impacts on global warming. Earth System Dynamics 3: 178-188.
URL: https://www.earth-syst-dynam.net/3/173/2012/esd-3-173-2012.pdf
Beenstock, Michael, Yaniv Reingewertz, and Nathan Paldor. “Testing the historic tracking of climate models.” International Journal of Forecasting 32.4 (2016): 1234-1246.
https://pdfs.semanticscholar.org/f298/ca71000425cecf4e25382344a7b6f1662436.pdf
Jamal Munshi has authored many very interesting papers about the correlation (or rather lack thereof) between fossil fuel emission and atmospheric CO2, between atmospheric CO2 and sea level rise, etc.. His work deserves to be reviewed in WUWT.
Someone on here please help me understand some information. The graph on heat content indicates that the heat content of the ocean has gone up 16×10(22) joules since 1990. Now that much joules roughly equals 3.82×10(16) Kcals. The mass of the ocean is estimated to be 1.4×10(21) Kg. That means each Kg has gone up by 2.72×10(-5) degrees Celcius.
This makes me ask a few questions.
1. Conservation of energy. How is it that 16×10(22) joules was transferred into the ocean by Global Warming? For that to happen it had to come from the air. We are discounting the sun, because AGW proponents tell us the sun is not the driver. Where did the energy come from?
2. How is it that our measurement instruments are able to measure the whole mass of the ocean that we can come up with such a determination of a temperature rise of 2.72×10(-5) degrees Celsius? If we use just the mass of surface water to 1000 meters (which is probably what we can really measure), it really messes up the measurements. For that matter, what is the error range on that determination?
You know, I may be looking at this wrong. I have a degree in engineering and had to take 3 physics classes to get it, but maybe someone on here can more fully enlighten me.
Here is one of many places to find an explanation of how atmospheric CO2 causes heating of the oceans: https://scienceofdoom.com/2010/10/06/does-back-radiation-heat-the-ocean-part-one/
Yeah, no, it doesn’t. I saw you post this on another post up thread. It just doesn’t. It gives enough information to make the writer look smart. It just doesn’t touch on the right information.
If CO2 is the cause, what part is attributable to the difference in CO2 from the baseline? Of course even the notion of a baseline is silly, but for the purpose of this question, let’s consider the baseline to be whatever amount of CO2 would not cause the heat content of the ocean to rise.
Oh, and the real question. How does back radiation account for 16×10(22) joules? There has been 8.51×10(8) seconds pass since 1990. That would mean 1.88×10(14) joules per second have gone into the ocean solely from forcing from Global Warming.
HOW IS THAT POSSIBLE?!!!!!!!!!!!!
There are four parts in that series. I pointed you only to Part 1, assuming you could find the other parts by yourself. I guess not. Here is Part 4. At its start it has links to Part 2 and Part 3: https://scienceofdoom.com/2011/01/06/does-back-radiation-%e2%80%9cheat%e2%80%9d-the-ocean-%e2%80%93-part-four/
Really, Tom. Yes I read it all. It is just a series of blog posts that lead up to the creation of a hypothesis c and a Mathlab model.
Still doesn’t answer my two questions above.
I pointed you to Science of Doom because I thought you wanted technical detail. Apparently not. So here is a simpler, briefer, explanation, with references to peer reviewed literature for details: https://www.skepticalscience.com/How-Increasing-Carbon-Dioxide-Heats-The-Ocean.html
The AMO explains ocean warming since the 1990’s, where it started to become positive by the end of it and a frequency increase in El Nino’s. No other explanation is required, removing the AMO from the global trend causes it to flat line. The AMO an effect from the AMOC is linked with global ocean conveyor ending in the Arctic ocean so hugely influences the NH especially.
Simple experiment that shows the difference between LWR and SWR warming small amount of water.
Two identical bucket (5 L for example) with the same volume of water at the same temperature is placed in two different locations outside.
1) One in shade where no sun can reach it all day, but is open to the atmosphere.
2) The other is placed in open area where sun can reach it most of the day.
Record the temperatures hourly and see how the two compare.
You will be surprised to find out the bucket in shade doesn’t warm during one day and the one in the sun warms greatly. Small water volumes are used to find any small changes that oceans or huge bodies of water hide.
This demonstrates the orders difference between the two and LWR fails to over come latent heat at the surface with evaporation.
(Sigh Again. Ok, deep breath.) Now, Tom, the skeptical science post was interesting. The author was positing that the upper skin of the ocean getting warmer lessens the heat transference from the layers underneath which causes more heat to be retained. That explains how the ocean could hold in more heat.
But that still doesn’t answer the question. The only reason that matters is that it keeps the ocean from transferring heat back into the atmosphere (theoretically), but that does not increase the amount of heat actually going into the ocean.
If you have an equation 5x-5y = 1, taking away the 5y does cause the number on the right side to increase to a greater degree (lets call it rate of transfer), but it does not increase the amount of x. X and Y are mutually exclusive.
So that explains how the ocean could retain heat (theoretically), but it does not explain WHERE THE 1.88×10(14) JOULES COME FROM!!
Andrew:
” For that to happen it had to come from the air. We are discounting the sun, because AGW proponents tell us the sun is not the driver. Where did the energy come from?”
No, it did come from the Sun – solar SW.
It is absorbed by deep surface layers of the ocean – which LWIR makes more isolated from the surface emitting skin via a reduction in DeltaT in the topmost few mills. Heat flows better across a large Delta, yes? (2nd LoT).
“Oh, and the real question. How does back radiation account for 16×10(22) joules? There has been 8.51×10(8) seconds pass since 1990. That would mean 1.88×10(14) joules per second have gone into the ocean solely from forcing from Global Warming.”
The Earth is 510×10(12)m2 surface area.
70% is ocean = 357×10(12) m2
1.88×10^14/3.57×10^14
~= 1/2 W/m^2 being retained by the oceans
So 0.5 J/s each m^2 of ocean surface accounts for the 16×10^22 J
Andrew Cooke: The vast majority of the energy entering the oceans is from non-IR sunlight that penetrates that thin surface layer. That energy heats the oceans. But the oceans also lose energy through radiation and convection. CO2 in the atmosphere reduces that loss of energy. Increasing CO2 in the atmosphere shifts the balance of ocean energy gain and loss by reducing the loss. Consequently more energy accumulates in the oceans than is lost. The hotter oceans radiate more energy, so if the CO2 insulation stabilized then eventually the rate of loss from the oceans would increase enough to match the incoming energy from the Sun. But as long as CO2 in the atmosphere keeps increasing, the resulting insulation keeps increasing, and energy in the oceans keeps accumulating.
Toneb, finally an answer I can sink my teeth into. How deep would you say this “skin” of the ocean actually might be? Doesn’t the skin have to be static for this to really matter? When the wind blows does the increased movement cause greater heat transfer? How much heat was released by El Nino?
Other questions. Is it just the water above the thermocline that is increasing in temperature? What about the water below the thermocline? What impact does this have on the Kcals to mass?
Toneb, now for the ultimate question. What is the difference in temperature necessary between the skin and the water under it for it to have enough transference to allow the difference in heat to go back into the atmosphere?
You know the more I think about this, the more I realize how childish the whole explanation is. There are so many problems.
A. Since it is a rate, the loss of transference should cause an acceleration which would mean the temperature of the ocean should be accelerating upward. Yeah. Uh-huh.
B. You can’t use an average and call that as if it is the static universal temperature at a given latitude. Different parts of the ocean are at different temperatures.
Temperature anomalies are supposed to account for that, Andrew. Even using anomalies, look at how Bob Tisdale destroys CAGW SST memes!
https://bobtisdale.wordpress.com/
You know what, I have another question for all you “skin” theorists.
So if the “skin” is warmer, is more water evaporating? Would this not cause more cloud cover?
Since 2006, the Argo program has measured down to 2,000 meters, nearly globally. If you want details on that and other measurements, you can start by reading the references in this recent article: https://eos.org/opinions/taking-the-pulse-of-the-planet. Look in the body of the article to find the relevant references, then look at the reference list at the bottom of the article for links to those articles themselves. It is those articles themselves that have details you are looking for, though if you want even more details you’ll need to follow the references in those articles as well. Or you can go straight to the various programs’ web sites, such as the site for Argo: http://www.argo.ucsd.edu/About_Argo.html
Ah, Argo, Smargo. Just answer the question. How is it possible that 1.88×10(14) joules per second go into the ocean from forcing from Global Warming?
ARGO showed cooling initially showed cooling. This of course was adjusted to show warming. Then SST was adjusted up using water bucket data.
This a political movement (The Cause), not a scientific one.
Andrew Cooke: That was my answer to your question # 2. You’re welcome.
No, it doesn’t. Nice try.
nearly globally.! reminds us how many Agro buoys there are and therefore how much sea area each has to cover , that is where there are any at all .
Globally , well in the sense of being able to measure the weather over the whole area of the Himalayass by having one measuring station 200 miles from one bit of it is ‘global ‘
In the sense that is scientifically meaningful for accuracy being claimed , not even in the same universe let alone global .
Once again climate research ignores confounding factors that in complex systems noted for both millennial, centurial, and decadal cycles, are around every corner. And once again climate research runs with correlation as if it alone is proof of causation.
Will we really benefit from more research to develope mitigation plans? Humans have through lack of common sense, run past any hope of mitigation by creating fragile holds on continental edges. Move inland!
Idiots.
Pamela “we have run past any hope of mitigation”. Mitigation of what exactly? Mitigating SLR for instance which has been rising since 20,000 years ago with no acceleration for 90 years. And mitigation by what means? If 100,000 billion tons of Co2 emitted between 2000 and 2010 did not shake our atmosphere then how much is needed to achieve that end? If Co2 is not the shaker and mover of our climate then what should we mitigate in order to influence our climate to the extent that SLR for example will not continue?
Maybe we should hire Billy Connolly to shout out loud “go away nasty climate change”? Mitigation of reality is not possible, the climate will change, the planet was not designed specifically for human habitation and so like politics its about events. As said how much of what should we mitigate or abate in order to influence the energy of 1 million Hiroshima Bombs every day as exhibited by Hurricane Irma?
Humanity will never ever find the answers to our climate in little black boxes. We have a coupled non linear chaotic climate therefore future climate states are not predictable, we will get what we get and that is a fact.
CO2, not Co2.
Sea levels will likely continue a slow undulating sea level change, some of it up, some of it down, as long as we remain in the current interstadial warmth. So I still say, Idiots.
Here is the latest link to the natural cycles which will effect flora and fauna at continental edges.
http://eprints.esc.cam.ac.uk/3856/1/nature21364.pdf
One more chart for policy considerations.
Come on man. We have already spent billions and billions on ‘climate’ research. There is sufficient information to solve the what causes cyclic climate change in the paleo record, why did the earth warm in the last 150 years, and will the planet warm or cool in the next 5 years?
The answer to what causes cyclic warming and cooling of the earth is the sun. There is a jump up and down change the universe type of breakthrough (changes almost every field of science, new field of physics, and so on) that explains the mechanisms.
You ignore the paleo record and ignore the hundreds of papers that shows unequivocally that solar cycle changes cause the planet to cyclically warm and cool.
The researchers have hidden the fact that changes in planetary cloud cover (the forcing due to the reduction in cloud cover is calculated 7.5 watts/m^2, as compared to calculated 2.5 watts/m^2 due to a doubling of atmospheric CO2, see Palle’s paper) explains all of the warming in the last 30 years.
There are cycles of warming and cooling that correlate with cosmogenic isotope changes (planet warms when the solar magnetic cycle is active and cools when the solar cycle goes into a Maunder minimum) in the paleo record, with a periodicity of 1500 years, with a beat of plus/minus 500 years.
Note the periodicity of the warming and cooling is the same for both hemispheres which rules out solar insolation changes as the mechanism as the warming and cooling is out of phase for the two poles.
http://wattsupwiththat.files.wordpress.com/2012/09/davis-and-taylor-wuwt-submission.pdf
Greenland ice temperature, last 11,000 years determined from ice core analysis, Richard Alley’s paper. William: As this graph indicates the Greenland Ice data shows that have been 9 warming and cooling periods in the last 11,000 years.
http://www.climate4you.com/images/GISP2%20TemperatureSince10700%20BP%20with%20CO2%20from%20EPICA%20DomeC.gif
http://www.agu.org/pubs/crossref/2003/2003GL017115.shtml
Mechanism where Changes in Solar Activity Affects Planetary Cloud Cover
1) Galactic Cosmic Rays (GCR)
Increases in the sun’s large scale magnetic field and increased solar wind reduces the magnitude of GCR that strike the earth’s atmosphere. Satellite data shows that there is 99.5% correlation of GCR level and low level cloud cover 1974 to 1993.
2) Increase in the Global Electric Circuit
Starting around 1993, GCR and low level cloud cover no longer correlate. (There is a linear reduction in cloud cover.) The linear reduction in cloud cover does correlate with an increase in low latitude solar coronal holes, particularly at the end of the solar cycle, which cause solar wind bursts. The high speed solar wind bursts create potential difference between from high latitude regions of the planet and the equator. The increase in potential difference removes cloud forming ions from high latitude regions and the equatorial region which causes changes in cloud properties and cloud duration which causes warming in both locations.
3) Changes geomagnetic field intensity and orientation. Unexplained rapid and cyclic geomagnetic field changes, in the paleo record, have been found to correlate with planetary temperature changes.
http://solar.njit.edu/preprints/palle1266.pdf
Fabius Maximus is wrong here. There is no successful 10-year forecast. And that has two reasons. There are only scenarios in climate research, no predictions.
Unfortunately, none of the scenarios is true. But only the mathematical mean value of the scenarios, which, however, is completely irrelevant in climate research.
The end point of the graphic is cherrypicking. Without the two-year Super-El Nino we would have far lower atmospheric temperatures. A lower increase could also be observed in ocean heat content.
As a prospect of the further development remains only the statement that the Spike in the temperatures by the Super El Nino will be relativized in the next years by the following La Nina and the negative phase of the AMO(C).
Here is a clear sign of why there is global warming. Intellicast is showing that the low for the last 3 nights where I live was 50 F for right now, 48 F, and 60 F. In reality temps are currently 40 F after rising from 36 F this early morning. Yesterday the low was 35 F despite Intellicast showing 48 F, and the night before that was around 48 F and not 60 F. Global warming can be readily seen. …http://www.intellicast.com/Local/ObservationsSummary.aspx?location=USCA0307
You forgot the sarcasm tag
I have never used a sarc tag, but I suppose on occasion I should. Still I have to wonder about why they are not showing the real lows for the night as I have noticed some discrepancies lately.
Don’t take The Cause sarcastically.
Gold,
NOAA’s gnomes are now putting their thumbs on the “raw” data. Book cooking government science has been totally corrupted to the core by the CACA infection.
So climate change really is man made, see?
Something at Intellicast has changed in this year as it was not like this before. I have been using there site almost daily for the last 4 years. Their temps always matched up close enough with my thermometer, and my ability to sense what the approximate temp is.
Intellicast is showing last nights low as 55 F. That is an outright lie. I went outside around 1 am last night as I was up late. The air had a cold bite to it. It was at the least in the very low 40s. A prospector friend of mine who lives in the great outdoors said there was frost on the roof of the local firehouse and some other nearby buildings this morning which did not melt to almost 10 am. So no way that the low was 55 F last night.
Promotion of the multi-model ensemble is bogus science, plain and simple, its use is to be deplored. The average of a multi-model ensemble has no scientific meaning and Larry, not being a scientist, might not realize this fact, but Gavin Schmidt should.
Ocean heat in theory should be a good metric for global warming but can we measure it to be precision necessary? Take the ocean heat chart above and convert Joules to C. now do you think we can measure temperature to that precision and accuracy?
More money for climate science! We have blown way to much money on it over the decades with little to show, let’s burn some more. Larry, your article comes close to saying “the science is settled”, but you do not convince.
It seems as if Fabi (l) us Maximus forgot the sarc / tag. Rarely have I seen such a wretched post on WUWT. He has forgotten the principle of honest science: no mixing of scenarios to make a prediction from scenarios and no cherrypicking.
Excellent points. All ocean heat estimates (Levitus many papers) prior to Argo are just best guesses. The XBT darts had multiple problems and coverage was very poor.
When running a business, Rud, one never allows the person collecting the cash to be the person accounting for the cash. Climate “science” violates that dictum.
Schmidt continues to make the same egregious error of scientific judgement as of the majority of academic climate scientists by projecting temperatures forward in a straight line beyond a peak and inversion point in the millennial temperature cycle.


Climate is controlled by natural cycles. Earth is just past the 2003+/- peak of a millennial cycle and the current cooling trend will likely continue until the next Little Ice Age minimum at about 2650.See the Energy and Environment paper at http://journals.sagepub.com/doi/full/10.1177/0958305X16686488
and an earlier accessible blog version at http://climatesense-norpag.blogspot.com/2017/02/the-coming-cooling-usefully-accurate_17.html
Here is the abstract for convenience :
“ABSTRACT
This paper argues that the methods used by the establishment climate science community are not fit for purpose and that a new forecasting paradigm should be adopted. Earth’s climate is the result of resonances and beats between various quasi-cyclic processes of varying wavelengths. It is not possible to forecast the future unless we have a good understanding of where the earth is in time in relation to the current phases of those different interacting natural quasi periodicities. Evidence is presented specifying the timing and amplitude of the natural 60+/- year and, more importantly, 1,000 year periodicities (observed emergent behaviors) that are so obvious in the temperature record. Data related to the solar climate driver is discussed and the solar cycle 22 low in the neutron count (high solar activity) in 1991 is identified as a solar activity millennial peak and correlated with the millennial peak -inversion point – in the UAH6 temperature trend in about 2003. The cyclic trends are projected forward and predict a probable general temperature decline in the coming decades and centuries. Estimates of the timing and amplitude of the coming cooling are made. If the real climate outcomes follow a trend which approaches the near term forecasts of this working hypothesis, the divergence between the IPCC forecasts and those projected by this paper will be so large by 2021 as to make the current, supposedly actionable, level of confidence in the IPCC forecasts untenable.”
The fundamental error in establishment forecasts is illustrated in Fig 12 from the paper’
Fig. 12 compares the IPCC forecast with the Akasofu (31) forecast (red harmonic) and with the simple and most reasonable working hypothesis of this paper (green line) that the “Golden Spike” temperature peak at about 2003 is the most recent peak in the millennial cycle. Akasofu forecasts a further temperature increase to 2100 to be 0.5°C ± 0.2C, rather than 4.0 C +/- 2.0C predicted by the IPCC. but this interpretation ignores the Millennial inflexion point at 2004. Fig. 12 shows that the well documented 60-year temperature cycle coincidentally also peaks at about 2003.Looking at the shorter 60+/- year wavelength modulation of the millennial trend, the most straightforward hypothesis is that the cooling trends from 2003 forward will simply be a mirror image of the recent rising trends. This is illustrated by the green curve in Fig. 12, which shows cooling until 2038, slight warming to 2073 and then cooling to the end of the century, by which time almost all of the 20th century warming will have been reversed.
The current situation is illustrated in Fig 4
The paper further states
“The RSS cooling trend in Fig. 4 and the Hadcrut4gl cooling in Fig. 5 were truncated at 2015.3 and 2014.2, respectively, because it makes no sense to start or end the analysis of a time series in the middle of major ENSO events which create ephemeral deviations from the longer term trends. By the end of August 2016, the strong El Nino temperature anomaly had declined rapidly. The cooling trend is likely to be fully restored by the end of 2019.”
Schmidt compounds his original error by ending his time series before the effects of the major El Nino on the underlying trend have dissipated .
NORM!!!!!!!
I’m not sure whether you are enthused or horrified by my working hypothesis.
Doctor;
I think that’s just a little “Cheers” humor.
I’ve never understood why Larry Kummer’s missives are posted on WUWT. Clearly, it is a mystery to me and I wonder why, why allow and avow this smarmy globalist activist such street cred?
And the “why” isn’t rhetorical but I guess Larry has convinced Anthony, that he is an impartial activist! ;-(
Scott, I would think that the good side is that it exposes the many flaws in the alarmist argument.
Larry makes us think and requires more than a knee jerk reply. I think Larry is somewhat climate science naive to the machinations of the Gavins of main stream climate science but he is civil and rational.
Item one in the conclusions recommend more investment in the “sciences” of climate. I strongly disagree with pursuing any major investment in so called climate science. I am unable to have any faith in science’s ability to accurately predict any major climatic events. Instead investment I feel should focus on the mitigation of the adverse affects that various parts of the planet suffer from climatic upheavals..
“We have the tools to do so. A multidisciplinary team of experts (e.g., software engineers, statisticians, chemists), adequately funded, could do so in a year.”
If you are lucky to live long enough, you will see the inversion of radicalism more than once. Climate alarmism is the orthodoxy of today, and climate skepticism is viewed as radical in comparison, and I am a skeptic. Occupying the house of the orthodox is no solution, except perhaps as a path to political power.
The claim that a team of engineers, physicists, or mathematicians will establish a V&V solution in a year is farfetched, and that is being kind. There will be at least two tiers of V&V, code compliance and predictive skill. The code compliance part will take at least a year by itself, and the predictive skill part is so subjective that its time line is between 0 and N years, where N is bigger than your political horizon.
It is a request for adequate funding.
engineer,
All large projects being with someone saying that it can’t be done.
“predictive skill part is so subjective that its time line is between 0 and N years, where N is bigger than your political horizon.”
Quite absurd. Model validation is a well-established field, with proven tools. In a year outside experts could provide useful reports about individual aspects of the models and validation data — comparing them with established results in their own fields of expertise.
Models are the ultimate tool of subjective analysis. Keyword. Subjective.
Andrew,
“Models are the ultimate tool of subjective analysis.”
Wow. Quite nuts. I suggest you ask some engineers or experts in other fields about quantitative models.
Like all powerful tools, they can be misused. Just like a chain saw. But that doesn’t invalidate their utility.
No, Editor, it is not nuts. And I am an Engineer. I use modeling software, have taken modeling classes and know the math behind them.
It has been my unfortunate experience that models are a tool that before it is used a premise or notion causes the tool to be used in a certain way. It is very difficult to know all the factors that go into a chaotic system and even more difficult to quantify all the variables that go into a model. The premise or notion then dictates to the user of the model what assumptions to make when the variables are difficult to quantify. The assumptions are, in effect, the subjective view of the modeler.
Simple systems can be easily modeled. Complex systems are……very difficult. The atmosphere of the earth is an exceptionally complex system. The more complex, the more variables; the more variables, the potential assumptions; the more potential assumptions, the more subjective.
The more assumed variables, the less useful the model. Probably the single biggest reason why all climate models appear to be useless.
Editor of the Fabius Maximus website
Heh, that didn’t take long. Your “all large projects” comment is as circular as it gets.
There are no tools, other than code compliance processes, that may be immediately applied to the problem. List one tool that can improve the predictive skill of a GCM that is not subjective, and so incredibly limited that the constraints make it virtually useless as a predictive tool, yet appear to have good fidelity as a curve fitting tool. Too many state spaces that are dependent to have a high V&V score of predictive efficacy. The best tools for parameter/state space management/V&V in GCMs at this time only show “promise,” whatever that means.
While it is true that outside experts may lend insight to the problem, most honest people already know what the problem is. Successful engineering models are highly constrained, and have been verified by observation and experimentation. They tend to blow up when we ask them to crowd the edges. One cannot verify a climate model by experimentation and observation, other than fit to previous data.
Andrew,
“Models are the ultimate tool of subjective analysis.”
If that is so clear, can you provide a cite or two from an expert or textbook — or something — supporting that very broad and definitive statement?
I’ve worked with modeling experts off and on since 1986, with climate scientists for the past several years — and never heard anything remotely like that.
There is a subjective element in models, as in pretty much everything. But that’s quite an exaggeration.Note that weather models have become increasingly accurate predictors of complex systems..With some basis to believe that they are about to make a jump forward in power during the next decade.
Okay. Here’s my question to policy decision-makers:
Why should I pay more taxes for someone to measure outside air temperature and write reports blaming the mankind?
Why is the measured temperature in the graph so dramatically different from the graph FAQ 8.1 Fig. 1 in AR4?
This just proves that the models were used to sense-check the Pausebuster revisions to the surface temperature records. Next.