
by Michael Sandoval July 18, 2017
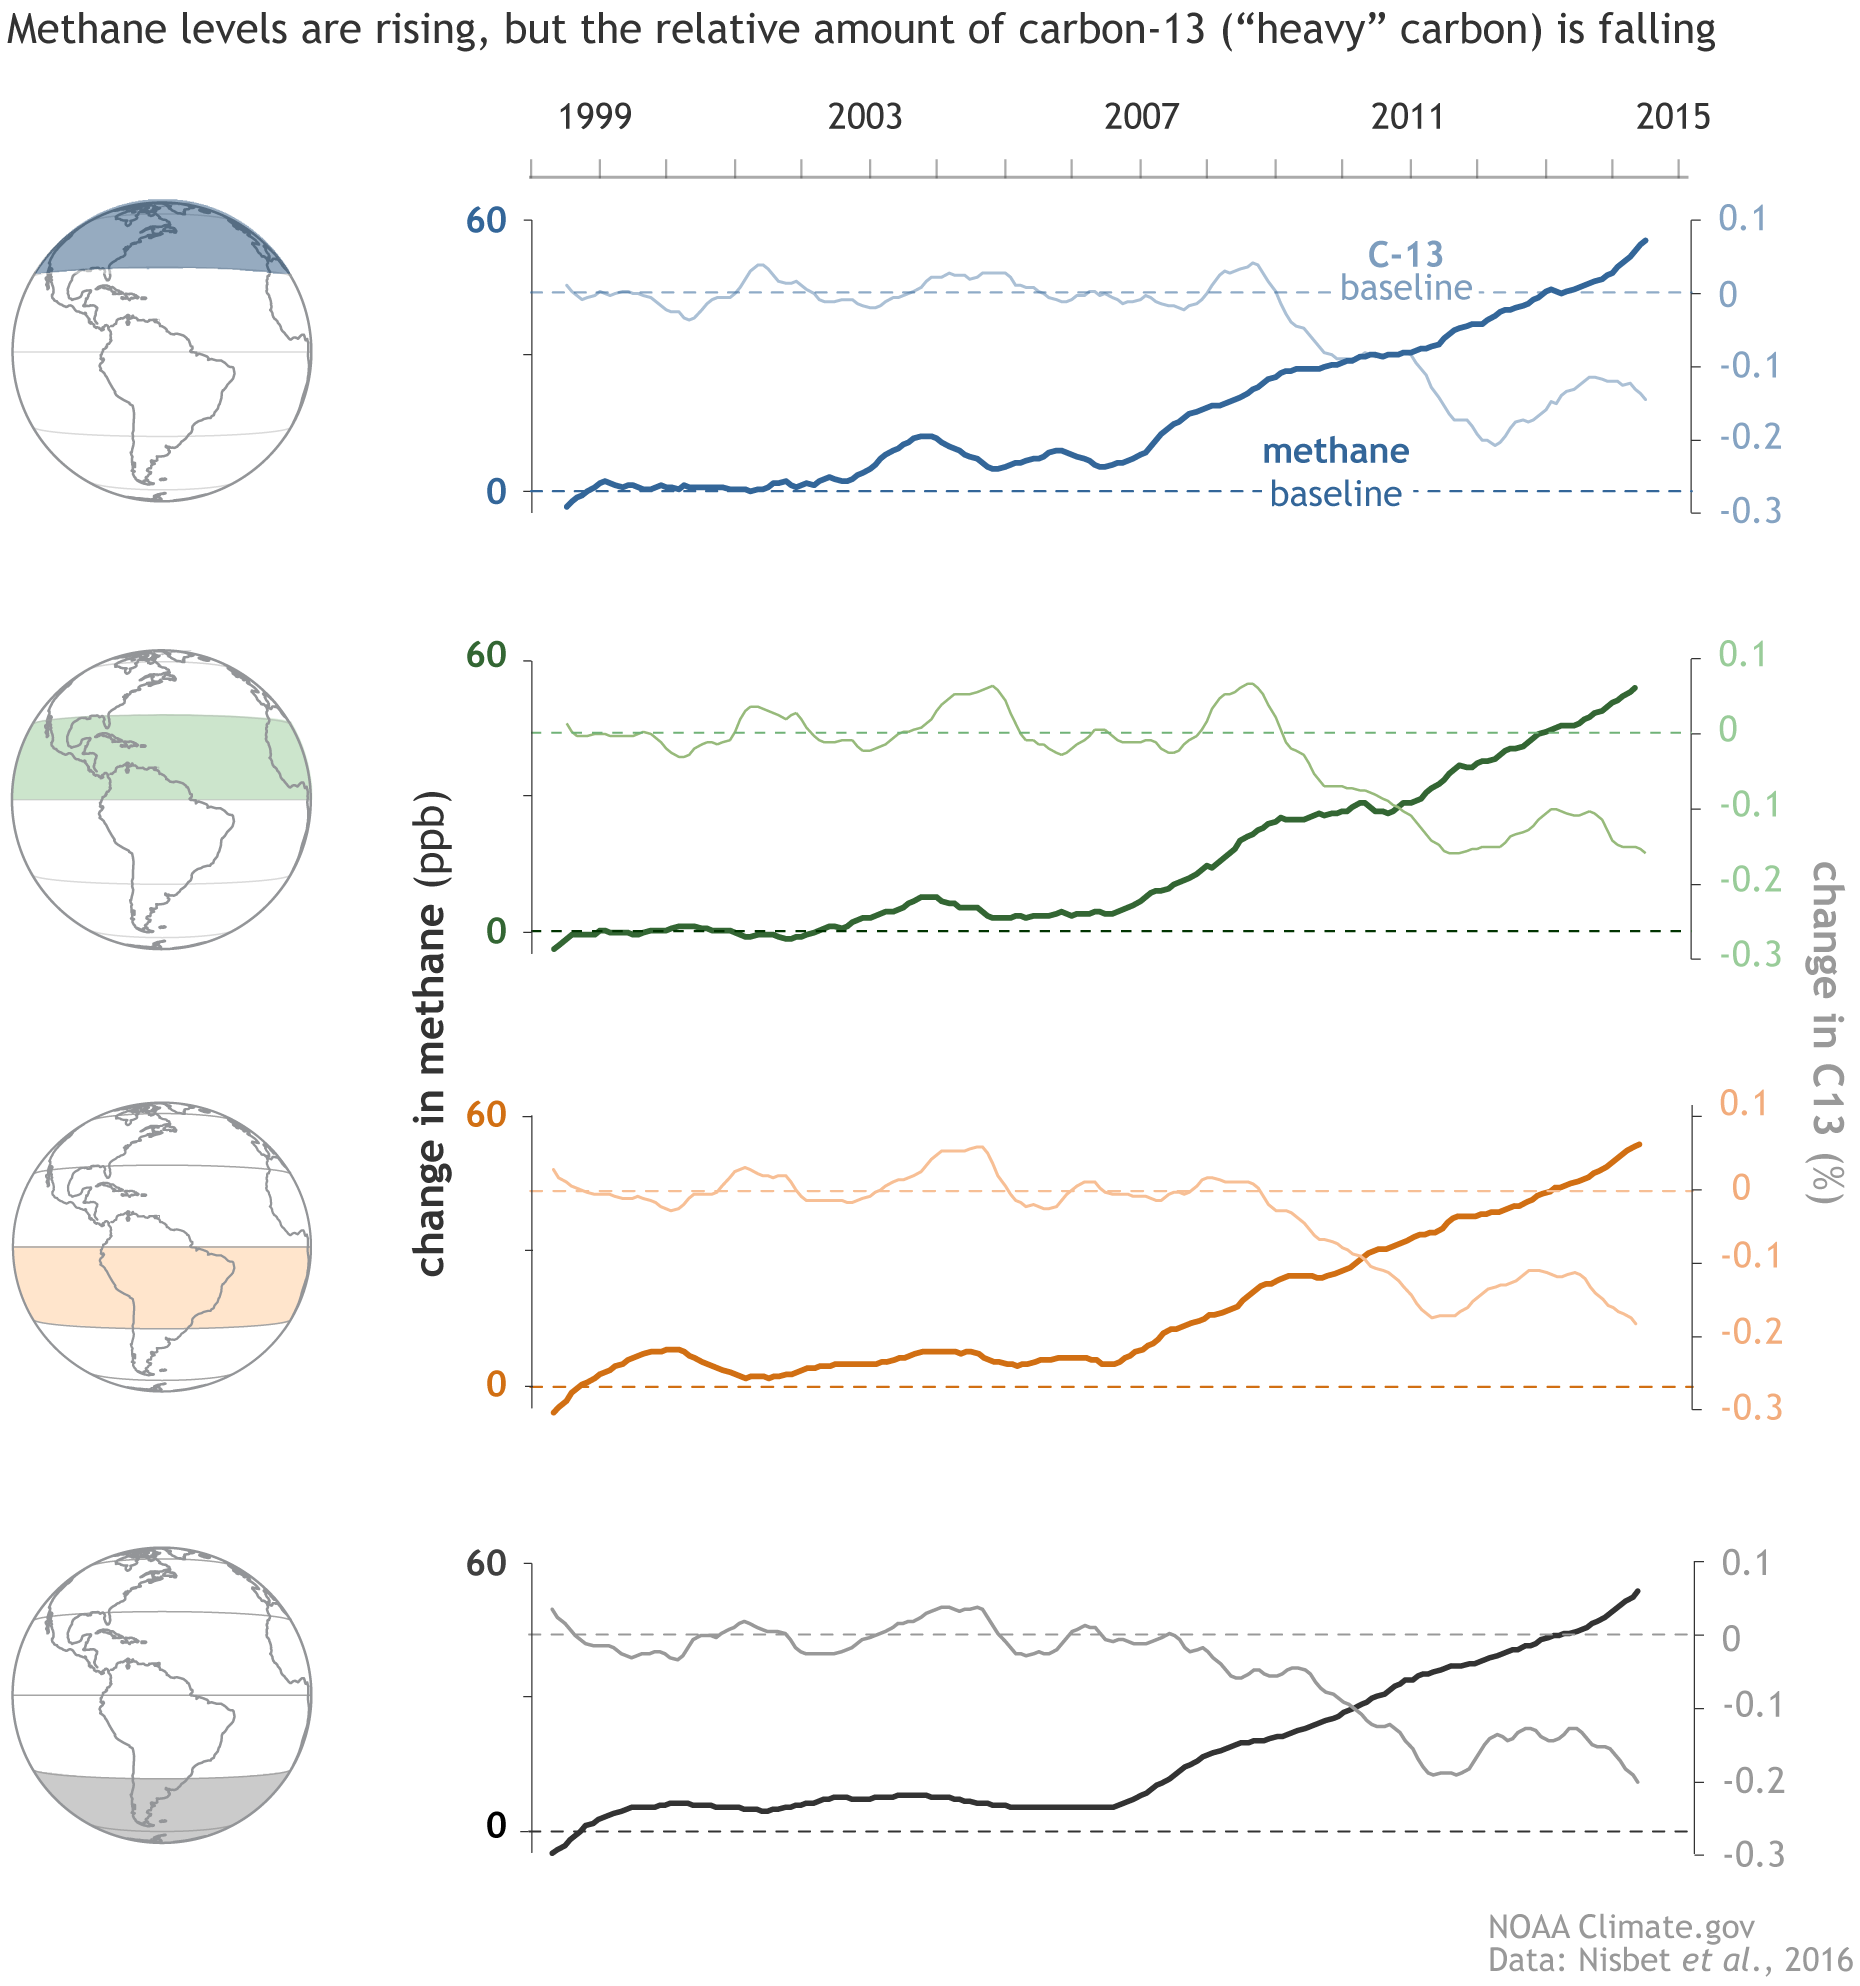
“Agricultural and wetland emissions” from the planet’s tropical areas, not oil and gas activities in the United States, are more than likely responsible for a post-2007 global increase in methane levels, according to the National Oceanic and Atmospheric Administration’s Climate.gov.
But regulating or mitigating those methane sources could be difficult or impossible.
“Both of the likely contenders for the recent increase in emissions could be tricky to mitigate,” wrote Climate.gov’s Rebecca Lindsey and Michon Scott. “In developing countries with burgeoning populations, methane control could wind up pitted against the need to expand food production. If natural wetlands are the main source of the increase, control may not even be possible,” the authors wrote.
According to Climate.gov, following a 1999 to 2006 global methane plateau scientists attempted to explain the rise of methane from 2007 to present, first taking a look at fossil fuel production. Instead of finding evidence that supported a fossil fuel-based elevation in methane levels, scientists discovered that a rare isotope, carbon-13, associated with oil and gas production had dropped “significantly” over the same time frame.
“That [isotope] drop casts doubt on one of the first explanations experts considered for the post-2007 rise: an increase in methane emitted from fossil fuels, including “fugitive” methane gas escaping during oil and natural gas drilling,” wrote Lindsey and Scott. “Instead, the chemical fingerprints point toward agricultural and wetland emissions from the tropics,” they continued.
But a regulatory “impasse” on agricultural and wetland mitigation, according to Lindsey and Scott, “might intensify the need to control emissions from other sources, including fossil fuels.”
“If controlling methane emissions remains part of U.S. climate and air quality policy, NOAA research will help policy makers figure out where to start,” the authors continued.
Stefan Schwietzke, a researcher and methane expert at the Cooperative Institute for Research in Environmental Sciences, a collaborative effort between NOAA and the University of Colorado Boulder, told Climate.gov that attempts to link rising methane levels with the expansion of hydraulic fracturing in the United States over the past decade have produced results that are “counter-intuitive.”
In an email to Climate.gov, Schwietzke explained that his research showed that while methane was rising, the percentage of the methane increase due to fossil fuel production laden with rare, carbon-13 isotopes is falling across all parts of the globe.
“The drop seems to rule out fossil fuel emissions, wildfires, or biomass cook stoves as the reason for the post-2007 methane surge. All those sources of methane, to a greater or lesser extent, are enriched in carbon-13, not depleted,” wrote Lindsey and Scott, saying that, “It’s a counterintuitive finding: methane from fossil fuels is higher than we thought, but it seems to be making up a smaller share of total global emissions.”
With those sources ruled out, Schwietzke wrote, “The decline in the 13-C isotope of methane in the atmosphere indicates that microbial sources must have an increasing share of total methane emissions globally.”
Ed Dlugokencky, a research chemist with NOAA’s Earth System Research Center, says that while the biogenic or microbial thesis is strong, the exact source is unclear, telling Climate.gov, “it seems like methane emissions are increasing most in the tropics and mid-latitudes of the Northern Hemisphere, and we have some ideas why, but no definite answers.”
Talk about “an inconvenient truth”!
or a positive feedback?
“Wetlands” such as rice farms?
We can only speculate on whether or not this report would have seen the light of day under the previous administration. Any one want to bet a mixed case of Sierra Nevada beer (a Chico product) on how long it takes the NYTimes “Science” section or their star climate reporter Justin Gillis to cover this story?
The report would surely have been published. It says “xxxxxxxxxxxxxx might intensify the need to control emissions from [] fossil fuels.”. It matters not one iota what “xxxxxxxxxxxxxx” is, that last bit ensures publication.
… and now an Asheville NC product.
Asheville is also the HQs of NOAA’s National Center for Environmental Information (NCEI), recent home of Tom Karl and Dr Peterson!
Coincidence? I think NOT!
Jus’ sayin’ y’all. 🙂
And then there are the environmentalists seeking to restore wetlands…which would boost methane emissions further.
Environmentally important wetlands were called malaria swamps in a more enlightened era.
Spot on with that comment. Amusingly today’s Times newspaper reports the House of Commons has an infestation of bedbugs which are biting Members of Parliament. Will the environmentalist members of Parliament embrace the return of this form of wildlife/eco-diversity or will they reach for the nearest substitute to brilliantly effective DDT? Well we can all guess that one, actual discomfort or suffering is reserved for the deplorables the minute the eco-elite start to feel any discomfort because of their delusional misconduct.
Glad to see that we agree about the oil and gas
https://papers.ssrn.com/sol3/papers.cfm?abstract_id=2674147
“But regulating or mitigating those methane sources could be difficult or impossible.” I can imagine some government bureaucrats wanting to.
“Drain the swamp(s)”
Sorry, another FakeNews segment brought to you by climate science.
It is most definitely the oil and gas sector and the numbers are directly tied to the price of natural gas. Ie. the cost of capture and plugging leaks versus the value of that gas on the market.
Please source your data instead of arm waving.
You need to check gas prices over the past five years.
Bill’s hypothesis only makes sense with increased natural gas production and depressed natural gas prices.
Natural gas prices collapsed in 2008-2009…
https://www.eia.gov/dnav/ng/hist/rngwhhdm.htm
Natural gas production continued to rise…
http://www.naturalgasintel.com/ext/resources/Daily-GPI/DG2Q2015/Contd/NatGas-Worldwide-Stack-20150610.png
From that perspective it’s plausible; but it doesn’t address the 13C issue.
Here is the overall math. 550 million tons going into the atmosphere each. 540 coming out each year. Net increase 0 to 10 million tons per year (or 0 to 6 in ppb)
Fossil fuel production goes up and down based on the economics of recovery of all the methane/natural gas or just releasing it into the atmosphere about 77 to 133 million tons. This is the biggest range probably. I think those natural changes are more stable than they say.
Fossil fuel production has a range of 60 billion (based on economics and regulations) compared to the net increase of Methane of just 0 to 10 billion.
http://www.globalcarbonproject.org/methanebudget/16/files/MethaneInfographic2016.png
And then watch this movie of Methane levels in the atmosphere over 6 full years, every day snapshot. It will completely change how you view Methane in the atmosphere.
@Bill Illis;
I see you’ve sidestepped David’s observation regarding 13C. Addressing this would strengthen your hypothesis.
D. J. Hawkins.
I answered that below.
The C12 isotope is preferred by plants and algae. Fossil fuels come form plants and algae. Today” s living plants and algae also prefer C12. Today’s plants and algae are responsible for 200 times as much im terms of CO2!as fossil fuels. The math has been ignored by the climate scientists so they keep the believers believing.
Natural gas emissions or today’s vegetation or today’s ocean algae have the same isotopic signature. Where does the change in isotopic signature come from then?
180 gigatons from today”s sources. 9 gigatons from fossil fuels. Therefore, it must be fossil fuels?
Sorry, the whole argument is a complete misdirection which does not hold water. People need to think deeper about every climate science rational. They are all “sounds good” until you bring a skeptical frame of reference to the discussion. Then you say, “is that really true”? Then you say, “Nope that is just a misdirection.”
*listens to the sound of heads rolling at NOAA*
185 ppm methane is less than half the levels of CO2 which is about as close to nothing as you can get. Wake me up if the air catches fire if you light a match.
1.85 ppm?
Correct, Alex, 1.85ppm.
A good paper on this issue (with the same conclusion) can be found here:
http://onlinelibrary.wiley.com/doi/10.1002/2016GB005406/full
The big question is really about the pause – why did atmospheric methane growth stop between about 1999 and 2006.
I don’t really worry about this stuff too much. It’s like some 12 year old boy referring to his penis length increase in ppm. The length is not going to increase his chances to anything, he might be able to get a better grip on himself.
“The big question is really about the pause – why did atmospheric methane growth stop between about 1999 and 2006.”
‘Detergent’ Molecules May Be Driving Fluctuations in Atmospheric Methane Concentrations
http://www.scienceandtechnologyresearchnews.com/detergent-molecules-may-driving-fluctuations-atmospheric-methane-concentrations/
However, new modeling by researchers at Caltech and Harvard University suggests that methane emissions might not have increased dramatically in 2007 after all. Instead, the most likely explanation has less to do with methane emissions and more to do with changes in the availability of the hydroxyl (OH) radical, which breaks down methane in the atmosphere. As such, the amount of hydroxyl in the atmosphere governs the amount of methane. If global levels of hydroxyl decrease, global methane concentrations will increase—even if methane emissions remain constant, the researchers say….
DB
I know you mean well, but the link you referred to is still supposition. The reality is that no-one knows anything definitively. It’s all guesswork, supposition or models. If it meets the media’s requirements, then it will be publicised.
Culling cows due to BSE ;-}
Incidentally, Figure 5 (upper part) in the paper that I reference above demonstrates very nicely the synchronous nature of major changes in trends in atmospheric content, indicating that the different levels of methane content are predominately actual latitudinal offsets rather that delays in mixing. This point is relevant to previous discussions here at WUWT regarding atmospheric CO2, which also shows (in my view) offsets in content from north to south, in contrast to the view that the differences are a consequence of mixing delays.
I was wathing the X-Files the other day, as you do. And creased up when the local yokel said (in a southern accent):
“We don’t have no swamps any more. The EPA has turned them all into wetlands…..”
R
Ha ha ha ha ha ha ha ha ha ha!
First chuckle of the day (-:
Methane is not stable in presence of air. Its sink is a little bit of CO2
Methane is not stable in presence of air. Its sink is a little bit of CO2
Hmmmmm, I didn’t see the usual “Pound for pound methane is 86 to eleventy-seven times more powerful than CO2 and we’re all gonna die” claptrap.
Any discussion of methane needs to be against the backdrop of how much its contribution as a greenhouse gas actually is. At less than 2 ppm with an annual increase of less than 0.01 ppm it’s going to run up global temperatures exactly how much by 2100? The so-called mainstream media never tells us and neither does anyone else.
My crystal ball says less than an insignificant 0.05°C. And if that’s anywhere near correct, The wetlands, tropical agriculture, fracking, cow farts & belches discussion needs to disappear from the headlines. In other words, to use an expression in vogue these days, it’s a nothing-burger.
So, it’s worse than we thought then. If the CO2 doesn’t get us, the methane will. We’re doomed!
As i’m kinda an instrumentation kinda guy , I would be really curious about their sampling techniques. I hope no-one broke wind from excitement when the samples were taken
Since NOAA and other USG agencies have been caught altering data to support a political agenda I have little faith in anything they say.
1850 parts per BILLION !!!
Sounds even bigger if you say 1,850,000 parts per TRILLION !!!
How much more is that in parts per GAZILLION?
It is all in the presentation, just ask Martha Stewart.
Allan, that would be 1.85 micro-Gazillion parts per Gazillion.
(Just to be slightly pedantic as the unit Gazillion is ill-defined.)
Sorry OG – it just does not sound very big when expressed that way.
The trick is to come up with a very big number, to frighten the innumerate.
From now on, I suggest that all large scary numbers be expressed in parts per Centillion*.
* Note:
Centillion reportedly equals 10^303 in civilized notation, but Centillion is reportedly 10^600 in “continental Europe, older British, and French Canadian” notation. No wonder Europe and Quebec are so confused.
https://en.wikipedia.org/wiki/Names_of_large_numbers
I have a question for those out there who will know. Please refer to a decent web page if you have one. I was under the impression that plants prefer C-12 and that for this reason fossil fuel tended to be enriched in C-12, and the atmosphere consequently depleted in C-12 (by very small margins of course). I do realize that C-12 is the dominant isotope. The C-12/C-13 ratios is one of the factors used to point to fossil fuel burning as the cause of the CO2 increase in industrial times. I’m posting a reference to a site you won’t like, but it displays the argument.
http://www.realclimate.org/index.php/archives/2004/12/how-do-we-know-that-recent-cosub2sub-increases-are-due-to-human-activities-updated/
Holes notwithstanding, I don’t think that the explanation is entirely wrong. I have a couple of simple questions. Which is it: Does burning of fossil fuel release C-13 and increase the C-13 fraction or does it release C-12 (due to plant preference for the lighter isotope) and decrease the C-13 fraction?
Also, instead of one of those two choices: Does burning coal release more C-12 (decreasing the C-13 fraction) but burning oil release C-13 (increasing the C-13 fraction). This question is important to me because it might point to different origins for coal and oil. Coal could be fossil and oil and natural gas primordial. In any event, I don’t know the answer. If someone else does please let me know. I am particularly interested in the possibility of different origins between different fossil fuel sources. It also concerns me because the isotope ratio C12/C13 is one of the big indicators claimed for demonstration that the CO2 rise is caused by human activity.
Plants and algae prefer the C12 isotope. As a kind of general rule, coal comes from plants on land (and buried under ocean sediments sometimes but originated on land) and most oil and natural gas comes from algae in the oceans (mostly shallow continental,shelf oceans and productive inland seas, almost everywhere on the planet has been flooded at one time).
Oil and natural gas and coal sources of CO2 are about 9 billion tons Carbon. From plants and algae that historically preferred C12.
But plants living today are a source of CO2 of 150 billion tons Carbon. Algae in the ocean are another source of up to 30 billion tons. These plants and algae also prefer C12.
So WHERE is the C12 coming from??? Obviously it must fossil fuels then say the climate scientists??? What about the currently living plants and algae.
This is what this whole science is about. A proposal is made that SOUNDS good. People say well that sounds good, must be true. But nobody steps back and says is that really true. Can we measure it to be sure. They never take all the steps required.
It appears that the increased 12C component for CO2 in the atmosphere could be coming from ( a few possibilities):
1. burning coal which has more 12C than the atmosphere (I suppose not from burning oil or natural gas. This article appears to indicate that those 2 are richer in 13C than the atmosphere.)
2. volcanic vents on land and in the sea which have more 12C than the atmosphere because it has not been interacting with plants
3. Deep ocean which has more 12C than the atmosphere for the same reason that coal has more 12C than the atmosphere and that volcanic vents have more 12C than the atmosphere.
It looks like the same carbon isotopic arguments that can be used to claim that increased CO2 is primarily due to burning coal can also be used to claim that increased CO2 is primarily from the deep ocean. Of course there should also be some effect in which 13C settles by mass into the deep ocean. I don’t know how big this is. The deep ocean is the largest mobile reservoir of CO2. At least that is how I read a NASA diagram of carbon residence and exchange that I saw somewhere. The location on the phase diagram for CO2 solubility is different in the deep ocean due to the pressure. Removing the pressure suddenly should make it fizz like pop. Is the water in upwelling areas enriched or depleted in 13C relative to the atmosphere? Anybody have a reference on that? Changes in surface isotopic content could either be from CO2 going up or CO2 going down. I am aware that the standard model is that the oceans are currently absorbing, not emitting CO2. But there are many unknowns so if someone has the answer, humor me. The carbon cycle is a pretty complex thing.
Sorry, Forgot to consider your question about 12C coming from currently living plants and algae. Consider the atmosphere prior to the biosphere. Add the biosphere and 12C in the atmosphere goes down relative to 13C. I would guess that an increase in the atmospheric 12C fraction is consistent with a shrinking biosphere and that a decrease in the 12C fraction is consistent with a growing biosphere. Is the biosphere overall growing or shrinking right now? I don’t know the answer, but one drives the atmospheric 12C fraction down and the other up. The relative isotope fractions in this example apply only to carbon isotopes in CO2.
Gas production was found to be mostly hydrogen sulfide (H2S) in brackish marsh, dimethyl sulfide in saltmarsh. DeLaune, R. D., I. Deval and C. W. Lindau. 2002. Flux of reduced sulfur gases along a salinity gradient in Louisiana coastal marshes. Estuarine Coastal Shelf Science. 54(6):1003-1011. Gas emissions of methane decrease towards salt water, but that of sulfur increase. Odum, W. E. 1988. Comparative ecology of tidal freshwater and salt marshes. Annual. Review Ecology Systematics. 19:147-176. There is also a paper somewhere about seasonal variation.
There’s only one answer…shrink wrap the wetlands.
That is interesting. It looks like the buried methane is trapped gas that has not interacted with plant life and so it retains a higher 13C content and when released by drilling activities increases the 13C content of CH4 in the atmosphere. CH4 produced by bacteria comes from decay of organic matter that has preferentially trapped 12C. So release of CH4 from drilling has relatively higher 13C (no plant processing to decrease the 13C from the original source) than CH4 from bacteria. Coal on the other hand has depleted 13C because of the isotopic preference of some plants. Methane is short-lived enough in the atmosphere that a source change is quickly noticed. This indicates at least the possibility that whereas coal is a fossil fuel, methane may not be a fossil fuel.
Even if there is no human activity, methane is an integral part of our environment. It is present in swamps, in our oceans where it is ejected by black smokers and cracks in the ocean floor. However the amounts are so incredibly small that I really wonder how the they can determine the cause of these “contaminations”. I really think it is going along the same lines of stellar research capabilities that point to humanity as the cause of all evil in regard of Co2 emissions. The entire subject is simply too insignificant to justify even a single minute of our time. Sorry.
Here in Oregon, there are great pains taken to preserving wetlands. Entire housing structures and roadways built around them.
Although – just an unrelated sidebar – I saw in the news (with all the appropriate bed-wetting) that an OREGON court just declared the ‘fossil fuel infra-structure’ ban unconstitutional.
For a moment, I thought I was reading ‘The Onion’, but apparently it really happened.
I’m not so naïve to believe the greenie wave might be receding here in the beaver state – probably, it’s more of an accidental aberration to be corrected immediately – but I’ll take it.