Guest essay by David Archibald
Back in late April, European wine growers were hit by the most damaging frost since 1991. That frost affected vines as far south as Tuscany. More recently it is the western Corn Belt that has been affected by late Spring frost. The following two figures show damage to crops from frosts a few days ago:

Figure 1: Chickpea crop in Saskatchewan just north of the Montana border, 27th June 2017 (image source Mike Foley, yellow is frost-killed dead plant material)

Figure 2: Frozen corn just east of McLaughlin, South Dakota, 27th June, 2017
(image source Joel Bierman)

Figure 3: South Dakota Spring frost incidence 1974 – 2003
As Figure 3 shows, the majority of frosts for McLaughlin are usually over by mid-May.

Figure 4: U.S. Drought Monitor
Warmer is wetter and colder is drier. In a cooling climate there will be a concommitant reduction in moisture available.

Figure 5: Spring Wheat Futures
The reaction of the wheat market has been a 50% increase in price over two weeks. That has geopolitical implications, as shown by the following graphs.

Figure 6: Percentage of personal budget spent on food
This is a graphic made in 2010 using data from 2009. At 6.9 percent, the United States has the lowest percentage of disposable income spent on food of any major country and will be hardly affected. But most countries spend between a quarter and half their income on food. A rise in the budget allocation to food, driven by the prices of wheat and other grains, will result in a reduction in economic activity.

Figure 7: Imported grain and domestic grain production in the Middle East
The Middle East lost the ability to feed itself from its own production decades ago. Even countries as large as Egypt live a hand-to-mouth existance. Egypt recently sold off a couple of islands in the Red Sea to Saudi Arabia in return for Saudi funding of the Egyptian budget, and thus grain imports. On average, humans get about 48 percent of their calories from grains. Wheat, with the best amino acid profile of the major grain crops, is a near-complete foodstuff for those not allergic to it. Tunisia has wheat consumption of 80 percent of their calorific intake. We know from the raid on Bin Laden that his household visited the local bakery three times a day to buy bread. The wheat price rise has geopolitical implications.

Figure 8: F10.7 flux 2014 – 2017
Where to from here? Relative to the climate of the last century, an F10.7 flux above 100 causes warming and below that level causes cooling. As of today, the F10.7 flux is 71, not far above the activity floor of 64. Solar minimum is three years away and then we are likely to have at least two years of activity below 100 as activity rises into Solar Cycle 25. Thus some of the heat that built up in the second half of the 20th century due to the highest solar activity in 8,000 years will have a chance to radiate into space. Late spring frosts will become more frequent.
David Archibald is the author of American Gripen: The Solution to the F-35 Nightmare
We just had a cold morning too in Victoria. Nice day, though.
Nick
We have just had our coldest june 28 for some 139 years. Mind you, we also had the hottest June day since 1976 and May was also one of the warmest on record and the winter before last was the warmest in the entire CET record…apart from one in the 1850’s.
No, I am not sure any of it is meaningful either, other than to demonstrate that there is more natural variability than many realise, which Phil jones confirmed in his 2006 paper on the extraordinary cold winter of 1740 which came hard on the heels of the extra ordinarily warm 1730 decade.
It’s all very confusing. I think we need to pour billions into some sort of programme that examines climate change. Do you think it might catch on?
Tonyb
sez who ? Can you prove that ?
Maybe David could apply for some of that money on the basis of putting eyeballed straight lines at spurious places in a graph.
The technique seems to involve picking a couple of high spots and joining them up. This then leads the viewer into making the same spurious conclusions as the author about rates of decline etc. If he could convert this into an Excel formula that any untrained idiot ( like M.E. Mann ) could use, I’m sure it would be rapidly adopted in climatology.
Well worth funding.
It is not all that confusing, and you do not need to go back to the 1700s to see years with record warmth and cold.
In the US during the 1930s, several years had brutally cold winters and blazing hot summers.
The winters were also noted for some fierce blizzards, and the summers for relentless and widespread drought.
With the exception of the blizzards, the explanation could be a simple one…drier air cools off faster at night and warms up far more rapidly during the day than moist air.
And the drier the air, the more pronounced the effect.
“I am not sure any of it is meaningful…”
In the past, we just called it “weather” and moved on, trying to save food during good times to get us through lean times. Today, we deny that any deviation from some established “normal” could possibly be natural, and always, always blame it on human-induced climate change.
Menicholas:
Absolutely, it is called enthalpy Low enthalpy (dry) air needs far less thermal energy for each degree rise in temperature. Whereas High enthalpy humid air needs a lot of thermal energy to rise in temperature.
It is probable that the entire temperature increase (and variations) being measured is due to a drop in relative humidity.
Hottest days .. coldest nights .. that’s what clear skies deliver, so maybe there is less cloud cover. But we don’t know, because the latest global satellite cloud data is from 2009. I find it extraordinary that we get all sorts of satellite data by the day or hour or minute, but we have had no cloud data for over 7 years. [Or maybe I just can’t find it – if anyone knows of any more recent gridded or similar global cloud data, please let me know.]
Ian W: Humid air, if it is clear (relative humidity less than 100%), takes about the same amount of heat to warm up a given extent as dry air. Maybe a percent more when the air is very warm and very humid, because gas molecules with more than two atoms have 9/7 the specific heat (at constant pressure as opposed to constant volume) as diatomic gas molecules.
Hubbert Lamb proposed that as the planet cools the Jetstream would become more disrupted and more volatile. Maybe we are seeing that but at the moment its just weather.
“I just can’t find it – if anyone knows of any more recent gridded or similar global cloud data, please let me know.]
I’ve spoken about it many times.
https://airs.jpl.nasa.gov/
https://airs.jpl.nasa.gov/data/products
https://disc.gsfc.nasa.gov/AIRS/documentation
https://airs.jpl.nasa.gov/data/physical_retrievals
You can use it to debunk the nonsense about GCRs
again, it is probably larger than anything you have ever worked with so be prepared to spend a long long time
It’s rather complicated especially if you dont know HDF format, there are some specialized R packages that may help you,
http://rankexploits.com/musings/2014/berkeley-earth-airs/
Hottest day – at Heathrow, FFS. Anyone who has been there on a hot day knows that tempreature measurements in that vast area of concrete, tarmac, cars in motion and planes in motion knows that it is meaningless to use Heathrow as a gauage of anything bar the gullibility of the public.
And Phil Jones, eh? “They’ll kill us if it’s all down to natural variability”, or some such words. Aye, hoarding piano wire already.
Menicholas states:
Ian W, referring to the above, states:
Mike Jonas states:
I am with Ian W on this, and I often point this out when people talk about clouds and their alleged warming effect.
I spend a lot of time in Southern Spain over the summer. Usually a cloudless night is a warm night, whereas a cloudy night is a cold night. I have suggested that the reason for this is humidity.
Cloudless nights usually follow a cloudless day and on the shores of the Mediterranean, the sea evaporates and there is high humidity which is carried through to a cloudless night. During the late afternoon, the typical temperature can hit a high of about 34degC, at midnight it may be 30 to 31degC, and even at about 3 am, it may well be 27 to 28 deg C, with temperatures only falling away after 4am. It is then cool in the morning even at about 10:30 am. The day takes a long time to warm up.
By contrast on a cloudy night, the day often clouds over in the afternoon, and the day temperature may reach 32 degC, by about 23:00 hrs the night temperature may be down to 25degC, and by 1 am down to about 23 degC. On these days there is a lot less humidity.
The temperature profiles of these days are very different,. On either side of the shores of the Med (Spanish side on the Northern shore, and Egyptian side on the southern shore), the dominant factor controlling temperatures, particularly at night, is not clouds but humidity. If one looks at the same cloudless summer night skies in this area, the night time temperatures are warm, but go 100km further south inland to the Sahara desert, the night is cold. All are experiencing the same cloudless skies, but each area has a very different temperature profile and the dominant factor is humidity.
Humidity inhibits the Northern shores and Southern shores of the Mediterranean getting too hot during the day, and keeps the night time temperatures high, whereas under the same sky conditions the Sahara with its low humidity gets very hot during the day, but cold at night.
PS. There is also a sea breeze that plays a part in limiting daytime highs, and the breeze usually dies down at night which also helps the night time temperature to hold up.
PPS. Last night was a cloudy night, and I needed a jumper by about 11 pm, whereas the night before was cloudless and I was out until about 3:30 am in just a T shirt.
The ‘hottest June day since 1976’ was classic Met Office / BBC misinformation and what many people would call a lie. The claimed temperature was measured at Heathrow Airport – a site so contaminated by external heating and urban heat island that it should never be used as part of any temperature record. The next highest temperatures were measured at Northolt – which would also be at an airport – and Kew. These readings match a level set in 1995.
Refershingly cool week in southern France after a very hot previous week.
KNMI’s Geert Jan Von Oldenburg has just published a “study” claiming that the hot early June was made “ten time more likely” by global warming.
SO I assume that this last unusually cold week was also ten times more likely to be cold due to global warming,
He does a good job running the KNMI climate explorer web site but has just lost all credibility as an objective scientist with this ridiculous CAGW crap.
Geert Jan , weather is NOT climate.
Climate is the average of weather.
I think the one thing we can be sure of is that any extremes of weather will be seized on by alarmists ten times more surely than regular average weather.
I think that hot June was made about twice as likely by global warming, maybe as little as 1.5 times as likely, not 10 times. The globe has been warming less than predicted by the CMIP5 climate models. Recently got close to CMIP5 mean briefly during an El Nino spike according to a Karlized version of NASA GISS.
As for that map of South Dakota with date ranges of 25% chance of frost afterwards: The 30 year period this applies for is 1974-2003, which looks oddball to me. I wonder why not 1971-2000 or 1981-2010? This has me suspecting cherrypicking. And what about for 10% or 5%? I remember the 1992 frost/freeze disaster in southern New Jersey May 1992. Atlantic City officially dipped down to 28 on 5/21 at the ACY airport, and the temperature got much lower in inland agricultural areas.
For that matter, in the early 1970s most seed packets with maps showed the northern and western suburbs of Philadelphia as not being safe to plant many seeds until May 15th, and around Washington DC to Atlantic City and maybe Center City Philadelphia (warm there) being safe to plant on May 1st. And I remember a family in the Germantown section of northwest Philadelphia saying it wasn’t safe to plant or transplant outdoors tomato plants outdoors until Memorial Day.
I know Nick, that global warming is a strange beast. Maybe we should wait till summer so you can tell us how hot it is given your super powers of observation?
On the central tablelands of NSW its been ‘chilly’ and the locals take note when it falls below -6, but the real talking point around here is the lack of winter rain.
As you are probably aware this is a direct result of the intensification of the subtropical ridge, a global warming signal writ extra large. Why is BoM not crowing? It was their meme in the first place.
Please explain how on your planet the subtropical ridge intensifies as a result of a fourth CO2 molecule out of 10,000 dry air molecules? Thanks.
Strengthening of the subtropical ridge is in no way, shape or form indicative of CACA, as you baselessly assert. It’s from a completely natural oceanic and atmospheric oscillation.
This April 2015, actual climatological paper, free of CACA cant, explains how it works quite nicely:
http://journals.ametsoc.org/doi/full/10.1175/JCLI-D-14-00569.1
Recent Intensification of the Western Pacific Subtropical High Associated with the East Asian Summer Monsoon
They use models to test their hypothesis, derived from data.
No value in shooting the messenger, you should talk to Dr Timbal at BoM. This is what they were sprouting in 2009.
http://www.smh.com.au/national/its-not-drought-its-climate-change-say-scientists-20090829-f3cd.html
Grose et al explain their reasoning for the intensification.
https://www.climatechangeinaustralia.gov.au/media/ccia/2.1.6/cms_page_media/472/Grose%20etal%202015%20AMOJ%2065%202.pdf
Keep in mind this was back in the day before the hiatus was acknowledged and they had no inkling of the massive model failure to come.
I am not sure of the exact location of the central tablelands, but every climate map i have ever seen shows the part of NSW away from the coast as a desert. Which I am guessing makes the part nearby but not classified as desert not exactly the wettest place in the world all the time.
Dry years and wet years my friend…twas ever thus.
It is not even unusual…it may be that most years are either kinda of dry or kind of wet…no?
Gabri
CO2 possibly acts in the same way that water vapour does in that it collects together to form discrete clouds and then has a catastrophic local effect
/sarc off
Menicholas there isn’t a desert on the western side of the Blue Mountains, we are on the fringe of the Murray Darling Basin, with agriculture and grazing.
Australia’s weather has to contend with natural variables like ENSO and IOD, it hasn’t been this dry around my way within the living memory of the locals.
So is there anyone out there who can prove the intensification of the STR is a cooling signal? If not, then I’ll assume the science is settled.
Ironicman: The intensification of the STR sounds to me like a weather event, possibly related to Antarctic sea ice setting a 1979-onward record low only ~2.5 years after setting a 1979-onward record high. Weather has always been sometimes getting wacky, and often even getting into ruts of wackiness lasting even years somewhere or somewhere else. For one example of wacky weather in North America, how about Hurricane Hazel of 1954? Please note what Hazel did and where, widespread wind records and spotty rain and flood records still standing, including hurricane-qualifying sustained wind all the way along the east side of its inland track from South Carolina to around 110 km north of Toronto! And please consider what a storm like that would be blamed on if it happened now. What about the storm Agnes of 1972, taking a track similar to that of Sandy of 2012, and some flood records and rainfall records from Agnes still stand?
Gabro: Regarding “fourth CO2 molecule out of 10,000 dry air molecules”: Are you claiming CO2 is so greatly a trace gas that the increase from 280 to 405-410 PPMV doesn’t matter? How is this reconciled with arguments that CO2 is so powerful that its infrared spectral effect was already saturated when it was at 280 PPMV so increase above that does not matter?
You raise a good point. If we do go into an extended period of cool globally this probabably implies an extended period of la nina like tropical ssts and therefore subtropical ridging across Australia and drier S Australia. i.e drought.
Donald K. the high pressure belt has intensified and is situated too far south for this time of year, its bigger than weather.
pbweather its fair to say that during the LIA there were more La Nina, but at the moment there is no indication that is happening, with super El Ninos and few La Nina we remain above the line.
http://www.drroyspencer.com/wp-content/uploads/UAH_LT_1979_thru_May_2017_v6-1.jpg
Donald,
if the temperature of this planet is controlled by the amount of so called GHGs in its atmosphere, and the so called non GHGs such as Nitrogen, Oxygen, Argon are not responsible for its temperature, why is there no (or all but no) measurable GHE on Mars?
On a numerical basis, Mars has about 10 times as many CO2 molecules in its atmosphere as does planet Earth in Earth’s atmosphere. There are about 10 times as many CO2 molecules absorbing and re-radiating photons on Mars, and yet there is no discernible GHE on that planet. It does not appear that CO2 molecules are doing very much on Mars; perhaps because the effect (if any at all) is saturated when there are only a few molecules of CO2 in the atmosphere.
Whilst considering that point, perhaps you might like to explain the mechanics as to how a photon radiated from a molecule of CO2 in Earth’s atmosphere is subsequently absorbed by another molecule of CO2, and then re-radiated by that molecule and then subsequently absorbed by another molecule of CO2 such that the photon can gradually make its way downwards in the form of propagated DWLWIR, given that each molecule of CO2 is separated from another molecule of CO2 by some 9,996 molecules of non radiating/non GHGs.? How does the process actually work on a molecular basis?
“There are about 10 times as many CO2 molecules absorbing and re-radiating photons on Mars, and yet there is no discernible GHE on that planet.”
Because Mars has negligible water vapor and methane, which contribute 75% of the GHE on earth.
“how the photon can gradually make its way downwards in the form of propagated DWLWIR, given that each molecule of CO2 is separated from another molecule of CO2 by some 9,996 molecules of non radiating/non GHGs.?”
The photon does not interact with non GHG. It just passes through them. If it makes you wonder, it’s the same process how light is transmitted through a transparent material like glass or water.
“How does the process actually work on a molecular basis?”
I’ve posted this in Judith Curry’s blog about a year ago. The mathematical derivation of the GHE from the equations of particle physics. I’m too lazy to look for it 🙂
Thanks your comment. I will have a look on Judith’s website.
Water vapour is allegedly a more potent GHG not because of its radiative qualities per se, but rather simply because there is far more water vapour than there is CO2. On Earth, I would suggest that water vapour plays a significant role not because of its alleged GHG/radiative characteristics, but rather due to its properties of latent, specific heat and the role it plays in the transfer of sensible energy.
However, as regards water vapour and methane, in reality there is very little of these gasses in Earth’s atmosphere. Thus for example, water vapour whilst it is not at all well mixed, and varies from trace to about 4%, it has an average of only about 0.4% over the entire volume of the atmosphere (at sea level the average is about 1%). methane does not even register on the scale (only about 0.000179%)
Materially, if you were to remove all non GHGs from Earth’s atmosphere and count only the number of molecules of CO2, water vapour and methane in Earth’s atmosphere, there would still be far more molecules of CO2, water vapour and methane in the Martian Atmosphere.
I emphasise that on an actual molecule for molecule basis, physically and numerically there are more molecules of so called GHGs in the Martian Atmosphere, than there are in Earth’s Atmosphere. Nonetheless, there is no discernible GHE on Mars.
Water vapor = 0.4%, CO2 = 0.04%. Water vapor is 10x more than CO2. Methane on earth = 1.79 ppm, on Mars = 0.01 ppm. Earth has 29,000x more methane (adjusted to 1 bar pressure). Earth has more greenhouse gas molecules
GHE is nonlinear. If we increase earth’s CO2 by 10x (like in Mars), temperature will increase a bit more than 3 C without positive feedback. Ave. solar insolation on Mars = 148 W/m^2. From Stefan-Boltzmann law, the equilibrium temperature = 226 K (-47 C). GHE not enough to warm Mars
Thanks your further observations. The details set out below are only an approximation, not corrected for molecular weight, but are sufficient as a ball park indicator since we are only discussing principle, not precise quantification.
The Martian atmosphere weighs about 25,000,000,000,000,000 kg of which some 96% is CO2, ie., about some 24,000,000,000,000,000 kg of CO2 (24 x 10^15 of CO2).
By comparison Earth’s atmosphere weighs about 5,148,000,000,000,000,000 kg of which some 0.04% is CO2, ie., about some 2,059,200,000,000,000 kg of CO2 (~2 x 10^15 of CO2).
Thus one can see that the Martian atmosphere has nearly 12 times as much CO2 when compared to Earth.
Water vapour is alleged to be a less powerful GHG compared to CO2, and even if one takes account of the fact that Earth has 0.4% water vapour, this provides a further 20,592, 000,000,000,000 kg of water vapour (rounded up to ~21 x 10^15 of H2O).
The Martian atmosphere has trace amounts of methane and water vapour, but all the trace gases amount to only about 0.3% of the Martian Atmosphere, but even ignoring these trace gases, it is clear that the amount of GHGs (on a molecule for molecule basis) are broadly similar to Earth (24 x 10^15 kg of GHGs on Mars cf 23 x 10^15 kg of GHGs on Earth), and yet there is no discernible GHE measured on Mars.
The 24 x 10^15 kg of CO2 on Mars does not appear to be doing anything of significance, WUWT?
The calculations are wrong. The gas percentages are by volume not mass. The stratosphere is 5x larger by volume than the troposphere. Almost all water vapor is in the troposphere where GHE occurs. 25x more H2O than CO2 in lower troposphere. Methane is 87x stronger GHE than CO2 and effect is nonlinear (strong even though small amount). Earth has stronger GHE plus 2.5x higher solar insolation than Mars.
Your latest comment does not counter the issue raised, namely: The 24 x 10^15 kg of CO2 on Mars does not appear to be doing anything of significance, WUWT?
As I mentioned, the calculations are ball park figures, not corrected for molecular weight, since such corrections are tinkering at the edges, eg., molecular weight of CO2 is 44 and Oxygen gas is 32. No big deal. We are not talking order of magnitudes.
You state:
Yet the GHE is by how much a planet’s temperature is enhanced over and above the solar irradiance received. Thus, it matters not that Earth receives 2.5 times the solar irradiance. It would not matter if Earth received 10 times, or a quarter of the solar irradiance since all we are interested in is the enhancement over and above solar irradiance received. The fact is that there is no measurable GHE on Mars notwithstanding the vast amount of CO2 molecules in its atmosphere..
You state:
I do not know where you get that figure from. It is certainly not the accepted/consensue view (a figure of 20 to 25 times is often bandied about), it is not the figure set out in table 3 of the K&T 1997 paper, still less is it the indicated response according to MODTRANS, viz:
You can see from the MODTRAN simulation that methane is a stronger GHG than CO2, but not by that much. The material point being is that there is all but no methane in Earth’s atmosphere (only 1.8ppm) so it only contributes a few percent towards the alleged GHE seen on Earth.
Water vapour is a less potent GHG compared to CO2, however, the most significant GHG on Earth is water vapour, and this is because of its volume/amount of water vapour compared to other GHGs in the atmosphere. Mars on the other hand has about 960,000 ppm of CO2; about 96% of its atmosphere is made up of a far more potent GHG, ie., CO2.
I am not sure of the point that you are trying to make about the stratosphere and troposphere. If anything, this is a point that ought to amplify the GHE on Mars compared to Earth, since the radius of Mars is approximately 1/2 that of Earth such that the surface area of Mars is approximately 1/4 of that of Earth. This means that the GHGs in the Martian atmosphere are packed far closer together than the GHGs are in Earth’s atmosphere such that it is much easier for the emission and absorption of photons to take place in the Martian atmosphere. It is much more difficult for a photon emitted from a molecule of CO2 in the Martian atmosphere to make its way directly out to space without encountering another molecule of CO2 than is the case on Earth.
On Earth, since there is broadly the same amount of GHGs (although mainly composed of a weak GHG, namely water vapour), the GHGs are far more spread out such that the chance that a photon emitted by a GHG can make its way out directly to space without encountering another molecule of GHG is significantly greater in Earth’s atmosphere than compared to the position in the Martian atmosphere.
Here in Campbell River BC we had to have our fire on in the evenings on a few occasions during June.
We have a good hard frost here in Victoria right now, trees covered with it. Yesterday it was -5C according to DD. I haven’t checked today but must be at least down to that. It is winter however!
I’m in the Fraser Valley. So far besides that one hot weekend, it’s been seasonally mild. I am expecting this berry season to be another great harvest. My property is surrounded by blackberries. They seem to be a week or 2 behind schedule. Very cool damp spring
This is not Victoria, B.C., I’m guessing? It rarely sees -5 in January. Cool and dry in Saskatchewan. We’ll be lucky not to have crop losses from drought. I’ve been saying it’s like the 70’s. Complete with windy weather as was more common back then.
Been seeing the same in central Indiana for the beginning of the summer.
https://wattsupwiththat.com/2017/06/29/toxic-waste-from-solar-panels-300-times-that-of-nuclear-power/#comment-2538426
Nick, all sarcasm aside, what little evidence we have based on inaccurate and highly imprecise paleo records (see Marcott et. al. “A Reconstruction of Regional and Global Temperature for the Past 11,300 Years”, Science, VOL 339 8 MARCH 2013) very clearly shows a declining trend in temperature. If you’re really interested in climate, you may want to look at it.
The fact Marcott and friends chose to join low resolution, low precision data with high resolution instrument records to “put a scare” in the general population notwithstanding, his paper should be a wakeup call to cAGW alarmists; the Earth is very clearly entering a new ice age and if CO2 does play a role in reducing natural cooling, we ought to pull out the stops and start burning stuff like there was no tomorrow, because if the cooling trend continues, there won’t be.
If folks want to worry about something, at least they should worry about something that could actually kill billions of people and destroy modern civilization. Or is that the desired outcome?
What ever made you think he was anything else?
well yes it was sunny in part, however it struggled to reach 10c out SW.
and my rain tank is down to 1/3rd its only 1k gallon and my entire water supply.
so?
considering the almost nightly frosts and little to no rain..I am worried re the coming summer and how i will have water to drink feed animals and wash.
cold is dry and not good.
I just got back from a week in Sooke. Weather was fantastic.
right.. that is before homogenization and other adjustments.
If he is talking Victoria, Australia that is a whole State. Rutherglen is in Vic; the place that BOM had fun adjusting a cooling slope to make it a warm one. So suggest he waits til BOM makes adjustments and will find the Temps more to his liking.
Well Wine Growers in areas where frosts can occur, usually know about spraying the vines during a freezing Temperature spell.
I once owned some vineyards in California, and each 80 Acre area had a central one Acre Lake, fed by ground water pumps, that was activated when the air Temperature got down below freezing.
I forget what the safe Temperature was before the grapes freeze, but if you spray ground water that is about 68 deg. F from the lake with pump replenishment, you can keep the grapes from freezing for many days.
You have to be careful to not overspray so too much ice stays on the vines; but the California Growers know how to do all of that.
I have a house well that gives me 68 F water, and if I let just one faucet drip a little during a freeze, I can prevent the pipes from freezing down to about 14 deg. F air Temperature outside.
For the pedants, 68 deg. F is +20 deg. C or 293.16 K (or izzat 273.15 ??)
G
Were all gonna die!
Try that again:
We’re all gonna die!
Anthony: We need a comment editor. Typos kill humor.
how about we were all gonna die ?
Carbon tax is the solution. It won’t actually stop you from dying, but it will make dying look a whole lot more desirable.
A carbon tax levied upon your death would be 19% by weight.
We all died in 2008 when the oceans boiled! James Hansen said so!
Hansen did a damn good job of predicting the future of the global climate back in 1988. Who else wishes they could have predicted the future with similar precision.
What did Hansen predict in 1988, and what happened since then so far? I wouldn’t call that a “damn good job”. I reference https://skepticalscience.com/Hansen-1988-prediction.htm which is an argument in favor of climate sensitivity of 3 degrees C per 2xCO2 while attempting to explain why Hansen’s predictions fell short. What SkS did not do there is explain why 3 degrees C per 2xCO2 is correct, especially since IPCC’s AR5 which leans to about 2.5 degrees C per 2xCO2 and backs off from saying what’s most likely, and notable recent studies saying around 1.5-1.6 degrees C per 2xCO2.
Another thing notable: Climate sensitivity decreases as global temperature gets more towards “snowball Earth” or “ice-free earth” than it was during the rapid fluctuations of the Pleistocene ice age – which we have to consider as possibly still in progress.
So this is what being dead feels like?
I always wondered.
Hansen has always been a Catastrophist mouthpiece. Don’t forget that, in the late ’60s, he was predicting the oceans were going to freeze over from Catastrophic Global Cooling. De-industrialization was deemed the only way to reduce emitted SOOT (the original Carbon Menace) which was supposedly blocking the sun. Turned out, he was fooled by the 1940-1970 cooling trend. When it became obvious the planet was no longer cooling, he revised his story slightly. It’s always been about “carbon.”
shomer shabbos dude!
shomer shabbos!
There was reporting of an unusually cold summer in Australia and New Zealand this year, so a general cold spell seems to be possible.
And the All Blacks have also just had a player sent off for the first time in 50 years while failing to score a try in a home defeat. There is something weird going on, without a doubt.
I love rugby. However, my favourite is Aussie rules. It was very popular in Canada back in the 80s. On TV every weekend. Haven’t seen it since.
Is it still popular in OZ?
@Mick – Aussie Rules in the 1980s was a sport. It’s not a sport any more. It was taken over by a ruling clique who awarded themselves multi-million dollar salaries. Many traditional club supporters can’t afford club membership, let alone game attendance tickets. They now have gay and lesbian support matches and pro-apartheid matches. It’s just not interesting any more.
Mick:
If you enjoyed the game in the 80’s then you would really love it now. It is just so much faster by comparison. The players need to be super fit.
It still is the most popular winter sport in Oz with a national league which now includes Queensland.
Two teams even played their match game in China recently.
Not only that but Emirates Team New Zealand had a clean sweep of the Americas Cup races going in Bermuda, but on the next to last leg of the sixth race, with NZ handily in the lead and on their way to the mark, when suddenly the Aussie skipper of ETNZ decided to start sailing backwards, and go and chase Oracle to try and crash into them. They almost copped a proper course penalty, but in the exchange, Oracle ended up ahead, and ETNZ lost a race they had in the bag.
I’m pretty sure that was the same Aussie who was the tactician in San Francisco, and handed Oracle at least a couple of wins with lousy match racing tactics.
But the All Blacks not even getting a try !?
Well there was that scoreless draw in the 4th test match against Dr. Danie Craven’s Springboks in Wellington; I think that was in 1936 or thereabouts. And we still ain’t forgotten when Wales beat the 1905 All blacks, in Cardiff, due to a referee’s incorrect call. (Wales did deserve the win though.)
G
Maybe Julia Gizzard’s carbon tax on motor fuel and “kill the camels to stop them farting methane” programs were effective to offset the millions of tons of coal mined in Australia and shipped to China to be burned into Carbon Dioxide.
If it gets bad enough the Vikings will abandon Minnesota.
This time the Norwegians (and Swedes) were smart. They colonized MN at the end of the LIA, or very beginning of the Current Warm Period, instead of in the middle of a warm period, so benefited from naturally warming temperatures.
Soft white wheat was also up about 30 cents in Portland, OR yesterday, but still only $5. OTOH, we had a very wet spring and June, thanks to El Nino, breaking the drought. Yields should be good.
The winter was cold, but the worst of it came after dormancy and snow cover, and the melt occurred without major washing. Early cold is the killer, or snowlessness.
A buddy of mine who makes wine in the Walla Walla Valley was practically wiped out by November cold a few years ago. Other vineyards planted at higher elevations optimistically during the late 20th century warming have been wiped out.
Do you have any idea what effect that will have on the price of Wheat Thins?
https://youtu.be/B1Vcbm-XWtg
Price won’t change. They’ll become Wheat Really Thins!
Frosted Wheat Very Thins?
I remember the “coming end of maple syrup” more than a decade ago. Then cocoa about 7 years ago.
Aah yes, the Great Maple Syrup Panic.
Those were terrible times…terrible times indeed.
Every pancake tasted like the last one on Earth.
Well you can make all the maple syrup you want out of corn, and not have to butcher Maple trees.
Why else is Vermont ??
G
Thus some of the heat that built up in the second half of the 20th century due to the highest solar activity in 8,000 years will have a chance to radiate into space
This is fake news. The last half of the 20th century has not been that extraordinary.
http://sidc.be/silso/yearlyssnplot
Outdated?:
Top: Reconstructed sunspot activity (10 year average) for the last 11,400 years based on C-14 data (blue curve) and the directly observed historical sunspot data since 1610 (red curve). The reliable C-14 data ends around the year 1900 so that the sharp increase in sunspot activity in the 20th century does not appear in the graph. The reconstruction shows clearly that a comparable period of high sunspot activity previously existed over 8000 years ago. Below: An enlarged section of the upper graph (hatched area) with several episodes of higher sun activity; comparable to the 20th century.
© Max Planck Institute for Solar System Research
Of course, the sun’s power grows by about one percent per 110 million years, but that wouldn’t be noticeable in just 8000 years.
Here is Dr. S’s graph:
http://sidc.be/silso/IMAGES/GRAPHICS/wolfaml2.png
Dunno about 8000 years, but 20th century still looks sunnier than the 19th and 18th centuries, and presumably 17th, 16th and 15th, as well, during the LIA, to include the Maunder Minimum and prior minima.
I Would be interested to hear from Leif if he believes that a snspot reconstruction that far back has any sort of credibility?
Tony,
The Max Planck reconstructors must think it does.
yes, outdated.
The sunspot number before AD1610 is derived from the cosmic ray record.
See slide 6 of http://www.leif.org/research/The%20long-term%20variation%20of%20solar%20activity.pdf
Hey Gabro, you found yet another hockey stick
Right. So it’s not sunspot activity that’s not cooling the climate.
Bryan,
Observations of sunspots laid over 14C observations is not even remotely comparable to attaching thermometer “data” onto dubious tree ring proxies, the nonconforming series of which were hidden by trickery.
I would have thought the distinction to be obvious.
” 20th century has not been that extraordinary”
According to recently “Adjusted™” data. !!
According to the cosmic ray record, e.g.
http://www.leif.org/EOS/2009GL038004-Berggren.pdf
“Recent 10Be values are low; however, they do not indicate unusually high recent solar activity compared to the last 600 years.”
The revised [and more accurate as past mistakes have been corrected] sunspot record agrees with that.
Except that it never happened before, and it won’t happen again.
g
Fake news has a tendency to crop up again and again…
Plenty of rain and relatively cool temperatures here in the Southern Ontario region has some people worried about this year’s hay crop. Hay needs hot dry weather for harvesting.
Hay may need hot dry weather in southern Ontario but here in Britain we get lots of sort of non weather and it seems to do pretty well most of the time
Tonyb
Hay needs hot, dry WX after cut in order to dry without molding in the fields.
Britain does not have the need for hay that some other places do because there is not a long dry or cold season in which grass does not grow.
Menicholas: When we were living back in England there was lots of hay and silage being cut and baled. Hay most definitely is needed for the winter and silage is very popular with cattle!
http://www.fao.org/ag/AGP/AGPC/doc/Counprof/britain/unitedkingdom.htm
I can’t imagine growing hay anywhere in England, t must be nerve wracking. When I raised alfalfa/grass hay in WY, deciding when to cut was always a crap shoot, you could never tell when a thunderstorm system would just blow up on top of you and ruin it efore t was dry enough to bale. I only lived in England for a couple of years, and in the south at that, but I can’t recall a time I would have felt safe drying hay there.
Annie,
I should have spoken more carefully.
Like some others here, the process for making hay that I am familiar with would make it hard to do in a place famous for not having a lot of dry weather.
But the reality is likely not as bad as I imagine.
But what i meant to say was…there are places that must have hay…lots and lots of it, and they do not have a lot of time to make it. And very long dry/cold seasons to get through.
My mental image of England is a place that is green year around, and it rains nearly every day.
But I know it snows there, and is frequently on the chilly side, even in Summer, no?
I can tell you this…if I was from there, I would have done just what I did having been born and raised in Philadelphia…moved my butt to Florida!
Here in SW Florida we have what i consider sane weather…a long dry season that is mostly in the warm to hottish range, with some cool nights and sometimes a cool day, and a several months long rainy season, where it starts out sunny every morning, grows hot as the surface of the sun by afternoon…and then rains torrentially for a few hours and then clears up to start the cycle anew.
It’s been pretty close to the limits this year. Here’s an article from London. Folks there are just at the limit of when they can plant corn and soy. I’ve heard from farmers in other parts of the province that they’re going to fallow some of their fields because they don’t think it’s safe to plant anything.
Look at the predictions for NOV-DEC 2019! We may see some significant glacier growth in the next few years. http://www.swpc.noaa.gov/products/predicted-sunspot-number-and-radio-flux
Figure 6: Percentage of personal budget spent on food
Venezuela = 200%
Oh the joys of socialism!
The Bible suggests a seven year supply of grain. A family of four needs 1200 pounds a year. link Times seven that’s around four metric tons. At around two hundred bucks per tonne that’s less than a thousand bucks at today’s prices. No problem.
At 0.75 tonnes/m^3 that’s five and a third cubic meters. That’s a problem.
Whatever the price, if it doubles, that is a problem for some people, and a windfall for others.
The wheat in a loaf of bread costs about 15 cents at todays price on the Minneapolis Exchange.
The cost of energy has far more to do with the cost of food than the price of grain.
Beans. Much more useful than grain. So much for the Bible.
Almost all beans are from America. Fava beans are I think the only exception. The Columbian Exchange is a good source.
You miss the point all together. Grain is unique among commodities because it is not existing.
Next years grain crop is just a dream in my head so maybe its a good idea to store some?
In 1964, Mao said “Take grain as the key link.”
You need both legumes and grains to get the amino acids our bodies can’t make.
In Eurasia they had lentils, soy, mung and garbanzo beans, as well as fava beans.
And peas and nuts, of course.
Dear Mr. Archibald,
Just as the term “pause” is an inaccurate description of the STOP in warming,
so too, it is not accurate to say, given the short time of this putative cooling:
“Thus, it begins.”
All we non-omniscient humans can ever say is:
“Thus, it began.”
3 cheers for your enthusiasm and dedication in the battle against the AGW fiends.
Janice
P.S. If anyone wonders why I am not responding or commenting on WUWT, my laptop totally crashed. I’ll be back when my new laptop arrives — in about 2 weeks.
No. I CAN’T STAND TYPING ON THIS PHONE.
Bye for now. #(:))
I noticed and I wondered. I thought you might be one of the temporary Mods and was restraining yourself.8-)
Janice…three words:
Speech to text.
Just hit that little microphone icon on the edge of your keyboard.
But I agree…phones are terrible for commenting. The worst part is that the preview part of the screen is way to small, and there seems to be no way to enlarge it.
Testing speech to text.
What’s new? The pause continues.
Or is that paws?
Gonna: Aretha arrrgh! I – – can’t — stand it! That was SUPPOSED to be “Gunga”: arrrgh (at “Gonna”) !! Thank you for the salute.
Nicholas: Thank you for the advice and sympathy. OK. I will now try VTX:
Nicholas, I am still praying you and Josephine find each other exclamation point:-)
Now I will speak more quickly hey that’s pretty good
Now I will talk really quickly amazing it today well almost
end VTX
Oh, brother…. not bad, but I MUCH prefer typing. Bye! 🙂
Clip colon, is stop capital S capital T capital oh capital p laughing laughing laughing
roaring laughing…..@janice
Latitude colon, YouTube me too!! Hey at least I got it to do an exclamation point that time but why did it say YouTube when I said me too Gir grrr
It works almost perfectly if you speak like a robot.
Which makes sense…machines understand their own kind better.
Seriously…try it. Speaking in a robot voice makes it work pretty much flawlessly.
The only drawback is the silly feeling you get speaking like a robot into your phone, and then looking up and seeing that someone is staring at you… looking like they are deciding whether they ought to call a mental health professional for you.
It will do periods and commas, but you have to say the word period or comma quickly.
I have never figured out how to make any other punctuation, or go to the next line, or anything like that.
But I bet if you look it up it is easy to find out.
h, yeah…also exclamation points and question marks.
Colons and semicolons it does not seem to do.
But you gotta proof it…some of the mistakes it makes are can be epically embarrassing.
Alas, I fear their will be no sequel to The Tale of Menicholas and Mejosephine!
But thanks.
I have recently come to the conclusion she may have given me a fake name!
What I spoke
What time is it..question mark..new line..9 15..new paragraph..Next question
What showed
What time is it?
9
Next question
Hi, Nicholas,
Lol, yes, in my first STT attempt above, I spoke like I was talking to someone who barely speaks English. STT has its place, but it is much too “clunky” for me. I will give it this, though: it makes far fewer and MUCH less bizarre mistakes than the plain text typing code does.
Yesterday, in a text to a girlfriend, it changed “aaarrgh” to: “Stretch.” Go figure….
Oh, Nicholas, I am so sorry at the forlorn state of affairs with your Josephine. God knows who she is, her real name. I, thus, will continue to pray…. God also knows whether she is His best for you. Thus, I will also pray that, if Josephine is not “her,” that God will make your path cross (SOON) with “Josephine,” i.e., “her.”
Don’t laugh. :). “With God, ALL things are possible.”
Thanks for taking time to talk to me.
Janice
I wonder what happens if you use Victor Borga’s Phonetic Punctuation?
@Janice. See if it spells Global Warming as Climate Change!
“Now this is not the end. It is not even the beginning of the end. But it is, perhaps, the end of the beginning.” Winston Churchill
Read more at: https://www.brainyquote.com/quotes/quotes/w/winstonchu163144.html
Janice
Poor baby. We miss you.
PS (see, I’m learning from you) why 2 weeks to get a new computer?
Thank you, Mr. Haven’t. JAVERT! That was the text only correction. Now let’s see what the voice to text does to Javert cool it did it right!
2 weeks because it wasn’t in stock at my local Best Buy and because it costs less to ship on a regularly scheduled delivery day.
http://www.gatesnotes.com/Health/The-Best-Investment-for-Improving-the-World
Bill, as I said, you may soon be able to get funds to finance your health initiatives that were previously allocated to global warming hysteria. The bad news is that we will probably see evidence of global cooling by 2020. We also published that prediction in 2002, our only one that is yet to materialize. Sadly, global cooling will probably reduce lifespans, especially for the elderly and the poor, as implied by our recent paper on Excess Winter Mortality.
I hope to be wrong about this prediction – I can live with being wrong, much more than we all can live in even a slightly cooler world.
http://wattsupwiththat.com/2015/06/24/uk-met-fastest-decline-solar-activity-last-ice-age/
The UK MET office has published a study which suggests solar activity is currently plummeting, the fastest rate of decline in 9300 years. The study also raises the odds of Maunder Minimum style conditions by 2050 from 8% to 15 – 20%.
Naturally the MET thinks that anthropogenic forcing will overwhelm the cooling effect. In the context of farcical model predictions of anthropogenic warming of up to +6.6c by 2100, which the MET still officially treats as serious science, a degree or so of cooling, due to a lull in solar activity, might not seem a big deal.
Nevertheless, the fact the MET have raised the risk of significant global cooling from their 8% estimate, produced in 2010, to 15 – 20% is intriguing. The MET assures us however, that any reprieve from global warming will be temporary – potentially leaving open the option of running global warming scares, in the midst of brutal little ice age style winters.
The MET paper is entitled “Regional climate impacts of a possible future grand solar minimum”
http://www.nature.com/ncomms/2015/150623/ncomms8535/full/ncomms8535.html
I wrote about the structured retreat of global warming alarmists as in 2013 – and possibly earlier.
The latest Met Office announcement is one more step in that structured retreat.
We knew decades ago that global warming alarmism was wrong. We confidently stated in 2002:
[PEGG, reprinted in edited form at their request by several
other professional journals , the Globe and Mail and la Presse in translation,
by Baliunas, Patterson and MacRae]. Until recently our paper was available at
http://www.apega.ca/members/publications/peggs/WEB11_02/kyoto_pt.htm
On global warming:
“Climate science does not support the theory of catastrophic human-made global warming – the alleged warming crisis does not exist.”
On green energy:
“The ultimate agenda of pro-Kyoto advocates is to eliminate fossil fuels, but this would result in a catastrophic shortfall in global energy supply – the wasteful, inefficient energy solutions proposed by Kyoto advocates simply cannot replace fossil fuels.”
I suggest that our two above statements are now demonstrably true, within reasonable probabilities.
I also wrote in an article in the Calgary Herald published on September 1, 2002:
On global cooling:
“If (as I believe) solar activity is the main driver of surface temperature rather than CO2, we should begin the next cooling period by 2020 to 2030.”
Regards to all, Allan
The UK MET office has published a study which suggests solar activity is currently plummeting, the fastest rate of decline in 9300 years.
There is no reliable evidence for that.
“no reliable evidence ”
Yeah, but this is “climate science”.
Reliable evidence does not seem to be required before grave pronouncements are made.
Phrases like “seems to be” apparently cover even the most exposed butts.
In 2000, one of the UK Met office’s top poobahs told the world that our children and grandchildren would never, evahhh, see snow again.
Based on the past 17 years, there is no reliable evidence to back up that prognostication either.
Let’s assume (pretend) the MET is correct for once. In that event and if you believe solar activity has anything to do with global temperature (hard to think it isn’t in there somewhere), the man-made warming industry will have to find a new way to make a living. Anyone wish to bet against “man-made global cooling”? I can see mandatory trash-burning pits in every backyard and “lists of shame” for solar panel users (whose homes will eventually have become “toxic waste” problems in any event).
Leif, agreed.
I’ll believe it when the electric streamers of the K corona do not appear during a total eclipse, and all you get is a dull reddish ring of the F corona.
Reference:
The Maunder Minimum, John A. Eddy
http://www.odlt.org/dcd/docs/john_eddy_Maunder_Minimum.pdf
Scroll down to “Absence of Corona” on the 9th page.
Lots of folks will be disappointed when and if the corona goes away, if they travel all the way to Timbuktu to see the eclipse. But for this year’s eclipse, the corona was good & bright last year (Indonesia, March 10), and is hanging in quite nicely on satellite imagery.
BTW, the K corona is million degree electrons lined up along the sun’s magnetic field, while the F corona is sunlight reflecting off dust particles.
Best eclipse in the US since the early 1970s coming next month…coast to coast, right across the center…Salem to Charleston with a couple of minutes of totality. Longest duration will be in southern Illinois.
The wait after that is not as long…April 8th 2024. That one will run a path almost perpendicular to this one, and cross it’s path not far from the point of greatest eclipse.
Imagine living there!
Now imagine if it is cloudy both days!
Doh!
Oh…here:
You have to love this from the MP paper:
“The researchers around Sami K. Solanki stress the fact that solar activity has remained on a roughly constant (high) level since about 1980 – apart from the variations due to the 11-year cycle – while the global temperature has experienced a strong further increase during that time.”
May I suggest an experiment to the distinguished authors of that paper. Take a tea kettle and name it “earth”. Then place the tea kettle on the stove which you have named “sun”. Turn the gas on the stove up to a constant “high” level. Record the temperature in the kettle over time. Then turn the gas off. Again record the temperature over time. You will note that the temperature experiences a further strong increase during the time that the gas is on and a further strong decrease during the time the gas is turned off. This is called accumulated enthalpy of the fluid increasing and decreasing. I also suggest that they note that the coldest day of the year is not the shortest day of the year, but rather comes a month or two later. The same may be said of the hottest day of the year. The thermal inertia of the earth’s surface takes a while you know. But somehow they had to play the game that the sun could not have done it, now didn’t they. Bah!
It will be interesting to see how long it will take for the earth to chill down now that the flame is on low. It will also be interesting to see if the AMO goes away if the resonance is not pumped with the 80 year solar cycle. Maybe the solar hypothesis is wrong, but I suspect not. We are running the experiment as we speak, like it or not.
For these reasons I have some doubt that the frosts mentioned are a direct consequence of lower energy injection by the sun. But as always, I could be wrong.
Turn the gas on the stove up to a constant “high” level. Record the temperature in the kettle over time. Then turn the gas off. Again record the temperature over time. You will note that the temperature experiences a further strong increase during the time that the gas is on and a further strong decrease during the time the gas is turned off.
The word ‘further’ makes the statement meaningless. Are you saying that when the gas in on, the temperature increases, and when the gas is off, the temperature decreases?
Keep’em honest Leif!
You have a working “perfect knowledge” of the real-life solar cycle warming/cooling principle!
SC24 cycle influence added 0.6C to Had3SST from 2008-2016, ie ‘the gas (TSI) was on high’, driving temps higher before dropping after the gas (TSI) has turned ‘low’.
The modern maximum in solar activity was a 70 year period when sunspot activity was 65% higher than during the previous 70 years; 108.5 from 1935-2004 vs 65.8 from 1865-1934.
Same principle.
The modern maximum in solar activity was a 70 year period when sunspot activity was 65% higher than during the previous 70 years
Just shows that there are long-period variations. The group number 1935-2004 was 5.50, for 1721-1790 it was almost as high: 5.05. What do you think the temperatures were during those two periods?
@Lief. Quite frankly, yes. But you must admit it is more physically based than the claim by the warmistas that the temperature of the kettle increases with brand A of tea being brewed in it and does not when you brew brand B. Obviously, I could have made all sorts of much more complex analogies and stuck all sorts of math into the process. I was trying to provide an analogy that might even be intelligible to Al Gorge and Pwince UpChuck. (No offense made to CTM). Sadly, in some of the folks I have run into, the concept of a phase lag in a storage system is a foreign one despite being surrounded by such systems in their experience.
A tea kettle and a stove may not be the preferred apparatus to mimic the “thermal inertia” of the Earth.
Note that this phenomenon takes place on a daily basis as well as an annual one.
And water has a great deal more “thermal inertia” (not sure if this is physically accurate terminology) than land or air. Even modest size ponds having cold water at the bottom that is still warming at the end of Summer.
I strongly suspect the oceans are still warming up from the temps they reached during the last glacial advance and melting cycle.
It’s a little more complicated than that because the shortest day of the year in the Northern Hemisphere has the Earth at perihelion and late winter (Northern Hemisphere) has the Earth moving farther away from the sun. Which is receiving about .5 Watts/M**2 less energy each day.
Of course it is more complicated that that, but I am trying to dumb the thing down to the level where even a “climate scientist” can understand it. Lief not withstanding, the gripe is with the attempt to decouple the sun from the increasing temperature. Further, he has apparently missed the point of the comment. But that is ok, it is a free country for a while yet.
So, this is a buy recommendation for wheat futures?
@jeanparisot,
“So, this is a buy recommendation for wheat futures?”
It is not a buy signal. There are many silo’s waiting to be emptied. Wheat sitting on the ground…still. Maybe in a couple of years, if this persists.
Cliff
Wheat stored on the ground in my town is starting to be moved out. In part to make room for the coming harvest, but also to take advantage of a possibly brief spike in prices, which are still below cost of production.
My original thought, and I actually researched it. The current projection is that although some areas experienced weather difficulties, more acreage of wheat has been planted, and total production should be about the same as last year.
I guess we need to factor in that in that the additional carbon dioxide in the air increases the yields, and allows drier climates to grow crops like wheat. I wonder how the carbon dioxide levels compare now versus the last time the solar cycle was this weak.
Having the price double is a strong :you missed the boat’ signal.
After such a move, there could be further movement in the same direction, a snapback rally, or a consolidation period.
If the bidding was overdone, prices could tumble.
If there is more bad weather, this could just be the start.
But in general, if you are talking about market moves after an event, it is too late. That event is now priced in, and the move it triggered has been accounted for in the futures price.
But I should not have to tell you this…if you do not know these things you had best not be betting on grain futures.
I was loaded up with corn and wheat calls back in the late 90s. Prices were at historical lows. Droughts and low harvest had no effect on prices. No volatility even. I lost thousands. I don’t trust fundamentals when trading commodities. It only works after the fact. A day late and a dollar short.
Only look at the chart. Look at a 20 year history of wheat prices and decide when to go long. Use calls or puts to reduce your exposure to margin calls
Interesting to look at the inflation adjusted charts…price in 1973 is over $27 per bushel according to that way of looking at it.
No doubt food was a large portion of the cost of living back then, but I am somewhat leery of such comparisons.
Unless you grow wheat for sale to other parties, or your enterprise buys wheat to transform into things (bread, flour) for sale to others, the futures market is not the place for you.
Unless, of course, you’re Hillary Clinton.
Sure if you want to get your head handed to you
All this seems a bit premature. So many places had a cool spring, What of it? We haven’t seen any evidence of significant cooling. Much ado about nothing.
Some might call .5 C since a beginning of April “significant cooling”.
Nor has there been any evidence of significant warming since the 1990s, despite steadily increasing CO2.
0.3 C is significant.
..
http://www.woodfortrees.org/plot/uah6/from:1990/plot/uah6/from:1990/trend
0.5 C is significant
..
http://www.woodfortrees.org/plot/gistemp/from:1990/plot/gistemp/from:1
Sorry: http://www.woodfortrees.org/plot/gistemp/from:1990/plot/gistemp/from:1990/trend
…
(bad copy/paste)
Your graph ends too early, not picking up the post-El Nino cooling.
In fact, there has been no warming from 1988 to 2017 in UAH data.
GISTEMP is a pack of anti-physical lies.
Actually, there is cooling from the first half of 1988 to the first half of this year. Will see how the year ends.
First you say “since the 1990s”
..
Then you say: “from the first half of 1988”
…
Please make up your mind on which cherry you want to pick.
“there is cooling from the first half of 1988 to the first half of this year.”
..
Not in the RSS data: http://www.woodfortrees.org/plot/rss/from:1988.5/plot/rss/from:1988.5/trend
…
So, GISS, UAH and RSS all prove you wrong.
Martin,
There is no discrepancy.
For the 1990s, I refer to the trendline. From 1988 to 2017 is comparing directly those two years, without trying to do a linear regression back from the present to 30 years ago.
No, they do not “prove” me wrong.
They prove that they have cooked their books. In the sad case of RSS, only recently.
Not only is there no warming in the uncooked satellite data but also in balloon observations. “Surface data” sets aren’t worth the electricity to present them.
But even if there were warming, it would be far below the predictions, where they make predictions of the GIGO GCMs upon which catastrophic prophecies of doom are based.
Gabro, the trend shows it’s warming. Comparing two individual years does not prove “cooling” nor does it prove warming. For example 1998 was warmer than 2001, but that doesn’t mean the long term trend is “cooling” http://www.woodfortrees.org/plot/rss/from:1998/to:2001/trend/plot/rss/trend
Are you saying RSS and UAH are cooked? Roy Spencer and Carl Means won’t want to hear that from you.
” it would be far below the predictions,”
…
We’re talking about measured observations, not predictions. Stop moving the goal posts.
” uncooked satellite data”…. Could you please post a link to it? I’d be interested in seeing what the uncooked satellite data looks like.
Martin,
No, I’m saying that formerly only the so-called surface “data” were cooked, but now RSS has joined the Borg. Only UAH and balloon data remain scientific. All other series are works of political fiction and science fantasy.
I know a trendline is better than direct comparison of two years, but if the world were really warming significantly, how can one year, right after a super El Nino, possibly be cooler than one from 30 years previously, indeed the very year in which Hansen started the CACA sc@m?
Martin,
To compare RSS post-cooked with pre-cooked, just look at previous versions, and compare the difference in latest version with UAH compared with “surface” sets. RSS has been under tremendous pressure to fall in line with the collective consensus, ie the totally rigged surface series (which aren’t actually even of the surface, since the totally made up SST component is from various levels below the surface).
Martin,
Not moving the goalposts, but talking about the significance of such “data” sets as there are.
The “surface” data are not genuine observations, but adjustments and in-filling in any case.
I see how it works Gabro. When data doesn’t fit your worldview, you claim it’s bogus. However, you seem to accept UAH data.
…
So when you say: “there is cooling from the first half of 1988 to the first half of this year.”…..UAH proves you wrong: http://www.woodfortrees.org/plot/uah6/from:1988.5/plot/uah6/from:1988.5/trend
Either version of UAH shows warming: http://www.woodfortrees.org/plot/uah5/from:1988.5/plot/uah5/from:1988.5/trend
Martin,
I told you I wasn’t referring to a trend line from 1988 to 2017, but just comparing the annual average for those two years. You show a trend. However, like your prior graphs, it doesn’t include the pronounced cooling since the 2016 El Nino peak.
It’s not the results of the series output to which I object, but to the unscientific, indeed antiscientific, methods used to construct these blatant fabrications.
You said: “I know a trendline is better than direct comparison of two years.” Excellent, because if you are comapring two different points in time, then I can compare January 15th, 2017 with July 15th, 2001. It was 12 degrees F on 1/15/2017 here, and it was 76 degrees F on 7/15/2001. At that rate, there will be a mile of ice over me by 2025.
…
PS, Spencer and Christy will not like it if I email them a link where you post: “the unscientific, indeed antiscientific, methods used to construct these blatant fabrications.”
This graph from Spencer includes the pronounced cooling since the 2016 El Nino peak: http://www.drroyspencer.com/wp-content/uploads/UAH_LT_1979_thru_May_2017_v6-1-550×317.jpg
…
It doesn’t affect the long term trend all that much, in fact in the last three months of data, the trend is going back up !!!
A human being would be hard pressed to notice such a change in temperature even when naked.
What is the significance of a half degree of variation on a planet where the hour toy hour temp of a given location swings 20-40 degrees or more, and from week to week in the mid-latitudes this time of year commonly differs by 30 degrees or more?
For that matter, what is the significance of the 2 degrees that many uncritically accept as the difference between global catastrophe and no big dealio?
Hint: The number was pulled out of thin air for no particular reason for the purpose of discussion back in the 1970s, and has now taken on a life of it’s own.
The point is, just because there is a trend does not mean we are on a one way ride to a global hothouse.
It has always been warming or cooling in multi-decadal trends (1998 to 2016 being a notable exception).
Recent warming is not unusual, nor does it prove anything in particular.
If we had satellite data going back a hundred years, I would bet a fat stacks of hard cash it would show net cooling from the 1920s to the present.
Is 0.3C or 0.5C significant.
Look at the chart again. If you have never noticed this, it appears that the Earth’s temperature fluctuates within a +/- 0.2 C range on a kind-of 2 week basis. It varies some but it seems that 2 weeks is the maximum of these excursions.
I have noticed this in other datasets which are based on daily records as well.
THIS is fundamental characteristic of the Earth’s climate. +/- 0.2C with a 2 week type variance. I think this a very important fact which needs to be set in stone as a “fundamental fact” that will help improve all kinds of climate analysis.
“A human being would be hard pressed to notice such a change in temperature even when naked.” True. Also, a human being would be hard pressed to notice the difference between 5 volts and 9 volts between two wires. When human beings are hard pressed, they create instrumentation (i.e. thermometers or voltmeters) that allows them to notice such changes. The significance of a half or full degree is additionally noticeable in retreating glaciers, and the poleward migration of temperature sensitive species. It’s even more significant when it’s the measured average temperature of the planet (cause the planet has a lot of mass.)
Bill Illis, there is a significant difference between a 2-week baseline, and a 30 year baseline. 2-weeks is “weather” and 30 years is “cilmate”…..do you understand this distinction?
Menicholas: “Recent warming is not unusual.” Actually it is unusual due to the fact that we know the influence of orbital variations on our climate. Based on the precession of the equinoxes/orbital variances , the long term cooling that started several thousand years ago should not have stopped. The LIA should have continued, but something caused an abrupt turn of events.
Martin Clark,
I just said +/- 0.2C was “weather”.
Beyond that, you have the ENSO variability and the AMO variability (which has more than a 30 year cycle) and you have a hundred year variability in the Sun so you just have not looked at this clearly enough.
I have never seen any charts or graphs of temps that is not the same saw-toothed zigzag we see now.
So obviously there is far more to it that orbital variations.
The problem with historical comparisons at this point is the fiddling with the historical records.
No serious and unbiased person can accept them as adjusted.
The amount of the adjustments is enormous compared to the amounts that people are getting into a tizzy about nowadays.
And the adjustments make no sense…it is obvious from a simple comparison of different sources of information that they adjustments make no sense, except from the point of view of proving CAGW and the control knob theory of CO2.
And the advance and decline of glaciers is a very good example from which to demonstrate this is so.
The historical accounts of glaciers advancing and retreating does not match the adjust temperature records…but it does match the unadjusted ones.
But I am sticking to my assertion…a few tenths of a degree makes no difference to anyone, anywhere, anytime.
Menicholas: when you say: “No serious and unbiased person can accept them as adjusted.” then you cannot make any statement regarding historical records. Nothing. Zilch Nada. When you finally accept a(any) historical record, maybe we can discuss it’s ramifications. Until you do that, you cannot make any statement about climate.
Martin: “Here Menicholas, here is my data.”
Menichols: “I can’t accept that data, you adjusted it”
Martin: “Yes I did an adjustment, I changed all of the degrees Fahrenheit to Celsius”
Menichols: “I can’t accept that data, because it’s adjusted”
Martin: “Fine, then go jump in a lake”
Personally, I like me some ice core data.


Such data gives a snapshot of one place, but over a very long period of time, and no one has ever shown that any given place can have trends in the decades to centuries and millennia time ranges that differs from the earth as a whole.
There are no orbital cycles that explain or match these graphs. The cycles are a series of smooth curves, and the chart of the various ways they can be combined is likewise smooth curves.
But the records show saw-tooth random walk patterns, and some apparently cyclical dips and spikes, at every time scale.
The last four interglacials, notably, have all commenced suddenly, ended less suddenly but still rather abruptly, have been roughly ten thousand years long or so…
I am right there with you on the Milankovich cycles…I first learned of them when I was ten years old back in the olden days…but they do not give an explanation for a lot of the known variations and rates of change.
The Younger-Dryas is a notable example…explain that with orbital parameters.
If your point is we should see a hockey stick and that is what we are seeing…well, might as well say so now so we can both quit wasting our time.
“Martin: “Fine, then go jump in a lake””
Menicholas: Tries to have a serious conversation.
Martin: Insists on being a jackass and makes it impossible.
“then you cannot make any statement regarding historical records. ”
Wrong…the only thing serious people cannot do is have a rational discussion with warmistas.
Because they are generally jackasses given to lapping up and regurgitating dogma.
Personally, I like graphs that cite where the data comes from. Your first one does, your 2nd one doesn’t. Additionally, your GISP2 ice core data doesn’t include the current measured data from the place where the ice core was drilled. The “Years before present 2000 AD” is incorrect, it should be 1850.
…
http://imgur.com/s19MOMd
..
or this
..
http://2.bp.blogspot.com/-hksiecM4u3Q/VLYC3ecYOKI/AAAAAAAAAP4/ZsJFpmrxgZo/s1600/GISP2%2BHADCRUT4CW%2BHolocene.png
…
Oh yeah, by the way, one ice core from Greenland doesn’t show GLOBAL temps, it just shows Greenland temps.
“they are generally jackasses”
..
I’m impressed that you’ve resorted to name calling. I expected better from you.
I consider comments like “go jump in a lake” the functional equivalent of insults.
And deliberately and obtusely misconstruing what someone as saying as arguing in bad faith.
And putting words in someone else’s mouth about the most disingenuous thing one can do during a conversation.
I will not say whether or not I expected better from you…because I do not know you.
But you should know that if you engage in the above sorts of behavior…some people will call it for what it is in no uncertain terms.
If you want to know where the second graph came from, hover your cursor over it, and the URL will appear at bottom left on your screen…you can then go to that linked article.
Wel Mr. Name Caller, if you will not accept “adjusting ” data from Fahrenheit to Celsius, then there is no alternative for me but to ask you politely to terminate the discussion, and immerse yourself in the nearest large body of water.
…
Is that more to your liking?
I notice no response to the question regarding the differences between the graph or orbital variations and the temperature reconstructions.
And I started out saying that ice cores give a picture of one spot over a long period of time.
The URL for the graphic does not indicate the data source. Your first graphic shows R.B. Alley as it’s source.
“I notice no response to the question regarding the differences between the graph or orbital variations and the temperature reconstructions.”
…
Wow, you have a lot to learn about climate forcing. Orbital variations affect global climate. Greenland ice cores reflect Greenland climate. When you have ice core data that reflects global climate, you’ll see the orbital variation. How come Greenland cores don’t match Antarctica cores?
Bill Illis do you think we’ll have a Gleissberg Minimum in a couple of years? I have a lot riding on your answer.
““Years before present 2000 AD” is incorrect, it should be 1850”
Good to see that you know Michael Mann’s hockey stick is wrong. 😉
The good news-
Grains piled on runways, parking lots, fields amid global glut | Reuters
http://www.reuters.com/article/us-usa-grains-storage-analysis-idUSKBN17D0EO
11 Apr 2017 – World stockpiles of corn and wheat are at record highs. From Iowa to China, years ofbumper crops and low prices have overwhelmed storage capacity for …. 2014 2015 2016 2017 0.0 0.2 0.4 0.6 0.8 1.0 1.2 1.4 billion bushels.
There is one advantage, it takes only 3 years from now to know more what will happen, something else than the 2100 Armageddon from IPCC.
There has been interesting cooling in the last 2 to 3 months over the NW corner of Russia. Which looks to have been caused by frequent dips of the jet stream to the south over this area, so allowing Arctic air to flow down across the area.
Why this is of interest.
1. lt has aided the snow extent in Eurasia to be above average at least since May.
2. Should this cooling remain it will also allow the snow cover to set in early next winter.
3.This cooling has not just been confined to the landmass, it has also extended the the Arctic ocean north of this area. Which has been in stark contrast to the warming in recent years.
4. This area along with North America was hit hard during the LGM.
LGM?
Last Glacial Maximum
First of July and still no hummingbirds in the hollyhocks.
Unprecedented!
I’d thought knew of every act of perversion known to man or woman, but I never before heard of “hummingbirds in the hollyhocks”.
Nor a titmouse in the tulips.
Oregon is the epicenter of organic perversion.
Finally today, July 10, the first hummingbird of the summer at long last appeared in the hollyhocks.
. The nations spring was warm and the vast majority of the nation is going to have a great growing season. Cold intrusions such as this are isles of chill in a sea of warmth.
Sunspot activity has been on a decrease since the 1980s, each cycle smaller than the one before, yet the planet has warmed. I think that if one is going to play the solar card, one has to realize that a couple of decades of mins is nowhere near what happened in the LIA which has a 200 year stretch of mins, followed by another shorter stretch. We have had a set up OPPOSITE OF THAT. Just where is all the stored energy from 200 years of major sunspot activity. If you are arguing sunspots, you have to acknowledge the oceans with 1000x heat capacity of the air and covering 2/3rds of the earths surface have to be holding that card! You cant just expect it to disappear In fact low solar would encourage more el ninos since reduced incoming radiation in in the tropics may lesson the easterlies. There has been a major change in the MSLP pattern due to the distortion of the warming. much more in the north than in around the tropics. This is no accident given increased WV from a warmed ocean would make more difference in temps where its cold and dry. My point here is I dont think a renegade cold shot relative to the entire spring in europe or in the US can be looked at as the start of all this Again, for the vast majority of the US, this looks like another great growing season. As far as Europe, if you start seeing it more than once in a while, then perhaps that opens eyebrows. In the big picture the large drivers and their CUMULATIVE EFFECT, not just what is happening now ( we know about seasonal lags but we must consider lags at a greater time scale when dealing with theoretical results of sunspots with something like the ocean) I am not here to throw cold water on the party, I am saying that there are different ways of looking at this. I remind every one that th drop off from the super nino in global temperatures has not matched the rapid response after the 97-98 enso event which had a major nina behind it. Peace
Spot on. The oceans hold the card and my visual mental integration of the area under Leif’s sunspot graphs says that it has been an unusually long 20th century spell of higher solar activity which will not be coughed up by the waters which cover 70% of our planet to an average depth of 6500 ft too quickly even if solar activity subsides.
If you actually do the numbers, the 20th century is only a little bit stronger [difference is within the error bar]:
http://www.leif.org/research/Temp-and-GN.png
It takes a strong faith to claim there is a significant difference correlated with temperature.
Leif,
Never said that. Said there is a great deal of area under the curves of your chart in the 20th century compared to prior periods for which we have data. Visually, and according to you this is true but not statistically significant (from when to when?). My main point is that the oceans have been soaking it up and I do not believe they will cough it all up qiickly. As Joe said, the oceans hold the cards. I would be surprised if climate cools off……..quickly……even if TSI goes down quickly, relatively speaking.
a great deal of area under the curves of your chart in the 20th century compared to prior periods for which we have data.
A ‘great deal’ is how much?
The area under the curve for 1700-1799 is 451 [groups * 100 years] and for 1900-1999 it is 455. Not a ‘great deal’.
Lief,
It occurs to me that you and many who disagree with you make the same mistake and think linearly about a non linear, multivariate and over long periods, chaotic system we call climate.
Averaged over a century goes a long way to wash out the non-linearities, and your argument goes the other way too: If we can’t average out the non-linear stuff we can’t say anything about the purported sun-climate connection either.
And what do you have to say about how the oceans absorb and give off all of the energy they absorb? The mechanism? Ceteris paribus? Averaged out? And why start or stop at 100 years? The fact is we know little about the oceans’ mechanisms for storage and giving up heat and the history of how clouds, humidity, wind, suboceanic volcanism and a variety of other variables affect those mechanisms. You are still thinking linearly. Your 0.1 degree hypothesis is a perfect example of linear thinking.
By the same token, there is no evidence for any sun-climate relationship whatsoever as all such claims must be based on the same linear relations. Linear thinking is OK when the effects are small.
Some relations are in fact non-linear, but still amenable to linear analysis, e.g. the relationship between irradiance and temperature S = a T^4, which for small variation of S gives the linear relation dT/T = dS/S/4, where dS/S = 0.1% gives dT/T = 0.025% of 288K = 0.07K, to be compared with the observed ~0.1K.
“It takes a strong faith to claim there is a significant difference correlated with temperature.”
The real leap of faith comes into play when a guy claims the solar cycle only adds 0.1C to the SST of 0.6C on the sole basis of the belief in an equation that has less than 20 characters!
It’s a real cult-like leap of faith that 83% of the heat needed during a solar cycle ocean temperature rise passes by all of us humans into the ocean depths undetected by us, like stealth heat.
Where’s the persistent heat source 5X stronger than sunshine [according to your formula] that the rest of us haven’t noticed, sensed, measured, or accounted for? Where is it? Why didn’t we feel that ‘heat’?
The solar cycle TSi adds all the heat for a typical 0.6C SST rise, or whatever it is. There is no significant ‘other source of heat that is 5X stronger than sunshine’!
Everyone needs to get over this cult-like belief in the IPCC solar POV.
he belief in an equation that has less than 20 characters
I have strong belief in equations with only 4 characters or less [E=Mc2, F=ma, …]
There is no long-term trend in solar activity since 1700:
http://www.leif.org/research/GN-SN-since-1700.png
The ‘trend-line’ has an R^2 of 0.0067, which means that only 0.67% of the change is due to any trend in solar activity [not significant].
Yet there is a trend in the number of spotless days per minimum since 1818.
The second half of the 20th century has a lower number of spotless days per minimum. This number has been going up drastically in the 21st century.
http://www.sidc.be/silso/IMAGES/GRAPHICS/spotlessJJ/SC25_SCvsNumber.png
This is an indication that the solar minima have been less minima during the global warming period.
Unfortunately the observations are not continuous enough to count spotless days before 1818, but we can use the maxima of the cycles as indicators of their size. Waldmeier noted in 1978 that
““There is a relationship between the rise time T (in years) from minimum to maximum and the maximum smoothed monthly sunspot number RM: log RM = 2.73 – 0.18 T. The times of the extrema can be determined without knowledge of the reduction (or scale) factors. Since this relationship also holds for the years from 1750 to 1848 we can be assured that the scale value of the relative sunspot number over the last more than 200 years has stayed constant or has only been subject to insignificant variations”
http://www.leif.org/research/The-Waldmeier-Effect.pdf
“And can therefore be used to show that the scale values have not changed at least the past 250 years
• From which one can conclude that our records that show that Solar Activity reached the same level in each century from the 18th onwards (and possibly from the 17th as well) are very likely correct
• Therefore the Modern Maximum has not been particularly Grand compared to the maxima in previous centuries”
Again you are referring to maximum activity, while the number of spotless days refers to minimum activity.
The data indicates minimum activity increased (number of spotless days decreased) for nearly two centuries, reaching a peak in the second half of the 20th century, and has been decreasing in the 21st century.
The minima are not important as all solar indices relaxes to a minimum energy state during those.
See e.g. Slide 12 of http://www.leif.org/research/EUV-Magnetic-Field.pdf
So you claim. However a minimum in 1912 had 1000 spotless days and a minimum in 1960 had only 200 spotless days. That’s 6,5 months versus almost 3 years without spots.
And we know that a very cold period coincided with the Maunder minimum when the sun was spotless for decades. So we don’t have to accept your claim that the minima are not important from a climatic point of view.
That’s 6,5 months versus almost 3 years without spots.
So what? http://www.leif.org/EOS/2011GL04658.pdf
“[1] Variations in the total solar irradiance (TSI) associated with solar activity have been argued to influence the Earth’s climate system, in particular when solar activity deviates from the average for a substantial period. One such example is the 17th Century Maunder Minimum during which sunspot numbers were extremely low, as Earth experienced the Little Ice Age. Estimation of the TSI during that period has relied on extrapolations of correlations with sunspot numbers or even more indirectly with modulations of galactic cosmic rays. We argue that there is a minimum state of solar magnetic activity associated with a population of relatively small magnetic bipoles which persists even when sunspots are absent, and that consequently estimates of TS for the Little Ice Age that are based on scalings with sunspot numbers are generally too low. The minimal solar activity, which measurements show to be frequently observable between active‐region decay products regardless of the phase of the sunspot cycle, was approached globally after an unusually long lull in sunspot activity in 2008–2009. Therefore, the best estimate of magnetic activity, and presumably TSI, for the least‐active Maunder Minimum phases appears to be provided by direct measurement in 2008–2009. The implied marginally significant decrease in TSI during the least active phases of the Maunder Minimum by 140 to 360 ppm relative to 1996 suggests that drivers other than TSI dominate Earth’s long‐term climate change.”
The presence of sunspots for ~10 years only increases the global temperature by 0.1K, so the absence of sunspots for a much shorter period changes the temperature even less.
Exactly. Your insistence that solar variability influence on climate has to be meadiated by changes in TSI is unwarranted.
That is where the energy is. What other solar driver would you suggest?
Not me. Solar variability climate researchers suggest the effect of UV changes on stratospheric ozone.
You know the works of Lesley Gray, Joanna Haigh, Karin Labitzke, and many others, so no need to cite them.
UV just follows the variation of TSI [and is but a small part of that], so if TSI has not varied enough, so haven’t UV. Slide 3 of http://www.leif.org/research/The%20long-term%20variation%20of%20solar%20activity.pdf shows that the effect of UV is of the order of 0.1K or less.
What do you think the UV was during the Maunder Minimum when there were hardly any activity to produce the UV? Less UV, less Ozone, less warming of the Stratosphere? Perhaps no stratosphere?
No. Not really. TSI is an average of a continuous spectrum where some wavelengths vary with the solar cycle and others actually vary against the cycle. Your simplification is misleading.
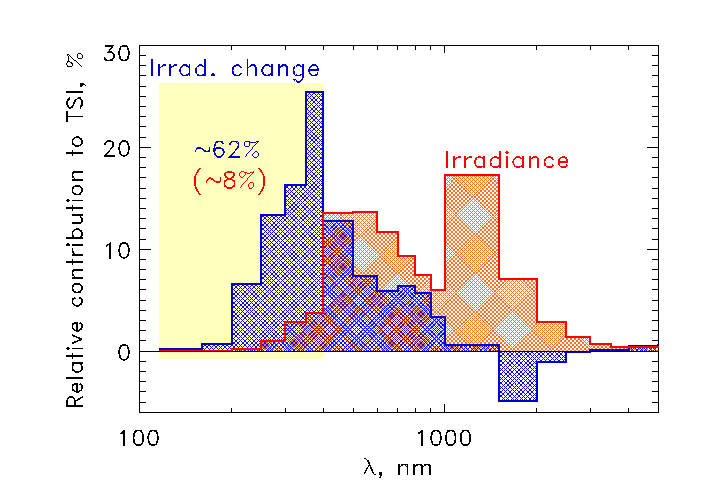
“Between 2004 and 2007, the Solar Irradiance Monitor (blue line) measured a decrease in ultraviolet radiation (less than 400 nanometers) that was a factor of four to six larger than expected (black line). In the visible part of the spectrum (400 to 700 nanometers), SIM showed a slight increase in comparison to what was expected. Measurements (red) from another ultraviolet radiation-sensing instrument called SOLSTICE compare well with those from SIM. Note: different scales are used for values at wavelengths less and more than 242 nanometers (see left and right axes respectively). Credit: Joanna Haigh/Imperial College London”
“The relative contribution of different wavelength ranges to the total solar irradiance (red histogram) and its solar cycle variations (blue histogram). About 60% of the total irradiance variations over the solar cycle are produced at wavelengths shorter than 400 nm (marked by the light yellow area), whereas the contribution of this spectral range to the total irradiance is only around 8%.”
That is old, stale data. The current consensus is that the variation was not real.
Even if it were, the resulting changes in temperature and ozone are minuscule.
You deftly evaded my question. What was UV during the M.M. So sunspots, no UV, no stratosphere?
Minuscule is not a usual scientific term. I already showed you that changes in O3 with the 11 year solar cycle are around 3%.
How could I know? UV was not measured during the Maunder Minimum. Nor were O3 levels. The possibility that they were significantly different to what we have measured remains. The proposition that TSI during the Maunder minimum was similar to 2009 cannot be extended to UV or O3.
The proposition that TSI during the Maunder minimum was similar to 2009 cannot be extended to UV or O3.
Newer measurements of UV and improved modelling show that the old claim of UV varying out-of-phase with TSI was spurious. UV varies just like TSI. Hence O3 will also do. The standard claim is that UV and O3 vary with the sunspot cycle. There is no good reasons to believe otherwise.
And you claim [or refer to such claims] that variations of UV were the cause of the lower temperatures during the M.M. There is no good evidence for that.
You didn’t look at the figures I posted. It is not UV that is out-of-phase with TSI, It is >400 nm and specially >1000 nm.
UV is a larger share of in-phase solar irradiation than of TSI.
Yes
You were babbling about UV and O3.
In any event, the spectral irradiance is so error prone that any variations from the usual solar activity run are dubious at best.
1) you admit that TSI is not a major solar driver
2) you claim that UV is
3) you admit that you don’t know the long-term variation of UV
4) now you say that it is not UV after all.
Some of those points contradict the others. Care to tell us which ones?
That you aren’t following me doesn’t mean that I am babbling.
1) TSI is not the only solar driver. TSI is an average of in-phase and out-of-phase frecuencies and thus not such a good representation of the solar cycle.
2) UV cyclic changes have measurable effects on stratospheric ozone changes, temperature changes and pressure changes.
3) UV changes have been measured with modern instrumentation and prior changes can only be inferred and subject to uncertainty.
4) I have not said that it is not UV after all.
I suppose you are well read in the literature of what we are discussing as it is a theme you discuss frequently and not too far from your scientific specialty. In case my supposition is wrong you can start with:
Gray, Lesley J., et al. “Solar influences on climate.” Reviews of Geophysics 48.4 (2010).
http://onlinelibrary.wiley.com/doi/10.1029/2009RG000282/full
The ozono, UV, and other possible solar changes that might affect climate are discussed in this review. It does a much better job at explaining them that I can possibly do.
1) TSI is not the only solar driver. TSI is an average of in-phase and out-of-phase frecuencies and thus not such a good representation of the solar cycle.
2) UV cyclic changes have measurable effects on stratospheric ozone changes, temperature changes and pressure changes.
3) UV changes have been measured with modern instrumentation and prior changes can only be inferred and subject to uncertainty.
4) I have not said that it is not UV after all.
Your response was not substantial and still evades the issue.
1) TSI is a very good representation of the sun’s magnetic field and the solar cycle:
http://www.leif.org/research/EUV-F107-and-TSI-CDR-HAO.pdf the in-out-of-phase stuff are not real.
2) On stratospheric changes, not well-documented for the troposphere and in any case just following the sunspot cycle [as shown by everybody claiming a relationship].
3) The modern instrumentation has severe calibration problems. The well-understood proxies [e.g. the daily variation of the geomagnetic field] are much better.
4) two negatives. The cancel to say: “I have said it was UV after all”.
Gray et al. ends by stating:
“Despite these uncertainties in solar radiative forcing, they are nevertheless much smaller than the estimated radiative forcing due to anthropogenic changes, and the predicted SC-related surface temperature change is small relative to anthropogenic changes.”
So the sun is not the major driver [at least according to Gray and his band of experts]. One can argue the validity of the AGW stuff, but not the validity of the smallness of the solar influence.
I fail to see why the importance of the solar influeced cannot be argued. I think it is pretty much a matter subject to discussion, except for you, that claim that the matter is settled.
I fail to see why the importance of the solar influence cannot be argued
That you fail to see something does not mean much. And the importance of solar influence can be argued as it has been for centuries. The current status is that the influence is small [minuscule was the word] as Gray points out, otherwise we would not be arguing.
You wish that was the current status. I have copies of dozens of very serious important articles on paleoclimatology concluding the opposite. All of them peer-reviewed and published in the best journals. That you proclaim that this is a settled matter does not mean much.
Your faith in cherry picked papers by authorities is strong, but as Willis once said: pick the ONE paper [not a review] that you think is the best or that convinced you the most and we can discuss that one. No question in science is ever settled so your constant reference to ‘settled science’ is disingenuous.
That is not the question, Leif. You said that the current status is that the influence is small, and that statement cannot be counteracted by a single paper, but by a large number of them that shows that many groups researching paleoclimatology find the solar variability influence the most likely explanation for the observed climatic changes. That is the indication that there is no current understanding, but an active ongoing scientific debate and your position is just one side in that debate.
researching paleoclimatology find the solar variability influence the most likely explanation for the observed climatic changes.
The operative word here is ‘paleo’ which means ‘pre-historic’, that is before we had any ‘history’ [i.e. actual observations]. So what they say is that since they can’t come up with any other explanation they postulate that the Sun must be the most likely, but since we have no data for the paleo-times they cannot show that, only assert that.
Absence of evidence has never been evidence of absence. The matter is not settled as you afirm.
A much bigger solar variability effect on climate during grand solar minima is a clear possibility defended by many researchers, and supported by proxies.
A much bigger solar variability effect on climate during grand solar minima is a clear possibility
No, it is wishful thinking. There is no evidence for that. Once it was thought that TSI [i.e. the energy we get from the Sun] was 1 or 2% smaller during low solar activity [Jack Eddy thought so] and if so, that would mean a 1K climate change. Now we know better, but bad science obviously takes a long time to die.
The evidence comes from paleoclimatic studies.
paleo- means ‘as related to the geological timescale’, and we have no solar activity records for that. And hardly any reliable climate records either.
You just answered to Jim G1 that:
“The cosmic ray record goes back some 10000 years.”
That is not ‘paleo’ and part of the GCR record is contaminated by climate in the first place.
Climate contamination is accounted for in solar activity reconstructions that match very well the periods were direct solar activity can be estimated. Those periods include the LIA and the modern warming, one of the most drastic climate changes in the Holocene. If climate contamination from those two periods does not affect the match between solar activity observations and GCR record, it means your objection has no substance.
Climate contamination is accounted for in solar activity reconstructions that match very well the periods were direct solar activity can be estimated.
No, they are not. Solar activity reconstructions are based on observations of sunspots, not on climate.
Those periods include the LIA and the modern warming, one of the most drastic climate changes in the Holocene
And the modern warming [not caused by the declining solar activity] was a great as the change coming out of the LIA, showing that climate change of that magnitude happens without help from the Sun.
Solar activity reconstructions are based also on cosmogenic isotopes and when they match the sunspots reconstructions despite the huge climatic changes since 1650 you know that climate contamination of the cosmogenic record is a bogus issue.
The modern warming took place during times when solar activity was above average. But I agree that the sun is not the only factor that affects climate. Other factors have surely also contributed to the modern warming.
Solar activity reconstructions are based also on cosmogenic isotopes and when they match the sunspots reconstructions despite the huge climatic changes since 1650 you know that climate contamination of the cosmogenic record is a bogus issue.
The cosmic ray researchers agree that climate contamination is a serious issue. E.g. (and many others)
http://www.leif.org/EOS/Muscheler-Cosmic-Ray-Topical-Issue2.pdf
“Therefore, apparent climate or weather influences in the records are already visible in the 10Be record for the normalization period. The aforementioned differences between Greenland and Antarctic 10Be data indicate that such influences are also present further back in time. We currently do not have adequate models to independently correct for such influences in the 10Be record.”
And they also agree that the issue is adequately dealt with by having two isotopes with independent deposition pathways and using carbon cycle models to account for climatic changes in 14C.
As I said the results speak for themselves. Reconstructions from cosmogenic records match very well SSN reconstructions since 1650 despite the huge climatic changes that have taken place. If the climatic contamination was as important as you claim there should be bid deviations between the cosmogenic reconstructions subject to them and the SSN reconstructions not subject to them. That is not the case.
And they also agree that the issue is adequately dealt with by having two isotopes with independent deposition pathways and using carbon cycle models to account for climatic changes in 14C.
You are master at distorting things. what Muscheler said was “influences are also present further back in time. We currently do not have adequate models to independently correct for such influences in the 10Be record.”
In another paper they state: “records are influenced by changes in climate, which are the largest uncertainty affecting the interpretation of these records.”
Another one of your images:
Please show us where the climate contamination has affected the solar activity reconstruction from 14C so we can evaluate that climate contamination that invalidates it as a solar activity proxy.
What? No effect from climate during a period of extreme climate changes? Vacuous argument then.
1700-1770 is a period of extreme climate chage [coming out of the LIA] and there is quite a difference between the sunspot reconstruction [blue] and the 14C proxy [red]. That could be climate contamination or sunspot reconstruction error. We don’t know as we don’t have good models for the climate contamination.
and https://arxiv.org/ftp/arxiv/papers/1003/1003.4989.pdf
“These and other features suggest that galactic cosmic ray intensity changes which affect the production of 10Be in the Earths atmosphere are not the sole source of the 10Be concentration changes and confirm the importance of other effects, for example local and regional <b<climatic effects, which could be of the same magnitude as the 10Be production changes.”
If the climatic contamination was as important as you claim there should be big deviations between the cosmogenic reconstructions subject to them and the SSN reconstructions not subject to them. That is not the case.
There are differences:
http://www.leif.org/research/Solanki-Muscheler-14C-Sunspot-Record.png
we don’t know what is climate related or from other reasons.
There are no significant differences between 14C activity reconstruction and the revised group sunspot reconstruction as you have defended.
It is not consistent that you would defend how close they are only to say now that one of them is contaminated by climate and thus can’t be trusted. It is quite funny to see you defending one thing and the opposite.
There are no significant differences between 14C activity reconstruction and the revised group sunspot reconstruction as you have defended.
When I say there are differences, there are differences.
First 14C [difference in blue oval]:
http://www.leif.org/research/Differences-GN-14C.png
then 10Be [difference on blue oval
http://www.leif.org/research/Differences-GN-10Be.png
the rest of your comment is nonsense.
Those are no significant minor differences. What was the word of the day? “Minuscule”
For matching past climate events to solar activity we just need to identify grand solar minima, and those are very big changes in solar cosmogenic records. Not the minuscule differences that you assign to climate contamination.
Almost a factor of two around 1750 is not minuscule.
For matching past climate events to solar activity we just need to identify grand solar minima, and those are very big changes in solar cosmogenic records.
Again words matter: ‘solar cosmogenic’ is an unwarranted assumption. Omit ‘solar’ and you’ll be closer to the truth.
http://journals.ametsoc.org/doi/pdf/10.1175/JCLI-D-11-00571.1
“SIM’s solar spectral irradiance measurements from April 2004 to December 2008 and inferences of their
climatic implications are incompatible with the historical solar UV irradiance database, coincident solar proxy
data, current understanding of the sources of solar irradiance changes, and empirical climate change attribution results, but are consistent with known effects of instrument sensitivity drifts.”
As I said: there is no evidence for real changes.
Different authors are taking different views on the issue. JPSS should settle that.
However the question is not if there are parts of the spectrum that change out-of-phase with the solar cycle, but by how much.
No, the question is what the physics of out-of-phase variations would be. As far as we know [and I don’t think we should base anything on what we don’t know] the Sun’s magnetic field controls all the various variations [on times scales of centuries and less] and our understanding does not cater for out-of-phase variations. As Lean et al. said http://journals.ametsoc.org/doi/pdf/10.1175/JCLI-D-11-00571.1
“SIM’s solar spectral irradiance measurements from April 2004 to December 2008 and inferences of their
climatic implications are incompatible with the historical solar UV irradiance database, coincident solar proxy data, current understanding of the sources of solar irradiance changes, and empirical climate change attribution results, but are consistent with known effects of instrument sensitivity drifts.”
Well, SORCE SIM is not the only model showing out-of-phase variations, is just the model that shows the most extreme variations
So if what you know does not cater for out-of-phase variations, perhaps you don’t know as much as you think you know.
And regardless it is pretty clear that different parts of the spectrum show a different contribution to cyclic variations in TSI. Does your understanding cater for that?
Well, SORCE SIM is not the only model showing out-of-phase variations
SORCE SIM is not a model, but an instrument. That other instruments show different results just shows that these measurements are difficult and have large uncertainties and errors.
And regardless it is pretty clear that different parts of the spectrum show a different contribution to cyclic variations in TSI.
No, that is not ‘pretty clear’. What is clear is that the uncertainties are very large. Your wording is vague enough to cover just about anything, so must be treated as vacuous
Your sight must be failing you. Look at the figure I just posted. The 200-400 nm bin contains most of the ΔSSI/ΔTSI. The current understanding is that different parts of the spectrum show a different contribution to cyclic variations in TSI.
The 200-400 nm bin contains most of the ΔSSI/ΔTSI.
Most of them cluster about the same value, so just show that dSSI is a fixed fraction of dTSI and that is what matters because it means that as TSI varies, so does SSI.
It also means that some frequencies and specially the 200-400 nm range vary a lot with the solar cycle, and other frequencies vary much less or even vary out-of-phase.
If the solar cycle shows a climatic effect, it follows that the effect must fall proportionally more on the frequencies that vary more with the cycle, and not on TSI, that being an average shows less variation that those frequencies.
It also means that some frequencies and specially the 200-400 nm range vary a lot with the solar cycle
But all in-phase.
If the solar cycle shows a climatic effect, it follows that the effect must fall proportionally more on the frequencies that vary more with the cycle, and not on TSI, that being an average shows less variation that those frequencies.
Again, words matter: ‘proportionally’ is your way out. TSI is not an ‘average’, but a ‘total’, i.e. includes all the variations, and observations show that the solar cycle effect is of the order of 0.1K or less, so it does not matter that 0.05K of that comes from a smaller part of the spectrum than the other 0.05K [i.e. is proportionally larger]. It is the total that matters.
The effect appears bigger when instead of a regular minimum we are dealing with grand minima or even clusters of grand minima.
Not for the mechanism. If the NEV appears to be the mediator of the climatic effect, and NEV constitutes a larger share of the cyclic variations, then your claims that the changes are “minute” can be dismissed.
The effect appears bigger when instead of a regular minimum we are dealing with grand minima or even clusters of grand minima.
Regular minima [e.g. 2008] are not all that different from Grand Minima. And you can double the effect to 0.2K if you want, still makes no difference.
It is the total that matters.
Not for the mechanism. If the NEV appears to be the mediator of the climatic effect, and NEV constitutes a larger share of the cyclic variations, then your claims that the changes are “minute” can be dismissed.
What matters is the result. 0.1K, not where it comes from.
NEV appears to be the mediator of the climatic effect
‘appears’? you just postulate that. You did not show that the rest of the spectrum has no climatic effect.
That’s an assumption or at best an educated guess, as we have not measured any grand minimum.
You are very reductionist. I remember I already told you that present Milankovitch insolation parameters are almost identical to 19 kyr ago, and yet the climate could not be different. The result comes from the integration of the forcing and the climate response. Therefore it matters very much where it comes from. Results suggest low solar activity induces persistent NAO negative conditions that contribute to the observed changes.
It was not me. Just read the Leslie Gray 2010 review. It is postulated based on evidence.
That’s an assumption or at best an educated guess, as we have not measured any grand minimum.
This works both ways. Since you have not measured any grand minimum you just guess what seems to fit your bias.
Therefore it matters very much where it comes from. Results suggest low solar activity induces persistent NAO negative conditions that contribute to the observed changes.
No, it matters not. Thew result matters. Since the observed change is of the order of 0.1K let negative NAO cause part of that. Does not matter much.
The observed change is bigger than that during grand solar minima. The LIA was not a 0.1º difference. More like 0.5-0.8º difference.
You just showed that the LIA was did not have a solar cause…
The change since 1980 is also of that magnitude. You would argue that that was due to [falling] solar activity?
The LIA had an important solar contribution. It is the last of a periodic climate variation were cooling and precipitation changes take place every 2450 years coinciding with clusters of grand solar minima.
Solar activity has only been below average recently since about 2006. This is more or less coincident with the observed reduction in warming rate and the decrease in the rate of Arctic sea ice melting. I would argue that falling solar activity since 2006 has contributed to the pause in global warming. I am not the only one arguing that.
The LIA had an important solar contribution. It is the last of a periodic climate variation were cooling and precipitation changes take place every 2450 years coinciding with clusters of grand solar minima.
Yeah, I thought you would stoop to peddle that, but you are not convincing.
Solar activity has only been below average recently since about 2006.
Solar activity has been generally declining since cycle 19 in the 1950s. Your statement as it stands claims that the minimum in 1996 was not below average. I differ.
Not to you obviously, but perhaps to others more willing to look at the evidence with open minds.
Declining but above average. It is only recently that solar activity has fallen below average. Perhaps you can see it in this graph that the thick line shows that solar activity has been above average since the early 20th century until recently:
Is an outdated series.
Solar activity has only been below average recently since about 2006
http://www.leif.org/research/GN-SN-since-1700-with-2006.png
shows otherwise. I have marked 2006 by a black dot.
No. It can be seen in your own figure.
http://www.leif.org/research/Sunspot-Activity-New-Series.png
The 11-year running average of solar activity just fell recently below the long term average after staying above for most of the 20th century coinciding with the modern global warming.
It has been above the long-term average in every century. And it is not the century-long-term average that determines the climate, but rather the day-to-day TSI providing the energy over time.
Yes, and there have been warming periods in every century, mostly coinciding with the periods when solar activity was above long-term average.
You don’t have enough knowledge of the climate to know what determines the climate. Periods of above-long term average solar activity correlate with periods of warming, and periods of below-long term average solar activity correlate with periods of cooling. Although correlation does not imply causation, it i compatible with it.
Periods of above-long term average solar activity correlate with periods of warming, and periods of below-long term average solar activity correlate with periods of cooling.
Not true, as you well know, e.g. 1900-1940 had lower than average solar activity but was a period of warming. you really should learn to refrain from spewing things that are easily shown to be false.
According to HadCrut, temperatures in the 1920s were not very different to temperatures in the 1880s which is consistent. It was in the 1930-40s when temperatures became significantly higher.
According to HadCrut, temperatures in the 1920s were not very different to temperatures in the 1880s
irrelevant. Temperatures from at least 1910 to 1940 were warming while solar activity was below average.
Your desperation is beginning to show.
Not true. Solar activity was above long-term average in the mid 1930s and 1940s, the warmest period in the first half of the 20th century.
The long term average 1700-2017 was 4.21 groups, for 1910-1940 it was 3.78 groups. You really should try to stick to the facts.
Minuscule is not a usual scientific term
It certainly is. It means ‘too small to be considered’.
‘Scientific terms’ are made by scientists. I am one. You?
Leif or whomever,
The sinusoidal nature of the sun spot numbers strengthenings and weakenings looks very much like an electrocardiogram of a normal heartbeat. Very apropos to the situation I believe. Are there any paleoclimate approximations such as 10Be or 14C or whatever in ice cores or sediments which give us any idea of what the solar strength may have been further back in time?
The cosmic ray record goes back some 10000 years.
More here: http://www.leif.org/research/Climate-Change-My-View.pdf
Leif,
Thank you.
Jim G1, i think you are in the right neck of the woods. This simple graph above says it all. During the global cooling period from 1940 – 1970, sea levels continued to rise. The ipcc tells us that a little over a third of sea level rise is due to thermal expansion and over half is due to ice melt. So the oceans during that cooling period continued to warm and ice continued to melt. If a cooling period (with temps above an equilibrium state temperature) can do that, then so also can a sustained temperature increase of .1C. The longer the sustained increase, the more warming. (with increases of water vapor from ocean warming, changes in albedo from ice melt, etc) The big QUE being, did we see greater impacts from solar forcing during the 20th century because it followed two centuries of similar forcing? (iow, were the solar forcings of the twentieth century more developed because we’d already seen two centuries of similar forcing?) At the very least, the take away is this: a sustained increase of .1C will cause further warming over the course of a century…
http://m.imgur.com/yvrMXFy?r
http://lasp.colorado.edu/media/projects/SORCE/meetings/2015/presentations/Session%204/l_Woods_SSI_Energy_Model.pdf
“The energy variability model results indicate very similar spectral variability from three different solar cycles and from different instruments”
“All three agree with TSI variability”
IMO, UV cannot help but affect climate profoundly, as of course do other wavelengths of sunlight, but UV is qualitatively different from the less energetic spectra, both in the atmosphere and ocean.
High in the atmosphere, UVC and most of UVB make and break ozone, and are totally or mainly absorbed by the atmosphere. UVA penetrates not only air but deeply into the oceans. Fish, birds and insects can see the near UV.
Its effects are more far-reaching than its share of TSI, even when that proportion is at its maximum. And of course it fluctuates much more than does TSI.
lsvalgaard July 2, 2017 at 5:09 pm
In this case, “paleo” means “before thermometers”.
The thermometer was invented in 1612… the solar records began at the same time.
lsvalgaard July 2, 2017 at 5:22 pm
Yup. So paleoproxy data are required to reconstruct past temperatures before that time, and indeed for long after it for much of the planet.
lsvalgaard july 2, 2017 7:47pm
“Not true, as you well know, e.g. 1900-1940 had lower than average solar activity but was a period of warming.”
SVALGAARD & JAVIER (down here!)
The early years of the two preceeding centuries also had lower than average solar activity, but were periods of warming. Javier more accurately should have said “above threshold” as opposed to “above average”. (and Svalgaard should more accurately have refrained from splitting hairs… ☺)
http://m.imgur.com/yvrMXFy?r
Hey, the 1950-1970 period had cooling, and also bumper crop after bumper crop.
besides for all that, look at that map of typical last frost dates…there are areas on that map where the end of June is in the 75% probability band.
So…just how unusual is a late June frost in those places that had one?
One might take a guess that, somewhere or other, every year has one in one place or another.
When the jet stream was bent northward in the western US in June, it is for sure that some other places where getting unusually cold weather and a dip in the jet. After all…the “average temp of the earth” varies by fractions of a degree over any period of a few months.
Agreed with Joe Bastardi.
Right now the Oceans are net absorbing 0.5 W/m2 per year which has only translated into 0.1C of warming of the Oceans down to 2000 metres after 50 years!
It looks the Sun only varies by this 0.5 W/m2 over long time-scales.
So let’s say the Sun slows down for 10 years. Well nothing happens because the Oceans have only changed temperature by 0.001C.
Now let that downturn last for 50 years or 100 years or. 200 years and now the climate has changed because the Oceans have lost enough energy over this time (0.5 W/m2 per year or 0.001C per year) over many decades and everything has cooled off. But this accumulation rate is so small that it takes decades and decades.
Yes, and it’s more than decades. The oceans are a massive smoothing filter of any changes in insolation. As evidence of this, the Milankovich forcing of the glacial-interglacial cycle is lagged by 6,500 years:
Forcing by obliquity, that is.
@ur momisugly Obliquity
Wow, to my untrained eye, obliquity lags temperature about half the time!
Not to mention that it is opposite in phase about half the time.
“It takes a lot of belief”, to quote Leif, to see anything more than a weak influence that only jumps to correlation status when the real controlling factors (whatever they are) are out to lunch.
It can be said that when obliquity falls interglacials are doomed to end in a few millennia. Also interglacial periodicity has matched obliquity periodicity for millions of years. It still does, only that the ratio is no longer 1:1
Tzedakis, P. C., et al. “A simple rule to determine which insolation cycles lead to interglacials.” Nature 542.7642 (2017): 427-432.
http://eprints.esc.cam.ac.uk/3856/1/nature21364.pdf
That is not what I would call a weak influence. Are you failing to take into account millions of years of Quaternary Ice Age coincidence between obliquity and interglacials?
It might be interesting to see a map showing the date of the last frost or freeze on record.
Also, the map is labelled as the 75th percentile of the date of last frost…but does this mean that 25% of the time it is later than that, or what? 25% of the time it is either later or earlier?
25% is a not a small number. I doubt anyone could stay in business losing a crop, or a substantial part of one, 25% of the time.
I can’t help you with that, but here in Southern Saskatchewan, in the heart of the Canadian grain belt, frost in late June might occur about once every 20 years or so. It would probably not be very general and hit low lying areas .
May 1 to June 27:
https://twitter.com/RyanMaue/status/880248128833818624
The CBOT September 2017 Wheat Futures contract is found here:
http://quotes.wsj.com/futures/WHEAT/contracts
Nice gains. However it just looks like a 50% retracement from it 2016 high.
Yes, there was a run-up in the contract this time last year, which Archibald’s graph shows, but then the graph departs from reality. It would appear that, for the last year, the graph has changed, perhaps to an entirely different commodity.
OFF TOPIC [but pertinent to this author]: David Archibald, the online Amazon summary, regarding your book, “American Gripen: The Solution to the F-35 Nightmare”, https://www.amazon.com/American-Gripen-Solution-F-35-Nightmare/dp/1941071538, stated: “The F-35 is the world’s largest weapons program, but it has attracted little in-depth analysis to date, apart from the Pentagon Director of Operational Test and Evaluation reports which, year after year, point out the aircraft’s SHOW-STOPPING FAILINGS AND SHORTCOMINGS [my capitalisations].”
Additionally, my searches uncover numerous and various articles discussing multiple international countries [>10 countries] which are buying this aircraft. On the face of it, without knowing the “details” of the respective sales [if, in fact, there will be any/many], this seems to be saying something quite positive about this product.
I do not know which/who is to be believed, or, whether such a distinction, between believable or unbelievable, can be otherwise addressed.
Q: Can you provide reference links, in which you may personally have some level of trust, issuing forth both positive and negative reviews of this aircraft?
“On the face of it, without knowing the “details” of the respective sales, this seems to be saying something quite positive about this product.”
Australia is buying this “product”, although Canada won’t. The Canadians say that a single-engined aircraft is unsuitable for their huge country. The Australians also have a huge area to cover (much of it ocean) but have decided – without any proper research or debate – to buy it.
Could this decision be because the last time an Australian prime minister went against the wishes of the USA, he got murdered?
Here is what an Australian barrister has to say:
“Time to Rethink Australian Defence Policy”
http://journal-neo.org/2017/05/07/time-to-rethink-australian-defence-policy/
Congratulations, you have taken an interest in the F-35. Some documents that shed some light:
http://dailycaller.com/2016/01/22/american-gripen-the-solution-to-the-f-35-nightmare/
http://www.americanthinker.com/blog/2017/06/the_f35_even_the_engine_is_compromised.html
http://www.americanthinker.com/blog/2017/03/heather_wilson_swamp_creature.html
http://www.americanthinker.com/blog/2017/01/bernie_sanders_swamp_creature.html
https://spectator.com.au/2017/06/the-f-35-where-to-from-here/
Then read pages 47 to 108 of this document:
http://www.dote.osd.mil/pub/reports/FY2016/pdf/other/2016DOTEAnnualReport.pdf
(Interesting,but waaay off topic) MOD
All this conjecture will be irrelevant when there’s no food on the table.
“No more Rice Krispies, we’ve run out of Rice Krispies”!
https://youtu.be/dvYFxCwojcI
I notice that 13 of the 14 countries in Fig.7 are Islamic. Stand by for trouble there. Inshallah!
Say what? You said, “Relative to the climate of the last century, an F10.7 flux above 100 causes warming and below that level causes cooling.”
Once again, any scientist worth a damn ALWAYS includes references for claims for and against. You have not. Therefor…
Therefor…
=======
Therefore you are ideally suited for a career in climate science.
Lol!!!!
Somewhere in my past posts. I had figured it out from the correlation of the solar cycle and sea level rise and fall. Be patient my little warmer, it is coming.