
One thing which struck me about the recent climate science hearing is how little attention was paid to Dr. John Christy’s demonstration of a flawed climate model prediction – the missing Tropospheric hotspot.
A flawed prediction does not automatically mean the models are totally wrong – but it is a strong indicator that something isn’t right.
Consider the primary observation. The world has warmed since the mid 1850s, and for the sake of argument lets assume that the world has warmed since the mid 1930s.
Given that warming, you could propose a number of different theories for the cause of that warming, for example;
1. Chaotic shifts in ocean currents or solar influences have influenced global temperature.
2. Anthropogenic CO2 emissions have caused global temperature to rise
3. Gnomes are lighting fires under the polar icecaps.
All three of the theories proposed above can potentially explain the primary observation – the world is warming, and heating is more pronounced in polar regions.
How do you eliminate the incorrect theories?
The way you eliminate incorrect theories is to test other non-trivial secondary predictions. It is easy to create a theory which explains global warming – even my Gnome theory does that. What is more difficult is to create a theory which coherently explains other observable phenomena, or better still predicts observations which haven’t been attempted yet.
For example, there are simple tests for the presence of Gnomes lighting fires under the polar icecaps. You could dig holes and try to find the Gnomes. If you don’t find any Gnomes, you cannot conclusively prove they don’t exist – the Gnomes might be very good at evading attempts at discovery. But failure to find Gnomes, or failure to find evidence of extensive efforts to light fires under the polar icecaps, should allow you to conclude that the Gnome theory is very unlikely to be correct.
How do you test the Anthropogenic CO2 theory? Just as the Gnomes lighting fires theory predicts the existence of Gnomes and extensive fire pits under the polar ice caps, so the Anthropogenic CO2 theory predicts various observations.
We could simply wait 50 years and see if global temperatures go crazy, but it would be nice to know whether the theory is correct before we all cook. So we need a non trivial secondary observation which we can test here and now.
One of the key predicted observations of anthropogenic CO2 climate theory is the existence of an equatorial tropospheric hotspot.

The hotspot prediction is easy to understand. The atmosphere is thicker, reaches higher into space over the equator than the poles, due to centrifugal force of the Earth’s spin. Centrifugal force is greater at the equator than the poles, so air, including CO2, tends to pile up higher into space over the equator.
The equator also receives more sunlight.
If the buildup of greenhouse gasses is trapping significantly more heat, the effect on the atmosphere should be most pronounced where the sunlight is strongest and the greenhouse blanket is thickest.
But nobody has yet managed to unequivocally detect that predicted hotspot.
Various theories have been advanced to explain the missing hotspot.
For example one theory is the balloon measurements are not being analysed correctly, so the hotspot is there, but it is evading detection unless you properly homogenise the data.
In my opinion this theory is undermined by satellite measurements which confirm the un-homogenised balloon measurements. This confirmation of un-homogenised balloon measurements casts doubt on the data homogenisation process which led to the alleged detection of the hotspot.
Another theory I have seen mentioned is that the hotspot is there, but the effect is not pronounced enough to be detectable as yet. More plausible in my opinion than the instrument anomaly theory, but this proposition verges intriguingly close to an admission that anthropogenic global warming is not a big deal.
Whatever the reason, the absence of a pronounced hotspot is or should be as much of an embarrassment to the Anthropogenic CO2 theory, as the absence of fire pits and captured Gnomes is an embarrassment to the Gnome theory.
Does the absence of a tropospheric equatorial hotspot mean anthropogenic climate models are unequivocally wrong?
The answer is no.
There are plenty of examples of scientific theories which were slightly wrong, which didn’t fully explain observations, which were later found to be mostly right.
Newtonian gravity mostly explains the orbit of the planets, but some observations don’t match the theory. For example, Newtonian predictions of the orbit of Mercury do not match observations. Mercury is very close to the sun, much closer than the Earth. That close to a massive body like the Sun, Einstein’s General Relativity becomes important. Relativistic effects cause Mercury’s orbit to diverge from Newtonian predictions of what its orbit should be.
This deviation from theoretical predictions does not mean Newtonian theory is broken, in this case it simply means the Newtonian theory is incomplete. Unless you need extreme precision, for example when creating a global positioning satellite system, the tiny perturbations introduced by Einstein’s theory are not significant enough to worry about.
But a flawed prediction is not something which should be ignored. Sometimes when you don’t find any gnomes at the bottom of the garden, you should stop digging holes.
As for the theory that chaotic shifts in ocean currents or solar influences control the climate, the evidence for this seems to be a mixed bag.
Suggestions that the eleven year solar cycle affects climate are convincingly disputed by Willis. If the powerful eleven year solar cycle doesn’t do anything to the climate, why would longer solar cycles have any effect?
On the other hand, there appears to be growing evidence solar modulation of cosmic rays may have a significant effect on atmospheric chemistry.
In my opinion, the short answer is we simply don’t know what drives the climate. More research is required, without premature efforts to formulate policy around theories which clearly do not explain all the key observations.
Eric, if you owned a property free and clear (no mortgage), would you take out an insurance policy on it?
That would depend on the cost of the policy and the actual benefits.
Assuming you are implying use of a precautionary principle, what is the projected cost of the proposed mitigation policies and how much difference would they make.
All I’ve read so far is that predicted mitigation of expensive policies will make an immeasurable difference in trends.
You dont take out an insurance policy on anything if the cost of the insurance is greater than the replacement value.
At least I wouldnt.
Cheers
Roger
http://www.thedemiseofchristchurch.com
It’s all down to “Echo Gnome Ics”
Or if the uninsured risks are modest. I know a number of people who do not have property insurance but have only contents insurance. The risk of severe property damage being small, but the risk of theft being more substantial.
Further, one has to consider whether you are insuring against the most dominant risk. Say act of god is excluded from the cover, and the largest property risk is earthquake damage. Thus, if warming is natural and warming is bad, the insurance does not cover the risk that you have insured against and thus the premium expense is worthless.
Yet further, one needs to be sure that the risk against which one is insuring is actually bad. Thus, if a warmer world is a good thing (personally I consider that it would be a net positive), there is no risk worth insuring against. Just adapt, to the extent that adaption may be needed in isolated examples.
Finally, is the cure worse than the disease. Is it better to have a drain/headwind on GDP now in the present, rather than to have no such drain, allow wealth to be created and use the accumulated money to be used in 100 years time if warming at that time has brought about real problems that need to be tackled.
Overall, I consider the insurance analogy to be a poor analogy, but even if one goes along that line of reasoning, one can immediately see problems with doing anything at all. There are simply too many unknowns, whereas we know that man is good at adaption and we know that man can live in almost any climate state from Siberia to the equatorial regions.
The “red team” concept applied to climate models is an example of the use of the precautionary principle, but this principle is honored in the breach when it comes to ensuring that our climates models are free of unwarranted assumptions or biases.
To give an example, nobody (well almost nobody) would pay for a ‘Zombie Apocolypse’ rider on your home insurance even tho the insurance companies would love to offer that ‘protection’.
Why has most of this thread been hijacked by somebody who wants to talk about insurance? I have to drop down to comment approx no. 88 (half the present count) before I find anyone – in this case Nick Stokes – who tries to talk about the ‘hot spot’ which is the subject Eric introduces – and even he doesn’t seem to have much success bringing the thing back on track for long.
?Can’t we do better than this..
Better get Gnome insurance too!
and earthquake, meteor, alien invasion, the sky is falling, sharknado and raining cats and dogs insurance.
They’re vicious when cornered.
Gnomes get their own insurance when it is warranted!
Most of the warming has occurred in Earth’s coldest air masses, at night, during winter. High temperatures haven’t risen much, if at all. Most of the warming has been the result of higher low temperatures, resulting in slightly higher average temperatures.
This is actually consistent with a slightly enhanced “greenhouse” effect… The warming since 1980 is consistent with our “greenhouse” gas emissions and an extremely low climate sensitivity.
All of the observation-based evidence indicates that AGW is nearly insignificant and, at worst, innocuous.
David,
Isn’t that also consistent with a growing UHI effect?
Th above highlighted text is a factually accurate statement, ….. but, IMO, ….. it wrongly infers that said “warming” is the result of said “GHG emissions”.
And thus it could be “cited”, “quoted” or considered “conformation” by proponents of CAGW as proof of their anthropogenic beliefs.
And iffen “conformation” of their anthropogenic beliefs, they will surely rush out and purchase insurance to CTA when the calamities of CAGW destroy their personal property.
Insurance is an invalid analogy to AGW mitigation. A slightly warmer world is better than a slightly colder world. The geological evidence shows us this has always been true. Cold kills, warmth encourages life. Why anybody would want to pay a huge price for a negative outcome is beyond me. Unless you hate civilization and/or people.
Show me proof that a warmer world is better.And I don’t mean comparing our world of today to the ice age, because that is not what we are talking about. ” Cold kills, warmth encourages life.” First this completely ignores the key role of precipitation. Second, 40% of the global population live in the tropics (and it will be 50% by 2050), and that does not include already hot regions like the Middle East. Go ahead and conduct a poll of those regions. I doubt very much they would prefer even hotter temperatures. It already routinely reaches the mid 40s in India in the summer months, and the mid to high 40s in the Middle East and parts of Africa.
Chris: The temperature of the tropics hasn’t risen much or at all compared to other regions.
Well Chris, I certainly wouldn’t invoke the IPCC as the ultimate authority on what’s good for the planet but it sounds like you pray at their altar so I will point out to you that the IPCC states that warming up to 1.8C is beneficial for the planet. Prove them wrong!
The fact that people preferentially choose to live in the warmest parts of the planet is hardly a reason to fear warmer temps.
Chris, looks to me like all those people living in the tropics have voted and believe they’d rather be warmer than colder.
Chris, Ever heard of the latitudinal diversity gradient (LDG)? It means: the increase in species richness or biodiversity from the poles to the tropics.
“The fact that people preferentially choose to live in the warmest parts of the planet is hardly a reason to fear warmer temps.”
Huh? They didn’t migrate there, they were born there. So your comment does not make sense. And the vast majority of folks in those countries are not able to emigrate.
“Chris, Ever heard of the latitudinal diversity gradient (LDG)? It means: the increase in species richness or biodiversity from the poles to the tropics.”
So what? I am not arguing that the tropics should have the same climate as the poles. I am saying that folks in the tropics do not want higher temperatures, and higher temperatures will no improve diversity or species richness. How much biodiversity and species richness is there in the Middle East, with it’s warm temperatures?
Chris
I don’t think you can speak for people living in the tropics.
In winter, some members of my family move South in winter to get a climate that is about 20 degrees C warmer. In summer, there is basically no difference.
It seems from your writings above that you feel a ‘warmer world’ means all temperatures in the daytime go up, as do all temps at night, meaning everything will be at a higher temperature all the time.
I believe there is no evidence to support this concept and a lot of evidence it is incorrect. A warming work has so far meant warmers poles (well, one of them) higher temperatures at night and higher temperatures in winter. In short, the climate has moderated with warming with smaller day-night excursions. The tropics do not warm when the world does for the simple reason that the upper limit of the ocean temperature is about 31 C. Above that it rapidly covers itself with a cloak of cloud.
This fact is not easily evaded. Where the temperature of Central Congo ought to be much higher than it is, given the temperatures to the north and south of it, it is not. Instead, it simply rains more. The idea that increased temperatures in the tropics lead to a decrease in rain and an increase in daytime temperatures is incorrect. Observations show that rainfall increases because of an increase in the cycling speed of water.
Long ago when the Earth was much warmer on average, the tropics were the same temperature as now, and the Arctic Ocean was 21 degrees C. That is evidence, very strong evidence, that warming happens mostly at the poles, that the tropics are governed by the ocean-atmosphere water cycle, and that baseless alarmist claims that everything will roast in a dry desert are bunk.
The only evidence we have regarding large desert regions from times when we know the earth was warmer (in this inter-glacial) show that desert conditions are moderated, rainfall increases, desert plants thrive, grazing areas expand, rivers flow and ‘nature’ prospers. We also know the opposite holds for times when it was colder. There is literally nothing to worry about that anyone can find. I feel the speculation that an increased average global temperature will create additional discomfort for people living in the tropics has no basis in observation, experience, fact or history.
It happens that the temperature of the tropics has dropped slightly since the 1940’s but I do not find that meaningful as it is slight. It does, however, strongly contradict any claim that when the global temperature rises, the tropical temperatures rise.
This can be used creatively to argue that the Medieval Warm Period (MWP) was not a ‘global phenomenon’. It wasn’t on the strictest terms, because the tropics don’t warm when the poles do. The tropical peoples didn’t even notice. It was definitely an actual phenomenon in that both hemispheres warmed, but both the northern and southern tropics did not. This does not unmake the MWP, it just adds to the evidence that CAGW defined as global dehydration and storm chaos is no more than a fairy tale. Gnome tale, if you wish.
@Crispin,
Excellent.
Chris is asking “Show me proof that a warmer world is better.And I don’t mean comparing our world of today to the ice age, because that is not what we are talking about. ”
Depends on what you mean with ice age, but the climate optimum is arbitrary and I object to it. https://en.wikipedia.org/wiki/Famine_of_1866%E2%80%9368
Apply a 7% discount rate to the “social cost of carbon” and a warmer world is better.
Chris, where I live in Queensland on the edge of the Australian tropics the average annual temperature is around 80F. A lot of people retire here. Not the warmest part of the world, but still pretty warm.
In response to Chris @ur momisugly 9:04, the history of the Little Ice Age in Europe (1300-1850) shows us that we should be praying for warmth, not cold. During the preceding Medieval Warm Period population grew and farming expanded and the great cathedrals were built. In a relatively short time beginning around 1300 the temperature dropped and glaciers advanced in Europe and in New Zealand; winters were bitterly cold (recall when the Thames froze over) and springs were cold and wet. Crops failed, farmland had to be abandoned because the extreme wet made it unsuitable, and people starved. Glaciers advanced and wiped out villages. Weather events were “unprecedented”: severe storms were unlike anything seen in previous centuries and it would rain for weeks on end. So great was the misery brought about by the cold and weather extremes that people began to accuse witches of “weather making” and thousands were burned at the stake in an attempt to rid the earth of the fiendish climate.
David Middleton — it is also ” consistent with” a considerably more persistent UHI effect. While any increase is lost in the noise during daylight hours the situation after dark is different.
We now have heat-generating activities continuing throughout the night to a much greater extent than even 30 years ago, never mind 100 years ago, not to mention these activities taking place over a much wider area. I wouldn’t dare suggest that anyone is fiddling the figures (I mean, would they?!) but how reliabke are the adjustments? Is there any basis for the belief that some rural stations have been improperly adjusted upwards to “bring them in line” with others that have become less rural rather than the more logical (to my mind) practice of trying to create an algorithm to offset fhe artificial increase seen as urbanisation starts to affect previously rural results?
Chris – April 2, 2017 at 9:04 pm
Chris, is historical proof good enough to convince you “warm is better”?
You need to read the complete commentary …. but here are a few excerpts from said, to wit:
Eric Worrall said: “Chris, where I live in Queensland on the edge of the Australian tropics the average annual temperature is around 80F. A lot of people retire here. Not the warmest part of the world, but still pretty warm.”
Eric, 26-27C is very pleasant. That is not what I am referring to. India regularly is in the low 40s during the summer months – that’s 108F, which I doubt many would find comfortable. Thailand gets into the high 30s, And you said retirement. Try working in 40C weather – it’s a whole lot less pleasant than playing golf or doing other retirement activities. Productivity in warm climate regions has already declined due to rising temperatures, and will decline further during coming decades: https://www.washingtonpost.com/news/energy-environment/wp/2016/07/19/as-the-world-grows-hotter-some-workers-are-becoming-less-productive/?utm_term=.b8cee1fb32b2
Chris writes
Well the earth has been observed to be greening. I think that’s proof enough that the earth is doing better when warmer with more CO2.
Chris also wrote
The article focuses on the extreme….”That paper showed a fairly dramatic negative influence of heat on economic productivity. In particular, the authors found that for a single very hot day — warmer than 86 degrees Farenheit — per capita income goes down by $20.56, or 28 percent.”
But the paper says “We find that this single environmental parameter continues to play a large role in overall economic performance: productivity of individual days declines roughly 1.7% for each 1°C (1.8°F) increase in daily average temperature above 15°C (59°F).”
Apparently 15C is too hot to work. I’m highly sceptical.
If you want to look at real productivity loss look at what happens when it snows
“According to the Financial Forecast Center, America’s GDP in March should be somewhere in the neighborhood of $646.27 billion per day. The 17 states that are hardest hit by this storm contain approximately 38% of the U.S. population; assuming that 20% of workers won’t show up for work today (based on the British average), we’d hit a figure of $48.8 billion in lost productivity.”
http://business.time.com/2010/02/10/the-economic-cost-of-snow/
Chris,
The LIA has been documented very well and proves without a doubt that colder periods bring famine, hunger, war and societal collapse. The ICE cores show periods of warmer than now such as the Medieval Warm period, The Roman Warm Period that have well documented historical accounts of civilizations peaking during these warm periods. History is your proof, do a little research.
Tim said: “The article focuses on the extreme….”That paper showed a fairly dramatic negative influence of heat on economic productivity. In particular, the authors found that for a single very hot day — warmer than 86 degrees Farenheit — per capita income goes down by $20.56, or 28 percent.”
Tim, daily highs in SE Asia are 31-33 – every single day, with some days warmer, and only a few colder – unless you go farther north. So that’s 88 to 91F every single day.
If you can point to research that refutes these productivity impact claims, please provide them.
“..Huh? They didn’t migrate there, they were born there…”
And why were these large numbers of people born there and not elsewhere?
Freaking duh.
Chris, even your fellow alarmists admit that in those areas with high humidity,additional CO2 will have little to no impact.
Are you really as clueless as you sound?
““The fact that people preferentially choose to live in the warmest parts of the planet is hardly a reason to fear warmer temps.”
Huh? They didn’t migrate there, they were born there.”
Huh? Tell that to every Canadian wintering in Florida and Arizona…
Crispin,
At least in the tropical Andes (and other locales in the Tropic Zone), the MWP was indeed warmer than at present, and colder during the LIA:
http://www.co2science.org/articles/V9/N23/C2.php
Periods of glacial advance correlate with solar minima during the LIA.
But you’re right that the Temperate and Polar Zones warmed more during the MWP than did the tropics. And cooled more during the LIA.
Chris April 3, 2017 at 7:05 am
In the moist tropics, when it gets that warm, it typically rains.
The tropics simply haven’t experienced the increase in temperature that you imagine an fourth CO2 molecule per 10,000 dry air molecules has supposedly brought.
Al Gore made the same mistake, alleging that “man-made global warming” had cause the ice on Kilimanjaro to melt, when in fact the cause of glacial shrinkage was less precipitation due to cutting down forests on the mountain’s slopes. There has been no change in the average temperature of the surrounding area of East Africa.
MarkW said: “Chris, even your fellow alarmists admit that in those areas with high humidity,additional CO2 will have little to no impact.
Are you really as clueless as you sound?”
Hey Mark, can you let the National Climate Change Secretariat in Singapore know that their temperature measurements and projections are all wrong? You know, Singapore which is on the equator and has humidity that ranges from 70-90%. https://www.nccs.gov.sg/climate-change-and-singapore/national-circumstances/impact-climate-change-singapore
Talk about clueless…..
Tim the tool man, you quoted productivity losses on snow days where businesses are closed or workers can’t get there. That’s going to be 1-4 weeks per year in places like Buffalo or Chicago. In the tropics, at least in the equatorial regions, it’s 31C or hotter more than 300 days per year. Big difference.
“Chris April 3, 2017 at 6:03 am”
“Chris April 2, 2017 at 9:04 pm
It already routinely reaches the mid 40s in India in the summer months, and the mid to high 40s in the Middle East and parts of Africa.”
No mention of SE Asia in this post I was replying to. But, you do mention Africa. My post in reply stands, you haven’t a clue about the poor in Africa.
PatrickMJD said: “No mention of SE Asia in this post I was replying to. But, you do mention Africa. My post in reply stands, you haven’t a clue about the poor in Africa.”
You clearly haven’t a clue that AGW is contributing to the famine problems in Africa, in addition to conflict issues. http://www.voanews.com/a/experts-say-climate-change-may-be-making-african-drought-worse/3783181.html
Chris writes
Seriously Chris? Look at the weather in the tropics on a daily basis. Its always 31/32C and varies only a little even at night. For you to claim the paper is suggesting a massive productivity drop for the tropics because its hot there displays a profound misunderstanding of what the paper is claiming.
When someone claims productivity drops beyond 15C with each degC then they’re looking at correlation, not causation. I’d love to read their paywalled paper…
Tim said: “Look at the weather in the tropics on a daily basis. Its always 31/32C and varies only a little even at night. For you to claim the paper is suggesting a massive productivity drop for the tropics because its hot there displays a profound misunderstanding of what the paper is claiming.
When someone claims productivity drops beyond 15C with each degC then they’re looking at correlation, not causation. I’d love to read their paywalled paper…”
There are 2 aspects to discussions of temperature and productivity as it relates to the tropics. The first is whether warm temperatures (say of 30 or warmer) result in lower productivity compared to a lower temperature. The paper says this is true. From the article: “Kjellstrom and fellow researchers found that in dozens of countries, daylight work hours lost to excessive heat have increased since the 1990s. They also estimate that at the current rate of global warming, that trend will continue.” So how exactly did I misstate the paper’s findings? The second is whether the impact of rising tropical temperatures on productivity can be quantified given the increase that has occurred in the last 20-30 years, compared to the temperatures back then. The paper also concluded the answer was yes.
Why do you think office temps are set to 18-21C instead of 30? Just to spend more of the company’s money? Why does no one try to set marathon records in Phoenix in June, but rather only attempts it in Berlin or Boston in the early spring? Why did siestas evolve in warm weather countries and not in cold? There are a number of papers on this topic (both office and mfg environments), the one I mentioned is one of many.
Chris wonders
Because the people in the tropics are acclimatised to it. How could they possibly compare a region’s productivity with that same region’s expected productivity when the temperature was lower. The region has never had appreciably lower temperatures and never will. Its productivity is what it is.
Unfortunately I dont have access to the paper but I’ll bet this paper is about productivity when say the regional average is 15C and the day being considered is 30C. The difference is that people “feel the heat” but in the tropics they dont (in the same way)
What I’d love to see is whether they attributed lower productivity to anything or whether its just possible that people take time off on nice days to go to the beach/pool/wherever.
Compare that to snow and its a different story…if you simply cant get to work.
Chris also wrote
Because its a comfortable temperature. The paper referenced suggests productivity drops for every degree above 15C so why do you think office temps aren’t 15C?
Chris – April 3, 2017 at 7:05 am
Chris is absolutely correct and he/she speaks for the 4,574,351 residents of the Valley of the Sun …. where it is sooooooooooo HOT ….. that they lack the energy or ambition to do much of anything …. and thus the reason they are relegated to being the 15th largest gross domestic product producers amongst metro areas in the United States
Don’t be surprised iffen Chris describes the following as being a “blatant lie”, to wit:
YUP, that Chris is one smart feller and iffen ya don’t believe me …… just ask him.
Samuel C Cogar – you posted about Phoenix as a refutation of my comments about heat and productivity. Phoenix is highly air conditioned – golly gee whiz, maybe that makes a difference! I am referring to regions where the vast majority of workers do not have the benefit of AC – garment factories, warehouses, manufacturing plants, etc. While office buildings and malls in tropical regions are air conditioned, most manufacturing plants and warehouses are not.While Phoenix has a decent mfg sector, it’s mostly in electronics, which is air conditioned – Raytheon, Intel, Honeywell, etc.
Chris, Chris, Chris. In general, when you are in a hole, quit digging.
I said nothing about whether the current temperature measurements in Singapore are good or bad.
What I stated was the simple fact that CO2 had little to no effect when there is lots of water vapor in the air.
This has nothing to do with the quality of the current measurements as you well know.
Your pathetic attempt to distract attention from your utter failure to say something relevant is duly noted.
Timthetoolman, here is the paper. It is not true that peak temperature is 31 (or33) every day. Yes, if you are exactly on the equator, but there are plenty of places in SE/ S Asia that are above the equator. Kolkata, for example, has peak temps of 25 in Jan and 36 in May – plenty of variation under which analysis can be carried out.
http://www.ilo.org/wcmsp5/groups/public/—ed_emp/—gjp/documents/publication/wcms_476194.pdf
As far as your question about 15C and why offices are not set to that temperature. Office work is sedentary work, so naturally one would need a less cool environment than in a factory for optimum performance.
MarkW said: “Chris, Chris, Chris. In general, when you are in a hole, quit digging.
I said nothing about whether the current temperature measurements in Singapore are good or bad.
What I stated was the simple fact that CO2 had little to no effect when there is lots of water vapor in the air.”
CO2 has less effect when there is lots of water in the air – of course, as the water vapor already reduces emissive cooling. But there is still enough effect to increase temperatures – not only due to reduced cooling through the atmosphere, but also rising sea temperatures, thereby reducing the cooling that comes from ocean breezes. https://www.nccs.gov.sg/news/results-second-national-climate-change-study-consistent-intergovernmental-panel-climate-changes
But hey, what does the SG government know? Mark says it’s not true (without providing any supporting links), so it must be the case. Hilarious.
MarkW – April 4, 2017 at 10:16 am
Sorry to say so, but that is the normal case when attempting to conduct an intelligent conversation with an under-35 young adolescent who is the product of severely inadequate parental nurturing and/or a blatant miseducation by the Public School System.
In Chris’s case, ….. his/her miseducation must have resulted in an “unquestionable” belief that air-conditioning (A/C) and central heating has been in common usage among and/or throughout the populace of the United States ever since the early 1900’s …. or maybe he/she believes A/C has been in use since the start of the Industrial Revolution. It is hard to say given the silliness they have been “taught” to believe is factual truths.
Such silliness is “believable” simply because they have never known or remembered a “day-in-their-life” when there was never any installed and functioning A/C in homes, offices, businesses, hospitals, schools and government buildings.
Little do those miseducated “clueless” adolescent-minded individuals realize, that the literal fact is, that central heating and A/C was actually scarce and never commonplace up thru the 1960’s and only began being widely installed in new construction in the 1970’s ….. and retrofitted or installed in older buildings up thru the 1980’s.
Samuel C Cogar – I’ll assume from your vague post that you are implying that because Phoenix existed before the widespread use of AC, that somehow disproves my point that hot weather affects productivity.First, the existence of a population in a hot climate says nothing about whether that population is productive compared to cooler climates. Phoenix had a population of 450,000 in the mid 60s, before AC became widely used. Today the metropolitan area has 4.3M, a roughly 10X increase during the time when AC use became widespread. So clearly AC was a major enabling and necessary factor in the city’s growth. Nice try, but you’ve done nothing to prove your point.
Buy insurance? Not if it was going to cost me what Global Warming speculation is clearly going to cost. If the cost was not a burden on my lifestyle and comfort, I’d keep my insurance. It isn’t a fantasy theory that my house could catch fire or a tornado is possible. So Chris, can I sell you some bolide earth collision insurance? This is something that has happened and will happen again and it is far more to be concerned about than a degree of warming. Climate tipping into a horror show has never happened. The chain of life of 2 billion years has never been broken so even when hit by bolides, which wreaked more disaster on the planet than any other danger, the earth just returned to its long term stable life supporting self and even cooled down to ice ages.
Here is what is needed to consider climate ‘insurance’. And this should be the easiest thing to provide for people so sure of themselves. EVIDENCE that anthropogenic global warming is a threat in a century to come. I am an engineer and a scientist so I am convincable If you have some evidence, let’s see it, someone must have evidence. What evidence are you relying on. The consensus? CO2 has used up most of its radiation trapping ability (remember we had 4000 to 7000ppm during long stretches of earth history, but after about 1000ppm, there would be no more noticeable warming. The theory projects 3 times the warming than observations are telling us. The only evidence tells us it has all been overhyped by a couple of hundred percent. We will not reach anywhere near the dangerous 2C in two centuries. Economic fossil fuels will be gone before one century and we will have to switch to nuclear (not renewables). If it’s something that requires me to buy some air conditioners to ameliorate it, well so be it. If the world is going to end, I would spend my cash on more sporting things than insurance. Chris, you don’t have a scientific background and you have the right make up for being sold on this stuff.
“So Chris, can I sell you some bolide earth collision insurance? This is something that has happened and will happen again and it is far more to be concerned about than a degree of warming.”
We are not talking a degree of warming, we are already past that. We are talking 2-4C warming. Gary, what is your scientific background?
The most appropriate and accurate analogy is the question, “If you owned a $100,000 house, would you pay $1,000,000 per year to insure against the Zombie Apocalypse? Cause it’ll kill you if it happens!!!!
“Chris April 2, 2017 at 9:07 pm
We are not talking a degree of warming, we are already past that. We are talking 2-4C warming.”
What is your scientific background and where is the evidence for this 2-4C, unmodeled, warming?
But all the money the developed nations spend on mitigation will NOT mitigate global CO2 levels, which will continue growing steeply for decades due to continued growth in emissions from developing nations.
“We are not talking a degree of warming, we are already past that. We are talking 2-4C warming. Gary, what is your scientific background?”
Gary Pearce’s post is pretty much spot on. But this reply is interesting for two reasons. First, the claim that the planet has warmed more than one degree. Since when, and how measured? That would be the question Its warmed a lot less than one degree, if its warmed at all, since the Medieval Warm Period, or since the 1930’s even, for that matter.
The second thing that is interesting is the ad-hominem argument. You always hear from the committed that only the ‘experts’ are qualified to have opinions on this. So Chris tries to turn the argument to Gary’s scientific qualifications.
At one level this is just a traditional ad-hominen argument and is fallacious. Gary’s argument is correct or not regardless of his qualifications. But at another level something more interesting is going on. We need to recall in the matter of climate the traditional approach of the far left to the desires of the masses.
You might think that the way to find out what the masses want is to ask them. You would be wrong. The way to find out is precisely not to ask them, since they are overwhelmed by false consciousness. Nor is it to ask their elected representatives who are similarly biased. The way to find out is to ask the Party. Because the Party is the true representative of the masses and History is on its side.
In the same way, we have to ask the experts about climate. But not any experts, and not experts who have published in the wrong places. We have to ask the real experts. And these will surprisingly turn out to be those experts who agree with us.
This is what is really going on with the endless rants about the peer reviewed literature and the demand to only consider the views of qualified climate scientists. Its basically the same thing, what the Party says is right, so shut up.
Chris, most of that 1 degree of warming occurred long before CO2 levels started rising.
michel, instead of asking what they want, the trick is to observe what they do.
Can’t speak for Eric, but for me, it depends on the terms and the likelihood of events occuring. Fire insurance for $100? Sure. Flood insurance for $1000? Depends on if I live in a flood plain. Dinosaur insurance $100,000? Probably not.
We’re talking about 1.5 C of warming (transient climate response) at 560 ppm CO2, half of which has already occurred with no demonstrable ill effect.
The social cost of carbon, which is based on the mythical 2-4 C scenario you describe, has a negative net present value with any real world discount rate applied.
All of the observation-based evidence indicate that AGW is relatively insignificant and that the cost of “insurance” against catastrophic scenarios has a negatve net present value.
Dave Middleton says, “All of the observation-based evidence indicate that AGW is relatively insignificant and that the cost of “insurance” against catastrophic scenarios has a negatve net present value.”
Dave, my perspective is the evidence is that the benefits are HIGHLY significant. At 560 PPM we are talking about a 35 to 40 percent increae in crop production ( above and beyond all other reasons for increases in crop yields) all acomplished with little to ZERO increase in land or water required.
We also note an increase in available crop land mass at moderate T and greater crop resistance to drought and heat.
Obsrvations indicate that the benefits continue to increase, while the harms are MIA.
The home insurance policy analogy is silly, Chris; No one is going to “make it right” if the earth goes into overheat mode . . You might be able to cook up some sort of fire prevention/suppression system analogy that sorta makes sense, but the home owner’s insurance one is . . false advertising, if used by proponents of forking over trillions to “fight” global warming. (And even if the the CAGW hypothesis is valid, those trillions might make virtually no difference anyway . . )
It’s a perfectly valid analogy, John. It can be worded differently and changed from insurance to spending money as a preventive measure. The core of what I am saying is very simple. Skeptics want to wait until there is 100% certainty before taking action on CAGW, even though in many other areas individuals/families/businesses would never wait until that point before taking action.
It’s an idiotic analogy unless you’re using it to argue against CO2 mitigation. You’re telling the poor people of the world to pay insurance on homes they will never have due to their crippling insurance premiums.
But I suppose you don’t need a medicine cabinet if you can’t afford medicine.
“You’re telling the poor people of the world to pay insurance on homes they will never have due to their crippling insurance premiums.”
Speaking of idiotic, no, that is not what I am saying. In fact, it is folks in the poorer regions who are asking for assistance from wealthier countries whose CO2 emissions are going to impact the climate in their countries.
Its exactly not insurance. Insurance takes an identified risk, like fire, with a known probablity, and then it pays out when the risk comes up in a given case. It may give a discount for measures known to reduce the risk. See for instance how insurance companies will lower premiums if proper security systems are installed. Typically what they suggest are fairly modest expenses in known protective measures.
What the climatists want to do is not that at all. Its to invest very large amounts up front in measures to prevent an uncertain and improbable catastrophe. This runs up against a quite different set of problems.
The main conceptual one is the one that Pascal had, but never addressed. That is, there are many of these catastrophes and we have to choose which one we insure against because its so expensive.
Pascal argued that to disbelieve in the Catholic religion of his day was foolish. The cost of being wrong was eternal damnation, and this was too high, no matter how unlikely it was, for this to be justifiable to risk, given the fairly modest investment represented by belief.
Unfortunately he did not go on to consider how one would take precautions against the consequences of disbelief in Zorastrianism or Islam, which would be equally dire. But alas, one could not believe in all of them.
The question with climate is whether we should invest the astronomical sums required, and accept the human welfare disaster, that the elimination of fossil fuels would cost, in order to avoid the very uncertain and improbable bad things that warming might bring.
One can only say, stop talking about insurance and do a business case. Show how much what you want to do will cost, show what other uses there are for the money and what they would yield. Then show what effects your investment would have on mitigating the supposed problem.
At the moment, we have the Paris Agreement, with no business case. What it calls for is China and India and the developing world to carry on emitting like there was no tomorrow, and for the US and Europe to make substantial reductions. The net effect of this will be very small reductions, if any, in tons emitted, and little or no effect on warming. Even assuming the alarmists are right about the consequences of emissions.
Faced with this argument, the climatists then usually try to minimise costs. They claim that investment in renewables will actually be very profitable. Fine, show us the business case, fully costed please.
They also try to move the argument onto a different plane, either reasoning from historic, per capita, or the use of the Chinese emissions to export. Or they talk about totally irrelevant Chinese investment in wind and solar.
In the end, this is one of two equally absurd arguments. One is that its fine for China and India to go from about 12 billion tons now to over 20 billion in 2030 because its fair. Its fair, that is, for them to destroy, or risk destroying, civilisation on earth.
Or, they argue that, contrary to what they had previously argued about the catastrophic effects of the US failing to meet its 1.5 billion ton reduction under Paris, the Chinese and Indian increases of 10 billion or so will not actually do much damage.
Its totally incoherent. No wonder they rely on Pascal’s wager!
Proof possitive Chris has never seen real poor people as you find in one continent he mentions, Africa. Chris, Africans are more focussed on their next meal, not some assistance from wealthier nations, which basically is a tax on the poor in wealthy countries swelling bank acounts of the rich in poor countries. Ignorance is stong in this one.
Chris
“Skeptics want to wait until there is 100% certainty before taking action on CAGW, even though in many other areas individuals/families/businesses would never wait until that point before taking action.”
I don’t think you are in a position to speak for ‘skeptics’. The C of CAGW has to first be removed as there is no evidence of any. It only exists in some peoples imaginations. Imagining something does not cause it to happen.
The A in AGW has first to be demonstrated as to magnitude. The basics of GHG are understood for clear dry atmospheres (as it is explained in schoolbooks). The contribution by A is not, at all, well described or discussed. The story line jumps from simplistic GHG theory to gnome tales. If A makes a contribution to GW, it has proved devilishly difficult to detect. If and when it is detected is not the time to start doing something – we are free to do anything we like any time we like, but no one group in society has a right to impose massive cost and systems of power and control over another just because they think ‘it is time we did something’. They might one day get that power, but first they will have to provide evidence of A and C.
Next is G. G means global and all the evidence we have is that the tropics don’t warm or cool much no matter what the rest of the earth is doing. Is it global warming it the whole world doesn’t warm? Answers on a postcard please because I don’t want to open envelopes.
Last is W. If there is no warming in the first place, why are we worrying about it? The long term trend is down from the peak 8000 years ago. The expected long term trend, based on multiple proxy records of previous ice ages, is down. The trend for the past 1000 years is down. The trend for the past 80 years is constant. The trend for the past 20 years is constant. The 8000 year trend is the most important, read together with the patterns from previous ice ages. Ice age cooling is about 10 C. AGW might amount to 1 C. If we are lucky, 2 C. If we could guarantee 3 C we might get back to the conditions in the Sahara where it is all grazing land. Such land can be farmed. The same happens to the Great Gobi Desert when it is warm enough. This might stave off the worst effects of the coming glaciation, it might not.
As evidence mounts that the sensitivity to CO2 is small, there is no point in investing in anything other than monitoring. That is the insurance premium we should pay now, and no more. Academics will continue to theorise and match their ideas to observations.
That which imperils humankind is unbridled nationalism, materialism and isolationism. Not CO2.
” In fact, it is folks in the poorer regions who are asking for assistance from wealthier countries whose CO2 emissions are going to impact the climate in their countries.”
After much arm twisting, no doubt . . ; )
michel,
“Unfortunately he did not go on to consider how one would take precautions against the consequences of disbelief in Zorastrianism or Islam, which would be equally dire. But alas, one could not believe in all of them.”
Unfortunately for who? It’s a logical treatment, not a theological argument. He set a 50/50 chance (in the logical treatment, not reality-land ; ) for the existence of God. And a: Believe and your in (if He exists): Disbelieve and you’re not, super simple risk/reward factor. A sort of “bare bones” set up, for approaching a special form of risk analysis.
Islam, for instance is well known not to have such a simple reward factor . . Even Mohamed could not be assured salvation. But, any Muslim can consider the logical treatment, as can any atheist . . I think many people get hung up on their own belief status, and fail to approach the logical treatment itself.
But there’s something left out of that set up, which I hope readers will not leave out of their own, so to speak. If an “Abrahamic” sort of God exists, He can, by definition, demonstrate His existence at any time, to anyone. (And can hear them ask ; )
If there’s a big pile of money, the people will try to find ways to access it. If there was a big pile of money devoted to protecting the planet from the zombie apocalypse, people would apply for zombie prevention grants.
PatrickMJD said: “Proof possitive Chris has never seen real poor people as you find in one continent he mentions, Africa. Chris, Africans are more focussed on their next meal, not some assistance from wealthier nations, which basically is a tax on the poor in wealthy countries swelling bank acounts of the rich in poor countries. Ignorance is stong in this one.”
Thanks for your clueless post, Patrick. I’ve lived in SE Asia for 20 years, so have seen many poor people. Duh, of course the individual poor are not lobbying for climate related assistance. Their governments are. And yes, care needs to be exercised to make sure the monies achieve their intended goals, and don’t end up in official’s pockets.
As always, Chris gets the motivations of the skeptics wrong.
What we are waiting for is solid evidence that rising CO2 levels will cause more harm then benefit and that the proposed solutions are going to cost less than any possible net harm that CO2 could cause.
So far the evidence is that CO2 is on net a benefit, therefore any money spent to reduce it’s production is not only wasted, it is harmful.
” In fact, it is folks in the poorer regions who are asking for assistance from wealthier countries whose CO2 emissions are going to impact the climate in their countries.”
Poor people asking for handouts.
Like that has never happened before in the history of the world.
“Skeptics want to wait until there is 100% certainty before taking action on CAGW,”
Not this skeptic. I want to see something that is outside the normal range of weather. When the temperatures get hotter than 1934, come back and make your case again. Until that time, we are still within the normal range of weather and our weather today is very much milder than the extreme 1930’s.
I guess you, and many many others, have been mesmerized by the bogus, bastaridzed surface temperature charts into believing we are experiencing unprecedented warming today, but nothing could be further from the truth.
Without that bogus surface temperature chart, the promoters of CAGW would have *nothing* use to fool the people. One dishonest visual does immense damage to humanity and its progress. Someone ought to pay for this dishonesty. Besides the taxpayers, I mean.
TA, I’m going to wait until we get near the peak temperatures of the recent Climate Optimum, some 3 to 5C warmer than present.
“Chris April 3, 2017 at 6:03 am
Thanks for your clueless post, Patrick. … And yes, care needs to be exercised to make sure the monies achieve their intended goals, and don’t end up in official’s pockets.”
Talking of clueless posts, this is a classic, just like all your others.
Another empty post by Patrick MJD. All hat and no cattle.
This from the poster who just whines about others disagreeing with it.
“Chris April 4, 2017 at 8:07 am”
You claim to have presented evidence of too much warmth is a bad thing, and yet they are just modeled projections. In other words, rubbish! BTW, yes I know what it is like to work on a 40c day, without aircon too. We call that normal weather for Australia, in summer.
Maybe. It depends on various factors, notably cost and risk. I purchase insurance to cover many perils and self-insure against many others.
Here in the San Francisco Bay Area, homeowners typically purchase homeowners policies. But many reject earthquake insurance because (1) the premiums are huge and (2) in the event of the “Big One” it’s unlikely that the insurance industry have the assets to meet the claims.
I also forego flood insurance, because I live on top of a hill 300ft above the flood-prone areas of my city 🙂
“Mike Smith April 2, 2017 at 9:42 pm
Here in the San Francisco Bay Area, homeowners typically purchase homeowners policies. But many reject earthquake insurance because (1) the premiums are huge and (2) in the event of the “Big One”…”
Most of the damage in 1906 was caused by fires started during the quake and by the fire department. Recent big quakes, the damage was greatest where structures were built on reclaimed land or land that was old landfill. As you say, homeowners can’t afford the insurance for quakes.
But like here in Australia, the recent floods in Northern Queensland affected mostly areas that are flood plains, so when it floods, it floods in a big way affecting any property. Locals who live there can’t afford the insurance, so run the risk.
Insuring against climate change, as Chris suggests, is simply ridiculous.
An asteroid hit will cause far more damage and, I think, is something we could possibly stop. If we wanted to. If the issue is stopping existential threats this is where we should invest our money right now.
Climate mitigation begins at $100+ trillion plus. I don’t think it will work. (1) Because it assumes renewable energy, RE, works. Renewable energy is a bad idea in practice. RE systems are intermittent and of low power density. Despite a massive environmental impact nothing indicates they can effectively replace fossil fuels. RE intermittency has not been solved. (2) Climate mitigation measures will harm economic development; especially in Africa where development is most needed.
Nice deflection away from the OP’s main point : climate models do no work, so why should we trust them.
Yes, this is spot on.
They are desperately in search of a government-funded perpetual hyperproject to give all us plebes some minimum salary work once all the middle class jobs have been offshored/outsourced and automated.
Chris, if fries taste good with ketchup would you put ketchup on a chesterfield?
That’s borderline insane! Why would a sane man stain his coat with ketchup because it is pleasing to his palate?
As long as you’re going to entertain such philosophical arguments, go back to the original. If God exists, and you risk eternal damnation if you reject God, then you should accept God just in case. After all, eternity is of infinitely more value than anything finite of this world.
To believe that man’s use of earth’s resources has somehow frustrated the will of God is very prideful, and according to the ultimate precautionary principle, buying into AGW is too risky to consider.
A thing is that God must exist, since existence exists. Contingent existence, such as our material universe, also require the unqualified existence to exist, since these cannot bring themselves into existence. The theological argument is, which one of the various ones humans speak of is the One He that Is (and, logically, there can only be one such with all of the requisite aspects). When you seek this One, and recognize Him, He will make Himself known to you. Don’t try this if you’re trying to mock Him.
The ultimate circular argument. You cannot prove an assertion by restating the assertion.
Since the God hypothesis explains nothing and makes no testable, falsifiable predictions, it’s not science There is just as much if not more reason to suppose that existence is simply a property of space-time, or some other purely physical, non-spiritual supposition.
Which doesn’t mean that faith in a creator of some kind is necessarily anti-scientific, just that it’s at best a metaphysical belief, not a valid scientific hypothesis.
I should add that if God exist, He/She/It would not even want to be discernible or discoverable via the scientific method or any other rational process. At least in Protestant theology, God has to remain hidden from humans, otherwise faith has no value. If the existence of such a Being could easily be demonstrated rationally and through evidence, then faith would have no value. It has to be blind.
As Luther said, “In order to be a Christian, one must tear the eyes out of his reason.” An early Church Father sagely commented, “I believe precisely because it is absurd.”
Thus trying to “prove” the existence of God is not only scientifically impossible, but a fundamentally wrong-headed enterprise, theologically.
“Since the God hypothesis explains nothing …”
Nothing some magical “strings” that generated vast numbers of universes, such that one like ours is rendered inevitable can’t explain, you mean? ; )
John,
M-Theory isn’t magical, unlike the supernatural conjecture of a spiritual creator being. It is scientific because it makes testable predictions and looks for confirmation or falsification in observations of nature.
Positing a creator is anti-scientific because the “hypothesis” not only can’t make such predictions but because it requires just throwing up your arms and giving up on trying to understand reality. Such a supposition just moves the problem back to the conjectured being. Where did It come from?
Supposing a creator answers no questions, but merely shuts down whole fields of scientific inquiry as unnecessary, if not blasphemous.
As noted above, the Scholastic philosophers were fundamentally wrong-headed in trying to “prove” the existence of God logically. Not only can it not be done, but the New Testament “God” wouldn’t even want people to try.
The concept of “God” of course changes throughout the Old Testament, and then again in the NT. In Genesis He walks and talks with people. This jibes with coins showing YHWH riding in a sky chariot, a la Apollo. Like other Old World gods, He was human in image, but much bigger and of course immortal. Then in Exodus, He only speaks through natural or quasi-natural phenomena such as storms or burning vegetation. Yet later in the OT, to see God is to die. In the NT, He sends not just angelic messengers to earth, but His “Son”. It’s unclear of course what Jesus actually meant by using that kinship term.
In any case, again as mentioned, God has to remain hidden in order for Protestant theology, ie justification by faith alone, to work.
I’ll take that as a yes, O string worshiper ; )
Existence is proof of itself.
I’m far more likely (in the UK at least) to insure my property if I have a mortgage – in fact my lender will make a condition of the loan. Otherwise I not only lose the equity in my house but continue to owe the bank too.
But i note that you ignore your flawed insurance analogy and switch instead to claiming that you know warming is bad. But you still ignore the fact that even if it is bad, we don’t pay more to stop somethng abd than the cost of the bad thing itself,
“Huh? They didn’t migrate there, they were born there. So your comment does not make sense. And the vast majority of folks in those countries are not able to emigrate”
Around 300,000 British citizens either live in Spain, or have winter homes there.
Why do they move there?
About 2/3rds of Florida’s population was born in another state.
“Florida contains the highest percentage of people over 65 (17%).[88] There were 186,102 military retirees living in the state in 2008.[89] About two-thirds of the population was born in another state, the second highest in the U.S”
Why do all these elderly people flock there, rather than Minnesota say?
I am also a “snowbird”, who leaves the frozen midwest to spend time in Phoenix with friends (wealthier than I) who have a winter home there. Most everyone I know there are winter residents from Canada, Wyoming, Iowa, Wisconsin and various other northern states. My siblings all moved to warmer climates right out of college.
Chris your narrow and indoctrinated perspective of reality is apparent in your put-downs that substitute for citations and friendly debate.
Pop Piasa – I’ve presented evidence that higher temperatures are projected for tropical locations. I’ve projected evidence that increasing temperatures in SE Asia are adversely impacting productivity, and that those impacts will increase with rising temperatures. I’ve lived in the tropics (on the equator) for 20 years, so am personally familiar with tropical climates, unlike most of those who have commented here.
There have been roughly 50 comments indicating disagreement with my points. Go ahead and look at them, and tell me how many gave citations. Certainly less than 5. Why don’t you call them out for not giving citations, and erroneously accuse me of that?
Regarding your snowbird comments, it’s great that you are able to relocated to get away from cold winters. I lived in Tucson for 4 years so am very familiar with snowbirds. But that is not what I am talking about. I am talking about Phoenix summertime temperatures, not wintertime. And I am talking about working conditions, not retirement. I’ll happily go out and play golf when it’s 95F, but would not want to be working in a garment factory for 12 hours a day at those temperatures.
“Chris April 3, 2017 at 5:50 pm
Pop Piasa – I’ve presented evidence that higher temperatures are projected for tropical locations.”
Projection is evidence? You mean garbage?
Chris, you have presented no evidence that projected temperature increases for tropical locations are in any way valid. In fact, as others here have noted, those increases are nothing but the output of IPCC climate models that fail every test applied to their past “projections.”
Failure to review and acknowledge the many studies listing model failures, while bruiting their “projections,” seems to me to be an exercise in manipulation, not informing others nor in honest argumentation.
By the way, the hot season in Vietnam in no way slowed our combat operations. We wore our boonie hats and drank more water. Similarly, it didn’t seem to slow down Charlie and the NVA.
Chris,
The discussion is suppose to be about the “hot spot”, and why it has failed to show up as modeled. You have adroitly derailed the discussion to an obtuse sidetrack about insurance. Well done.
I would rather discuss the way our fascinating atmosphere works. The more I learn the more wonderful it seems. However, since you insist on discussing insurance, I will ask you, “Would you buy car insurance if you didn’t have a car?” If so, I will sell you hot-spot insurance though we don’t have a hot-spot.
To return to the subject of our amazing atmosphere, I can see no sign it has any sort of “topping point” in an upward, hotter direction. Earth has taken some shots over the past billion years or so, but it is like one of those round-bottomed dolls that always bounces back upright, smiling.
A tipping-point in a colder direction is another matter, and is something to fret about, if you are so inclined. In fact, once Global Warming flops as a way to tax us all silly, ice-age insurance will be the way to go.
Caleb, there are many, many predicted impacts of AGW that have come to pass. 1) Melting of Arctic ice 2) Extreme warming of Arctic air 3) increased severity of rainfall in certain areas 4) melting of glaciers in most regions 5) Earlier arrival of spring, etc. The position of climate skeptics seems to be that unless EVERY predicted outcome of AGW comes to pass, and at EXACTLY the predicted temperatures/sea level rise figure, we should do nothing. Just keep studying and studying. Except of course, that many skeptics on this site are cheering Trump’s planned cuts to science agencies, which means we won’t even be gathering the data that helps us to measure the changes that are happening.
Chris,
You can stop on number 1.), which I have been studying for the past ten years. The ice has always been melting and growing back, but for some reason the Alarmists refuse to look at the evidence that exists for less-ice periods before 1979, even including some pre-1979 satellite data.
All you need to do is trace the routes the earlier explorers took in wooden sailing ships without engines, and it is obvious the waters were relatively ice-free during the latter half of the summer. For example, in 1819 William Parry sailed past 110° W in the channel that now bears his name. How often is that now possible? (Answer: Last summer was one of the few recent summers it could have been done, hugging the coast of Melville Island to the north, and that was only possible during a window-of-opportunity of roughly ten days.) There are other examples of whalers getting pretty far north during that low-ice time (roughly 1805-1820) as well, and some kept amazingly accurate logs. It may have been their overly sanguine concept of how little ice there was up there that contributed to the Franklin tragedy later. (And Franklin made it pretty far north as well.)
A simple understanding of sailing and brief perusal of history should be enough to convince you that some recent “studies”, which portray the arctic as totally ice-bound until recently, are pure poppycock.
As far as 2.) is concerned, we know very little about air temperatures in the arctic in the past, so how can we say if the current meridional pattern’s warming is “extreme” or not?
When you do so poorly on things I know about, I lack confidence when you speak of things I don’t, such as 3.), 4.), 5.), etc.
Chris, every one of your lines of “evidence” is also completely explained by the AMO cycle. The AMO cycle also explains why we cooled from 1945-1980 which CAGW theory does not. You are in denial.
Richard, AMO does not explain the record breaking high temperatures in the Arctic – as much as 20C higher than normal. You are in denial.
So Chris is in favour of more ice,cold air,growing glaciers and later springs. I live in Canada, the second coldest country on the planet. None of those things appeal to me, nor to the many farmers who endeavour to feed the planet through a limited growing season. Additionally, a colder planet is a drier planet, where millions go hungry and poverty rules.So eager to save the planet that there’s no time to think about reality!
Chris, as has been explained to you before, brief surges of warm air are quite normal in the arctic.
The fact that on a single day, temperatures bounced 20C above normal is not evidence that the arctic air is 20C above normal.
Chris: It’s snowing here in Wyoming and forecast to hit 22° F tonight and to snow some more tomorrow. My daffodils will undoubtedly have frozen blooms, as did the cherry blossoms in DC this year. Now, before you object that this is just one year, it was also in the 50 and 60°F range a week ago. It snows until June here on a regular basis. So, what is an “earlier spring”? When it warms to room temperature outside and stays there? When the snow storms stop? Is this everywhere or like most warming predictions, it’s local and no one can predict which areas will get what changes? I’m not seeing any reason to worry. Climate and weather vary widely over the globe. Until such time local predictions can be made with accuracy, there’s no way to know if the outcomes should be feared or cheered.
Chris April 3, 2017 at 9:03 am
The Arctic has not been that much warmer everywhere all winter. Far from it.
This winter saw another common weather pattern, more frequent during winters after super El Ninos. Cold air from the Arctic falls down into the NH temperate zone, bringing unusual cold and moisture. Many places broke cold records during 2016-17.
It’s just weather. And the sea ice extent is just ocean currents following a super El Nino.
And, BTW, Arctic sea ice is headed for the 2SD normal zone this month.
http://nsidc.org/arcticseaicenews/charctic-interactive-sea-ice-graph/
What happened, as climate realists predicted, is that the marginal areas that didn’t freeze over are those which would have melted first anyway. The more interior areas are liable thaw at more or less the normal rate and times.
Contrary to Griff’s forecast of Arctic sea ice extent “sure” to be lower all year and to set a new record low this summer.
John Farnsworth said: “So Chris is in favour of more ice,cold air,growing glaciers and later springs. I live in Canada, the second coldest country on the planet. None of those things appeal to me, nor to the many farmers who endeavour to feed the planet through a limited growing season.”
John, when did I say I want a colder planet? Not wanting the planet to warm is not the same as wanting it to be colder. Canada has 30M people. 2.8 billion people live in the tropics, or nearly 100X the population of Canada.
Chris,
People living in the tropics would benefit from more rainfall, if it came at the right time.
There cannot be any doubt that a warmer world is a better world. Even moreso is it true that more CO2 is better. Four hundred ppm is much better than 280, but 800 ppm would be even better and 1200 ppm best of all.
Arrhenius and Callendar both were convinced that AGW would improve the world. They were right, except that AGW is not in evidence.
“Chris April 3, 2017 at 9:03 am
Richard, AMO does not explain the record breaking high temperatures in the Arctic – as much as 20C higher than normal. You are in denial.”
We have been reliably recording temperatures in the Arctic since when? Who’s in denial?
The precautionary principle is a fallacy. It gives policy preference to the person wheeling out the most lurid parade of horribles while ignoring any kind of cost-benefit analysis.
Worse, the precautionary principle is more like “chicken little”—if the sky COULD be falling or someone shouts it is falling, we must act even without strong evidence or possibly any evidence. It’s the scientific equivalent of “the charges are so serious, action must be taken”.
We don’t take out Earthquake insurance here in New Orleans, but you’d be a fool not to have hurricane coverage except for the lucky few on high ground, you better have good flood coverage as well.
No one practices precaution like insurance companies. Warren Buffet has stated that his insurance business is not seeing any greater impact from adverse weather, nor are they having to raise premiums to cover climate change risks. Maybe Chris knows more about risk than Warren Buffet?
Now there’s an apt analogy. /sarc
In CA earthquake insurance in Sacramento has a deductible of $50K, in a low seismic zone, that is a non-starter.
Would you purchase Hurricane protection in Edmonton?
More likely hailstorms in July!
It depends on how much the insurance costs and how much it helps in a scenario. Adapt if too expensive to mitigate.
Chris,
You find destroying the world’s economy and reverting to the Stone Age analogous to buying insurance? “Renewables” such as wind and solar are not ready to support the energy needs of even poor countries, much less the big ones. Germany has done significant damage to their own economy due to their guilt-stricken “Energiewend” program, many factories have been transferred to other less foolish regimes.
China and India are building coal-fired power plants just as fast as they can.
You posted first, indicating that you were monitoring the site to make sure your employer sees that you are trolling as he has requested. What a waste of time your comments are, nothing more…
Michael Moon, so whoever posts first is a paid commenter? Unless of course, they are a skeptic, then that rule does not apply. What a ludicrous comment. Tin foil hats on sale on aisle 3.
If the house cost $20,000 and the insurance policy cost $40,000 – would you?
We are not all agreed that a) the outcome is clearly catastrophic and b) the cost of avoidance is a worthy investment. It may be that the cost of mitigation in the future is the better choice.
Only a fool buys insurance to protect against a non-threat.
No matter how much the salesman needs his commission.
Your analogy doesn’t really make sense. Why would you take out fire insurance if what you needed was flood insurance because your property was in a desert wash? To insure your car keeps running, are you willing to go out and buy a new engine and transmission for your car because you might blow a tire?
Since it is NOT clear what the thousands of drivers of the climate are, how can you “insure” against them? Choosing carbon dioxide makes no more sense than deciding that you have to ban Christmas because people burn dead Christmas trees.
Actually the insurance analogy is excellent but not for the reasons the OP proposed.
All insurance that I know of is regulated and all insurance relations that I know of prohibit insurance companies from selling insurance when there is no insurable interest. That is, no actual loss will occur.
For instance, I am not married, I have no children nor other beneficiaries therefore no one will suffer or be negatively impacted by the loss of my income if I were do die. There is no insurable interest there.
Entities not subject to financial loss from an event do not have an insurable interest and cannot purchase an insurance policy to cover that event.
Until it is established that AGW is in fact occurring and that the occurrence of such will have a negative financial impact on someone, there is no insurable interest, no predicted loss will occur and no insurance should be purchased to cover the (non) event.
would you take out an insurance policy
=====================
OK, say you pay your premiums via a carbon tax and temperature go up anyways. How exactly do you make a claim for your loss?
Isn’t this fraudulent insurance, where you pay your premiums, but there is no mechanism to make a claim if you suffer a loss?
The Democrats on the panel would counter this rational post by pointing to the 97% consensus. Their aversion to engaging the scientific issues and uncertainties was remarkable.
The origin of the 97% consensus, a Limerick.
Canard: Ninety-seven percent,
on Climate Change give their assent
that it is getting warm,
and they want to conform
and blame CO2, they’re hell-bent.
with the explanation to the origin of the 97% myth https://lenbilen.com/2017/02/26/the-origin-of-the-97-consensus-a-limerick/
Not only is the97% consensus an engineered result, the consensus itself is nothing like what activists are claiming it means.
On the first survey that started the 97% nonsense, I probably would have answered yes to both questions.
Mark,
On Question One, ie whether earth has warmed since AD 1850, I would agree. But most of that warming occurred before the rapid rise in CO2 late in the last century. For that and a host of other reasons, I would not have answered yes to the second question, ie whether humans are “significantly” responsible for whatever warming might have occurred during that interval, unless there be a very low threshold for “significance”.
Doran and Zimmerman (2009) didn’t even ask the critical third question, ie whether whatever warming has occurred from whatever causes is a good thing or a bad thing. Same for the increase in CO2 itself.
Issues quite apart from their cherry-picking 79 out of 3146 respondents in order to achieve 97% accord on Question One.
https://wattsupwiththat.com/2013/12/10/an-oopsie-in-the-doranzimmerman-97-consensus-claim/
Gloateus: Depending on the context, 5% can be significant.
In most studies anything that isn’t trivial, can be considered significant.
Beyond that, the question does not specify CO2, instead it asks if man has contributed, and there are many ways that man influences the climate other than CO2.
I vote for the precautionary principle. Maybe there are no gnomes under the ice caps, but I think that we should spend several trillion dollars to mitigate their effects, because if there are gnomes down there, the results could be devastating.
There are cities under Antarctica, maybe they cause global warming and melt the ice.:)
http://www.dailystar.co.uk/news/latest-news/568409/antarctica-atlantis-found-ancient-city-pyramids-plato-hapgood-civilisation-giza
They don’t know what they found… 🙂
At the Mountains of Madness
Maybe Mann can tell us how one of their tree rings got to Yamal?
@Eric – Mountains of Madness
And herein lies the whole crux of CAGW:
Even young Danforth, with his nervous breakdown, has not flinched or babbled to his doctors—indeed, as I have said, there is one thing he thinks he alone saw which he will not tell even me, though I think it would help his psychological state if he would consent to do so. It might explain and relieve much, though perhaps the thing was no more than the delusive aftermath of an earlier shock. That is the impression I gather after those rare irresponsible moments when he whispers disjointed things to me—things which he repudiates vehemently as soon as he gets a grip on himself again.
You will go broke before you can pay for all the possible precautions.
Bingo.
That’s the idea.
The West is being swallowed up by debt .It’s not a possibility, it’s a dead certainty! What precautions are recommended? The same morons who advocate for AGW mitigation tell us the answer is to borrow more!
If I lived under an icecap, I’d move!
(But I’d have a roaring fire going full-time until I managed to get away. Cold is much overrated. It comes back to my age-old question – what’s so good about ice?)
Forrest: Probably. Just use the words you find to accurately convey your sentiment and let it go into moderation. Words have meanings and some words can’t be easily changed out without losing the meaning.
On the other hand, there appears to be growing evidence solar modulation of cosmic rays may have a significant effect on atmospheric chemistry.
There we go again. Read the comments from that thread.
As the Svensmark paper acknowledges “The effect from Forbush decreases on clouds is too brief to have any impact on long-term temperature changes” and in general there is a growing discrepancy between the cosmic ray prediction [falling solar activity = more cosmic rays = cooling] and the observations [warming].
Imo, there could be a lag generated by the heat stored in the oceans before a cooling trend becomes apparent. I say that in regard to my attempts to predict ENSO region changes. I was having some success until the El Nino firmly set in place. In thinking about that, it seemed that the reason why is that above average heat loads do not dissipate that quickly. That is likely fortunate for life on the planet as it is a basis for stability in the climate system.
Svensmark does not consider that there is a lag. So ‘there could be a lag’ is not part of ‘growing evidence’.
And when you track back and find when they start to deviate – you find the same deviation between land and sea and north and south hemisphere – and it is far from global and there NOT CO2 induced GLOBAL warming.
Because you know what – if it were CO2, it’d be global and it wouldn’t suddenly start – at a date that just happens to coincide with the introduction of clean air acts across the globe.
That it is not CO2 does not automatic mean it is the discredited Svensmark hypothesis.
Poor leaf,
so desperate to prove that its CO2 that you pre-empted your manipulation of solar data, by about 2 years.
History is what it is.
I agree with your premise. I have a guess at perhaps one reason that the presentation of this topic did not generate more of a reaction.
I wonder if the graphic presented was perhaps a little too technical and not enough time was spent explaining what was being depicted. Scientists and engineers would have no problem quickly grasping that graphic, but a non-technical audience may have been less able to understand it quickly without more explanation.
The whole hearing seemed to be ultra-political. One side says “A”. The other side says “B”. That was not an open exchange of opinions or ideas. My overall impression is that the hearing was dysfunctional and achieved very little. That’s just my take; perhaps someone else has a better or more accurate perspective on the political aspects of the hearing.
Don’t get me wrong — I’m glad that (what I consider to be) honest science is finally getting some visibility. I’m just saying…
The positive side to the hearing was that it was obvious that some of the congresspersons have spent the time to become better informed on this subject. That is a big plus in my book. Then there were those who agreed with the alarmist position who clearly show that they have no comprehension on the subject at hand, but will spout all of the talking points. I think that the informed position will win out at the end of the day.
Chris,
If you’re truly worried about the plight of humans living 100 years from now due to a few degrees of temperature increase, I suggest you turn your concern to the plight of humans living right now. I refer to the hundreds of thousands fleeing the Middle East and seeking refuge in Europe. They need your concern and that of the scores of climate experts who spend their time worrying about what might eventually occur at some time nearly a century away when they will all be dead and gone.
It’s not Gnomes, it’s Leprechauns under the Polar Ice causing the heating. Leprechauns can make themselves invisible, which explains why they avoid detection. This also explains the missing hot spot and greater heating in the Northern Hemisphere, as Leprechauns come from Ireland and holiday there too.
“The hotspot prediction is easy to understand. The atmosphere is thicker, reaches higher into space over the equator than the poles, due to centrifugal force of the Earth’s spin. “
It’s more just that the air is warmer. Lower density. Surface pressure is the same (else big winds), so 10 tons/m2 above the tropics occupies more volume that 10 tons/m2 at the poles.
“For example one theory is the balloon measurements are not being analysed correctly, so the hotspot is there, but it is evading detection unless you properly homogenise the data.”
Yes, and homogenisation is very important. It’s not like surface, where you have a thermometer in one place that you can look at whenever you want. With balloons, you get a snapshot of ever different trajectories, once a day at best, and with poor geographic spread, especially in the tropics.
“Another theory I have seen mentioned is that the hotspot is there, but the effect is not pronounced enough to be detectable as yet”
That is a signal/noise issue. It doesn’t necessarily mean the signal is weak, more that the noise is strong.
“Does the absence of a tropospheric equatorial hotspot mean anthropogenic climate models are unequivocally wrong?
The answer is no.”
Indeed. First, of course, the absence isn’t unequivocal. And there vis a range in the models. The relevant part of AR5 is 9.4.1.4.2. It starts:
“Most climate model simulations show a larger warming in the tropical troposphere than is found in observational data sets (e.g., McKitrick et al., 2010; Santer et al., 2013). There has been an extensive and sometimes controversial debate in the published literature as to whether this difference is statistically significant, once observational uncertainties and natural variability are taken into account “
And they go on to provide details. The conclusions
“In summary, most, though not all, CMIP3 and CMIP5 models overestimate the observed warming trend in the tropical troposphere during the satellite period 1979–2012. Roughly one-half to two-thirds of this difference from the observed trend is due to an overestimate of the SST trend, which is propagated upward because models attempt to maintain static stability. There is low confidence in these assessments, however, due to the low confidence in observed tropical tropospheric trend rates and vertical structure (Section 2.4.4). “
So some models may be right, or close to right, for the wrong reasons? Let’s take a mean.
All models are wrong, or close to wrong, for unknown reasons. Averaging would make them more wrong.
If you look at CMIP5, all the models are wrong. Most are very, very wrong. Some (outliers) are closer (as in less wrong). But climate “scientists” don’t use those, only the ones that show the “right” amount of warming.
Nick Stokes
That is a signal/noise issue. It doesn’t necessarily mean the signal is weak, more that the noise is strong.
Excellent. After being told repeatedly in the 90’s and early 2000’s that the warming could NOT be noise because it was TOO BIG to be noise and so HAD to be AGW, now we’re being told that the noise is bigger than the warming after all. Sigh. Can’t argue with a position that won’t stay still and actually be a position.
Different signal. I’m talking, as is Eric, about the tropical hotspot fingerprint.
I’m talking, as is Eric, about the tropical hotspot fingerprint.
Same difference. It was supposed to leap out at us and “prove” the theory, now we can’t find it and the excuse is that the noise is SO much bigger.
“Tropical hotspot fingerprint”
Well, if it’s too close to the beach property, sure there is someone selling an insurance for that too.
“Another theory I have seen mentioned is that the hotspot is there, but the effect is not pronounced enough to be detectable as yet”
That is a signal/noise issue. It doesn’t necessarily mean the signal is weak, more that the noise is strong.
====================================================================
If a signal is insignificantly greater than the noise in a system, that signal will have an insignificant effect upon the system.
This is exactly what skeptics have been saying all along: CO2 warming is present, but insignificant. CO2 warming is nothing to sweat about!
SR
Nobody is saying that the tropical hotspot is important because of its effect on the system. It is supposed to be an indicator. And if there is too much noise, it is not a useful indicator. That is all.
“…if there is too much noise, it is not a useful indicator. That is all.”
Ha ha ha Nick, you’re too much. It may not be “a useful indicator” or it may not be an indicator at all. Doesn’t Ockham’s razor demand we assume the latter, and that we should avoid the former? “Nullius in clamitatio!”
Nick Stokes:
You say
That is a clever use of semantics, but it fails.
As you say, the ‘hotspot’ has no significant effect ON the system. But it is not “supposed to be” anything.
The ‘hotspot’ IS an indicator.
If “there is too much noise” to discern it then that is A VERY USEFUL INDICATION.
The indication is that anthropogenic (i.e. man-made) global warming (AGW) is insignificant because the natural variation (i.e. the noise) with which we cope is so large it swamps our ability to discern AGW.
Please note that the ‘hotspot’ is a rate of warming at altitude in the tropics which is 2 to 3 times greater than the rate of warming at the surface. If we cannot detect the ‘hotspot’ then it is unreasonable to think AGW will be sufficiently large for it to have discernible effects at the surface (i.e. where people live) which has more “noise” than where the hotspot is predicted..
Richard
Footnote:
The pertinent item for information on the ‘hotspot’ is Chapter 9 of IPCC WG1 AR4 and specifically Figure 9.1
The Chapter can be read at
http://www.ipcc.ch/pdf/assessment-report/ar4/wg1/ar4-wg1-chapter9.pdf
and its Figure 9.1 is on page 675.
The Figure caption says;
Figure 9.1. Zonal mean atmospheric temperature change from 1890 to 1999 (°C per century) as simulated by the PCM model from
(a) solar forcing,
(b) volcanoes,
(c) well mixed greenhouse gases,
(d) tropospheric and stratospheric ozone changes,
(e) direct sulphate aerosol forcing and
(f) the sum of all forcings.
Plot is from 1,000 hPa to 10 hPa (shown on left scale) and from 0 km to 30 km (shown on right). See Appendix 9.C for additional information. Based on Santer et al. (2003a).
Only Figures 9.1(c) and 9.1(f) show the ‘hot spot’.
In other words, the ‘hot spot’ is a unique effect of “well mixed greenhouse gases” predicted by the PCM model the IPCC approves. And that effect is so great that the model predicts it has overwhelmed all the other significant forcings.
But as the above article by Eric Worrall says, the ‘hot spot’ has not occurred, and this is indicated by independent measurements obtained by radisondes mounted on balloons (since 1958) and by MSU mounted on satellites (since 1979).
This is a classic. Models generally say X, but we are lucky enough and some don’t say so. If we observe X we are right (we have found a smoking gun), and if we don’t observe it we are not wrong.
In all these cases, which there are plenty, they never tell what other differences happen between the models which say X and those saying not-X. So, when convenient we have the model’s mean, and when not we have diverging lines of evidence.
This graph is from Gavin Schmidt; the coloring is mine.

If using the argument “some models say X and some don’t”, the first thing to ask is whether they differ in ECS or some other relevant metric. And why models differ so much. Observations differ from 0 to 0,2 degrees / decade; models from 0,1 to almost 0,5. So, we decide observations must be wrong, and *some* models are OK. What’s not to like?
Good! But please link to Schmits original graph?
AFAIK the tropical “hotspot” in the troposphere is the result of every warming, not only the impact of radiative GHG forcing. So if the hotspot is smaller than predicted (as the latest Santer-paper shows) this does not mean that the warming was NOT due to GHG but the warming was smaller ( 1.7:1 Models vs. observed) than the mean of the models estimate.
frankclimate:
You assert:
NO! YOU ARE WRONG!
I explain your error by iterating and adding to the footnote of my above post addressed to Nick Stokes.
The UN Intergovernmental Panel on Climate Change (IPCC) explicitly states that your assertions are mistaken. The pertinent item is Chapter 9 of IPCC WG1 AR4 and specifically Figure 9.1
The Chapter can be read at
http://www.ipcc.ch/pdf/assessment-report/ar4/wg1/ar4-wg1-chapter9.pdf
and its Figure 9.1 is on page 675.
The Figure caption says;
Figure 9.1. Zonal mean atmospheric temperature change from 1890 to 1999 (°C per century) as simulated by the PCM model from
(a) solar forcing,
(b) volcanoes,
(c) well mixed greenhouse gases,
(d) tropospheric and stratospheric ozone changes,
(e) direct sulphate aerosol forcing and
(f) the sum of all forcings.
Plot is from 1,000 hPa to 10 hPa (shown on left scale) and from 0 km to 30 km (shown on right). See Appendix 9.C for additional information. Based on Santer et al. (2003a).
Only Figures 9.1(c) and 9.1(f) show the ‘hot spot’.
In other words, the ‘hot spot’ is a unique effect of “well mixed greenhouse gases” predicted by the PCM model the IPCC approves. And that effect is so great that the model predicts it has overwhelmed all the other significant forcings.
But the ‘hot spot’ has not occurred, and this is indicated by independent measurements obtained by radisondes mounted on balloons (since 1958) and by MSU mounted on satellites (since 1979).
In other words,
IF ONE BELIEVES THE IPCC THEN THE ABSENCE OF THE ‘HOT SPOT’ IS A DIRECT REFUTATION OF THE AGW HYPOTHESIS.
However, the reason for the ‘hot spot’ is not unique to to anthropogenic warming and is as follows.
1.
Water vapour is the major greenhouse gas. And the AGW model assumes that as temperature increases so will the amount of water vapour held in the atmosphere.
2.
CO2 is a greenhouse gas, too, so increased CO2 in the air increases radiative forcing to increase temperature.
3.
The increased temperature induced by the increased atmospheric CO2 increases the amount of water held in the atmosphere (because of point 1).
4.
But water vapour is the main greenhouse gas so the increased amount of water held in the atmosphere increases radiative forcing a lot.
5.
The large increase to radiative forcing from the increased amount of water held in the atmosphere increases the temperature a lot.
Points 1 to 5 are are known as the Water Vapour Feedback (WVF). The direct effect on global temperature from a doubling of CO2 in the air would be about 1 °C. And (according to e.g. IPCC) the effect of the WVF is to increase this warming to between 3 and 6.5 °C.
Clearly, there are large assumptions in calculation of the WVF: this is undeniable because the range of its calculated effect effect is so large (i.e. to increase warming of from ~1 °C to to a warming in the range 3 to 6.5 °C).
One of the assumptions is how much water vapour is held in the atmosphere and where it is distributed. Large effects of the WVF are induced by assumption of large increase to water vapour at altitude.
The major radiative forcing effect is in the tropics because
(a) long wave radiation is from the Earth’s surface,
(b) emission of the radiation is proportional to the fourth power of the surface temperature,
(c) the surface temperature is hottest in the tropics, and
(d) cold air holds little water vapour.
Temperature also decreases with altitude and, therefore, the ability of the atmosphere to hold water vapour decreases with altitude. So, small increase to temperature with altitude permits the air at altitude to hold more water. And, therefore, enables WVF at altitude.
The increase to WVF with altitude causes largest increase to radiative forcing (so largest increase to temperature) at altitude. And the radiative forcing effect is strongest in the tropics so the largest increase to temperature at altitude is in the tropics.
This ‘largest increase to temperature at altitude is in the tropics’ is the ‘hot spot’. But the ‘hot spot’ is missing.
This could be because
(i) the assumption of WVF is wrong,
or
(ii) the calculated increase to radiative forcing of CO2 and/or water vapour is wrong,
or
(iii) the calculated ability of air to hold water vapour is wrong,
or
something else as yet unknown.
Whichever of these possibilities is the true, the absence of the ‘hot spot’ demonstrates that the estimates of 3 to 6.5 °C for a doubling of atmospheric CO2 are too high because the effect which induces enhancement of the direct effect of doubling atmospheric CO2 is absent. So, only the direct warming of ~1 °C from a doubling of CO2 can be justified.
And that direct effect is probably mitigated by cooling effects of evaporation from the Earth’s surface. Indeed, empirical – n.b. not model-derived – determinations indicate climate sensitivity is less than 1.0°C for a doubling of atmospheric CO2 equivalent. This is indicated by the studies of
Idso from surface measurements
http://www.warwickhughes.com/papers/Idso_CR_1998.pdf
and Lindzen & Choi from ERBE satellite data
http://www.drroyspencer.com/Lindzen-and-Choi-GRL-2009.pdf
and Gregory from balloon radiosonde data
http://www.friendsofscience.org/assets/documents/OLR&NGF_June2011.pdf
I hope this explanation is clear.
Richard
Richard: I’m not quite sure if you understand the basic physics. How can develope a tropic tropospheric hotspot? It is expected that ANY WARMING at the surface will be amplified in the upper troposphere. The reason for this is quite simple. More warming at the surface means more evaporation and more convection. Higher in the troposphere the (extra) water vapour condenses and heat is released. Any warming would form a hotspot, for more content see http://www.climatedialogue.org/the-missing-tropical-hot-spot/ . The reason why the AR5 only sees a hotspot due to GHG radiative forcing is simple: in the model mean (MM) of CMIP5 only GHG produce a forcing big enough to form a hotspot. The MM does not include natural variability that would be able also to produce an amplified warming nor is included a forcing ( solar ect) that could it also.
Your explanation why I’m wrong is long, anyway not sufficient 🙂
frankclimate;
It is very clear that you don’t understand the stuff you are parroting on behalf of whomever pays you.
I fully understand the physics of the tropospheric ‘hotspot’ and took the trouble to explain it for you.
Clearly, you have not read my explanation because it says,
etc.
but you have replied saying
DISPUTE MY EXPLANATION IF YOU CAN BUT UNTIL YOU HAVE READ IT STOP PARROTING NONSENSE.
And while you are reading it ponder this because it demonstrates you are parroting nonsense.
If the IPCC is right that the ‘hotspot” is an effect of “well mixed greenhouse gases” then the absence of the ‘hotspot’ demonstrates there has been no discernible warming caused by “well mixed greenhouse gases” since 1958.
And
If you are right that the ‘hotspot” is an effect of “ANY WARMING” then the absence of the ‘hotspot’ demonstrates there has been no discernible warming caused by anything since 1958.
Richard
frankclimate,
what it shows is that the process the models use is wrong. it is as simple as that. for the models to have correct weighting, but just be wrong on the outcome as you suggest, they would be forced to remove the water vapour feedback component used (from ANY warming). since surface warming is occurring, yet the hotspot is not, then the function of the feedback cannot be as the modelers portray.
the satellites etc show clearly less water vapour in the upper troposphere than the models predict. the models predict this based on feedback the authors plug in. the reality is that the models are so wrong about the co2 climate sensitivity because of this. the lack of a hot spot proves that beyond doubt.
of course the lack of the hot spot does not determine the cause of the warming, but it puts beyond doubt the lack of understanding of the climate system the modelers have, and the robustness of any result from their models.
Richard: Your shouting is a little bit boring indeed! Foremost it dosen’t change much on physics! How do you think the upper troposphere could decide from which source the warming comes and responses in another way to the warming from GHG or other possibilities?? Another possibility would be that the models overestimate the water vapour feedback just as it assumes “mohbici”. This is a nobel option and this could solve the problem that the hotspot is much smaller than estimated. But ( a great But): this would be the case also for EVERY warming. The smaller warming of the upper tropic troposphere than expected is NOT a sign of no warming due to GHG but perhaps a sign of an overestimation of wv-feedback due to every warming. And please: cool down and stop shouting. It makes your posts ugly.
frankclimate:
I repeat:
READ WHAT I WROTE FOR YOU AND DISPUTE MY EXPLANATION IF YOU CAN BUT UNTIL YOU HAVE READ IT STOP PARROTING NONSENSE.
Richard
All of the climate models predict the Tropical Troposphere Hotpot in almost exactly the same way. It is scary how similar the numbers are..
It is almost like they all copied the code from the original climate model or they are all building in the same effect regardless if their model does something different.
They are ALL tightly centred on producing 27.2% more warming in the 2TLT tropics troposphere than at the tropics surface. Its like a “miracle” that all these independent models would have such a tight dispersion around this value.
The right panel from Thorne et al 2011.
http://trac.arl.noaa.gov/documents/JournalPDFs/ThorneEtAl.WIREs2010.pdf
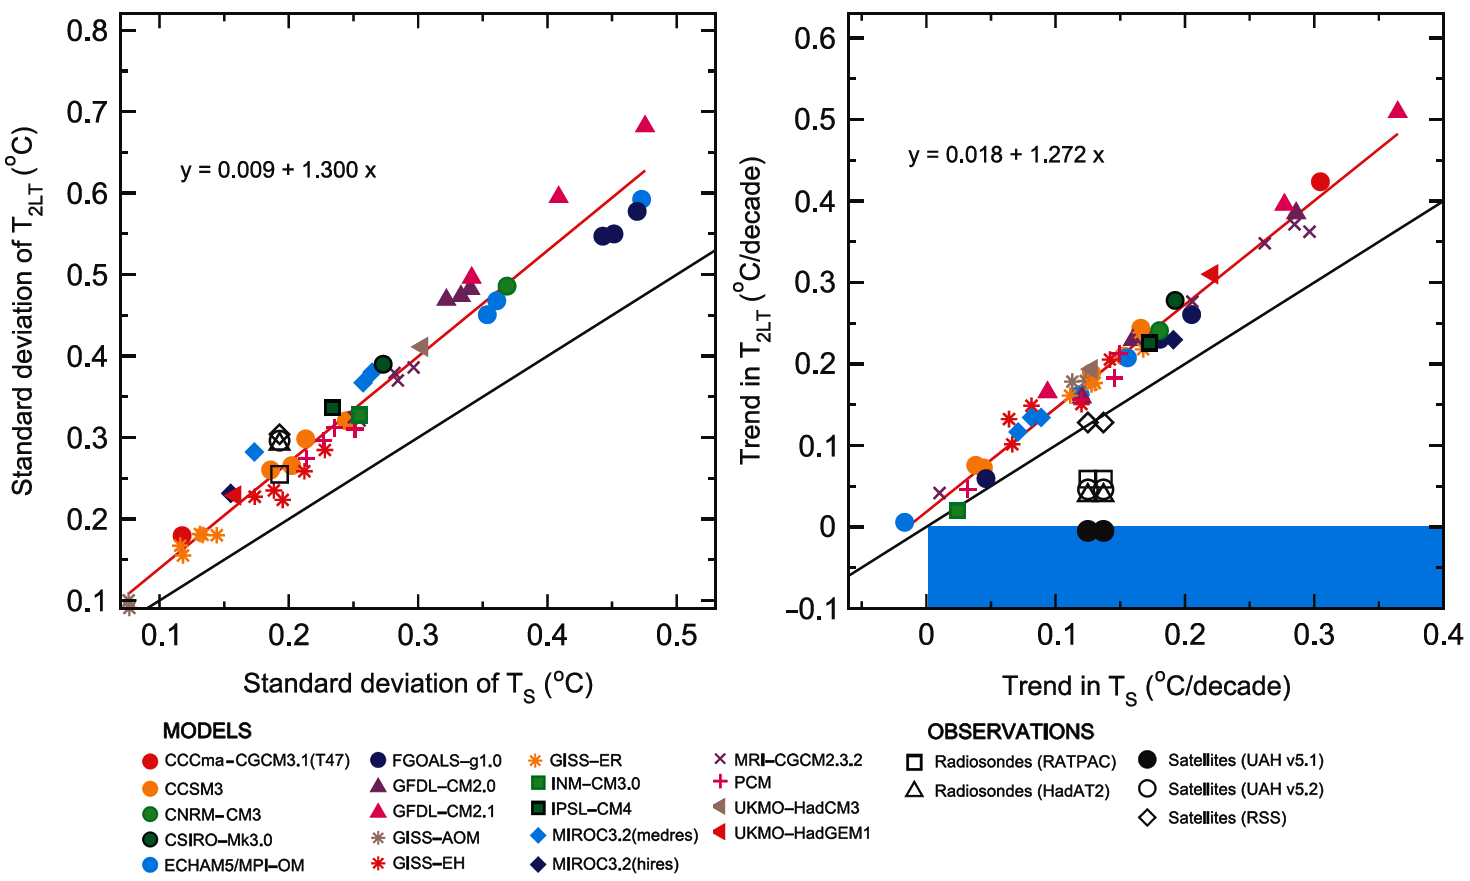
A simpler explanation for the mid-troposphere hot spot is because the radiative model causes heating from above and below, hence the localised “cooking”. There are two major problems with the radiative model:
1. it doesn’t reflect the way the Earth transports heat, which is by convection. *
2. They uniformly predict things that don’t happen. No mid-troposphere hot spot, no global warming for the last 20 years.
* Conduction at the surface warms the atmosphere, which then carries that heat upwards and outwards by convection. Look at how thunderclouds form in America’s grain belt.
Convection is indeed how the surface cools through tge troposphere. Words have meanings, troposphere means a mixed sphere, compare and contrast with stratosphere which is ordered logically with coldest at tropopause. Also, water vapor (a gas), has great difficulty getting past the t-pause due to relative humidity trap of the lapse rate..it does in small quantity where its dilution and molecular weight brings it to the next layer with a lapse rate..the mesosphere. It can condense into dynamically stable clouds during hemispherical summer months. These are noctilucent clouds and yes, mesosphere weather. But the low pressure means it is not an important heat transfer mechanism unlike troposphere weather.
In closing, the models are wrong because heat transfer mode depends on altitude. It is linearized in the models over each distinct layer. This is worse than using 3 as an approximation for pi.
UAH Tropics Troposphere is just 0.03C in March 2017. That would not exactly be a “Hotspot”.
This is the last down-dip from the 2015-16 Super El Nino so this would be more-or-less ENSO neutral now. There is still a small positive impact from the AMO but that is for another day.
Nick writes
ARGO by comparison is once every 10 days with different trajectories and is sparse. But it seems to manage to measure temperature changes to the degree we can see trends.
Forrest Gardener: You said: “Nick is there any part of the consensus science which you will not defend?” Nick’s defenses are, for the most part, reasoned and polite. A lot better than I can say about many on either side of this debate. I encourage Nick to continue to post his rebuttals here as it provides a forum to test a point of view and it proves that reasoned debate is acceptable to at least one side of this argument. Regarding this thread, his point about “thickness” of the atmosphere is dead on. It isn’t absolute distance or concentration that is important in radiative absorption, but the product of the two. As such, an atmosphere at 100 kPa and 400 ppm CO2 will have the same radiative impact whether is is cold and thinner or warm and thicker. Mosher probably got tired of the knee jerk tirades against him. He still posts regularly at Dr. Curry’s sight.
Nick is right that the tropopause is higher in the tropics not because of centrifugal force but because the atmosphere is warmer in the tropics. However, “That is a signal/noise issue. It doesn’t necessarily mean the signal is weak, more that the noise is strong.” If the noise swamps the signal, the signal is, by definition, weak.
“…homogenisation is very important. It’s not like surface, where you have a thermometer in one place that you can look at whenever you want. With balloons, you get a snapshot of ever different trajectories, once a day at best, and with poor geographic spread, especially in the tropics.”
You have made an assertion that homogenization is important, but your reasons for it is because of sketchy incomplete data. I assert that no matter what you do with sketchy incomplete data, you’ll end with sketchy, incomplete data. Hard to make good jewelry starting out with tin. I wouldn’t try it anyways.
Actually, warm air does rise, Nick, but a fluid flows under the influence of the spin as well. It may not be huge, but it will be there, and you know that as well. Why pretend it isn’t? As for the “hot spot,” I have seen enough references to it, and enough “lame” defenses of its not being there, to know that here lies something that you “deniers” want no one to look at in the first place. It IS nice to see you tell me that the program models didn’t estimate it correctly. Having pointed out the fact that the models blew it on yet another point is enough to make me question the rest of their “predictions.”
Typically, only in baseball does it take 3 strikes to create an out. I would have to say that in the real world, if I was counting on an analyst to give me accurate information to bet a fortune on, he wouldn’t be around after the 2nd blown prediction, but you folks want the world to bet a fortune on something that has predicted nothing with accuracy. Be honest. Climate is basically “long term weather,” or there wouldn’t be a lot of noise about “extreme weather.” Since you can’t predict weather 100 days in advance that I can count on, why would I believe you could predict climate 100 years from now?
Forrest: It would be better if you left the anger and hatred to those whom you disagree with. The CO2 wars have nothing to do with science. They have everything to do with control. The appropriate question for Nick is why he wishes to see the poor get poorer and the rich get richer. He continues to advocate for policies that accomplish both. His science is fairly well thought out. The consequences of following his preferred actions. Not so much.
Eric, nice analogy, but your confuse “theory” with “hypothesis”
“nobody has yet managed to unequivocally detect that predicted hotspot.”
Remember how the pause was causing an epidemic of climate blues among climateers of a certain age because of classic psychological деиуал. They couldn’t face the fact that they may have spent half a lifetime in useless work so they rationalized that they were ill because they saw the end of the world happening and no one would listen. What did they do about this elephant in the room? They got a guy about to retire to just jerry-build the record to erase this terrible pause. Believe it, they are going to torpedo this very embarrassing hot spot problem. Let’s see, Trenberth is about 70 now, ready for retirement and he has been chasing hot spots for about half a dozen years. He will take one for the team, retire on a fat pension and maybe push the end game past the end of his life.
“They got a guy about to retire to just jerry-build the record”
Actually, Karl didn’t remake the record. That’s the silly thing about the fuss. All his paper did was to note that if you took proper account of the known ship/buoy difference (which they have to do at some stage) there is less slowdown in trend.
The paper that brought out ERSST V4 was Huang et al, 2015. Karl was not an author.
Nick Stokes;
Actually, Karl didn’t remake the record.
Which is why the Obama administration barely said anything about it. Oh wait….
“Oh wait…”
OK I’m waiting. What did they say?
Nick Stokes;
OK I’m waiting. What did they say?
Oh don’t be precious. They were yelling about it before the ink was dry. They jumped on it so fast that people smelled a rat and started asking questions as to coordination between Karl and White House for political purposes. Congressional committees were asking for email records and were defied. Gimme a break Nick.
The time to abandon a failed model is ASAP. Hubris of the sunk cost eats at the soul of every Don Quxiote but realize said sunk cost is GONE. Accept failure, learn from it and drive on.
While my education background is physics, I received far more liberal arts and classics AND APPLY IT. For the record, Keynes was a hack who was perverted by Fabians who were nihlists attacking the Austrian School.
I would be interested in anybody’s take on this:
“Comparing Tropospheric Warming in Climate Models and Satellite Data”
http://journals.ametsoc.org/doi/full/10.1175/JCLI-D-16-0333.1#
You can’t find the hotspot because the gnomes are dispersing the warm air before it gets warm enough to be detected. The gnomes are in balloons, high in the atmosphere, and are using big fans to waft the warm air to the poles.
Leprechauns dispersing the hot air produced by the gnomes makes more sense.
Eric, Willis didn’t convincing prove anything about the sun’s climate control.
In 2014/15 I put together a working solar climate model which I used to predict in 2015 the temperature drop in 2016 from lower TSI in 2016 to ultimately within 3% error.
Variable solar radiation, ie TSI, is responsible for warming and cooling, not CO2 or cosmic rays.
Cosmic ray theory is as bad as CO2 theory – no real-world real-time supporting evidence.
I have a solar theory that works! It’s a mathematical model based strictly on the relationships between SSN, F10.7, TSI, and SST/OHC.
I can and will convincingly prove that the sun controls the weather and climate, using simple code and basic empirically data derived rules of solar sensitivity, furthermore, I will provide evidence that strongly suggests that all the rapid warm-ups during the Holocene were solar driven, and to top it off, will unveil a prediction system based on long-term solar activity forecasts.
As for Willis’ failures, don’t take it so hard. Most people who used similar ideas also failed, because one basic rule to know that wasn’t is temps aren’t going to be the highest on the day of the highest SSN or TSI,ie, that a solar driven temperature rise from a SSN/TSI spike is registered after the fact of the higher solar activity, for reasons I’ll get deeper into in my solar paper.
The simple fact is ‘global warming’ since 1850 (or any other time) was a result of high solar activity that persisted for decades.
Sunspot activity was 65% higher for 70 years from 1935 to 2004, the end of the modern maximum, than for the previous 70 years from 1865 to 1934, annual averages of 108.5 vs 65.8. The sun was hotter for 70 years.
The IPCC, Leif, and Willis apparently all think the earth can absorb higher solar radiation for 70 years without warming up.
The hotspot isn’t there because their theory is wrong. CO2 does not control the climate, the sun does.
The use of the solar wind has been invoked to explain modern and antecedent warming and cooling through natural, non human, causes.
https://www.youtube.com/watch?v=l-E5y9piHNU&feature=youtu.be
I find this convincing, but do not have any idea if the transformations and data have been checked by any other scientist.
Occasionally we are told there is no relation between sunspots and climate on earth.
This pharmacist claims a relationship between the solar wind and Earth’s atmospheric temperature that is sufficient to explain the recent and historical changes.
He identifies a number of cycles in climate which when added, follow temperature variation.
It would appear to be reasonable to look for a solar signal.
physicist
Bob, furthermore, willis’ link compares the solar cycle to sea level rise data. (hardly what one would call “convincing”) Even svalgaard is in agreement that there is .1C swing in temperature during the solar cycle. It’s just a matter, then, of ascertaining whether or not sustained higher solar activity causes further warming…
Afonzarelli, the 0.1C solar swing is a standardized version of reality – every cycle is different, thus the temperature signature of each solar cycle will vary from the extremes, duration, and proportion of high vs low TSI over time during each cycle.
I think part of the IPCC and others’ problem(s) is treating all cycles as though they are the same.
I think part of the IPCC and others’ problem(s) is treating all cycles as though they are the same
As the TSI variation is so small, its impact on climate will also be small.
http://www.leif.org/research/TSI-Reconstruction.png
The blue curve is the invalid NOAA record used by climate modelers.
Dr Svalgaard you are in for the treat of a lifetime, finding out just how wrong you are!
silly comments without supporting evidence are just pollution of WUWT.
“As the TSI variation is so small, its impact on climate will also be small.”
…is the first wrong assumption.
Failure to pay attention to daily TSI variation and what it is doing to the earth is everyone’s loss.
I agree with you on the CDR. If you recall it was I who dug up their discrepancy with SORCE.
SORCE is running hot now, as you know. It’s 15% higher now in its variation off the ’03-15 statistical norm, typically 0.1 to 0.15 W/m^2 higher than that ‘norm’ for recent post-cycle max F10.7cm flux, yet not outside the bounds of prior activity.
Failure to pay attention to daily TSI variation and what it is doing to the earth is everyone’s loss.
Nonsense. Climate is a 30-year average. Daily variation is irrelevant on that scale.
If you recall it was I who dug up their discrepancy with SORCE.
I don’t recall that. The discrepancy goes back much earlier.
The full story is here:
http://www.leif.org/research/EUV-F107-and-TSI-CDR-HAO.pdf
Leif to me the silly comments are those made in defiance of all logic and common sense, such as your oft-stated comments that solar variation doesn’t cause net temperatures changes over the course of several very active cycles.
You have to be silly to believe in your’s and IPCC’s fairy tale that the earth does not respond to solar activity.
The SC24 TSI max and subsequent temp spike was one such clue… and there’s so many more!
Leif to me the silly comments are those made in defiance of all logic and common sense,
Your so-called logic and common sense fade away when compared to what the data actually say and rather become wishful thinking.
doesn’t cause net temperatures changes over the course of several very active cycles
We have had runs of very active cycles in every one of the centuries over the past 400 years.
The temperature changes don’t match the solar record, regardless of what your common sense and wishful thinking tell you.
Failure to pay attention to daily TSI variation and what it is doing to the earth is everyone’s loss.
“Nonsense. Climate is a 30-year average. Daily variation is irrelevant on that scale.”
You will never understand why your’s and the IPCC’s solar perspective is wrong by ignoring daily variations.
To me you and the IPCC are not even being the least bit scientific.
You should always start with your input power and see what happens with variations in that first, not make all these grand theories and force everyone into a faulty position, which you and the IPCC do wrt the sun.
Every day TSI leaves a distinct terrestrial signature. I’ll tell what they are in my paper.
Your assumptions are faulty. Daily variations don’t just matter – they’re just as essential to understanding climate as is long term data.
You are lost in your own sophistry Leif.
You will never understand why your’s and the IPCC’s solar perspective is wrong by ignoring daily variations.
I don’t see why the IPCC has anything to do with me.
Daily variations integrated over long time make up climate. A single day does not and has no signature in the climate record. Except, of course, when a volcano like Pinatubo explodes, but that is another story.
I’ll tell what they are in my paper.
What peer-reviewed paper are you babbling about?
Bob Weber:
If you recall it was I who dug up their discrepancy with SORCE.
It was first pointed out by me in my talk at the SSN workshop in Tucson in January, 2013 (slide 7)
http://www.leif.org/research/SSN/Svalgaard12.pdf
but was known already at the end of 2011.
It has the advantage, and disadvantage, that it is not human-caused. Advantage, because it means we don’t need to spend trillions in a futile attempt to destroy the world’s economy. I mean cut CO2 output & thereby save the world.
Disadvantage, because it means we don’t need to spend trillions in a futile attempt to destroy the world’s economy. I mean cut CO2 output & thereby save the world.
I mean, what sort of climate “scientist” would go for the one that has no grant money attached ?
Gary Pearse 8:18pm
+10
Eric Worrall:
You listed 3 causes of global warming, then admitted that we really don’t know what drives the climate..
I have identified the cause in my post Climate Change Deciphered. Google it.
If you don’t agree, then refute it.
Or a URL.
Forrest Gardener:
O.K.
Here’s the abstract: “New observations conclusively prove ALL of the anomalous warming that has occurred from 1975-present has been due to the removal of dimming Sulfur Dioxide (SO2) aerosols from the troposphere, either due to business recessions, or to EPA-driven Clean Air efforts.
With all of the warming accounted for by the reduction in SO2 emissions, there can never have been any additional warming due to Carbon Dioxide (CO2) or other “greenhouse gasses”.
Forrest Gardner:
You will have to do some searching if I give you the site URL. However, simply Googling “Climate Change Deciphered” will take you directly to the essay.
I agree very much with the points made, but I feel they are vastly understated.
A hypothesis is advanced to explain an observed phenomenon. A theory must be able to generate testable predictions. If the predictions fail, the theory is wrong.
As I used to say in Chem Lab: “Not flawed, not faulty, Just Plain Wrong. In Sociology, the theories are flawed and faulty. In Chemistry, your theories are WRONG.
Then:
True enough.
BUT:
The tropospheric hot spot is *not* a secondary effect. The hot spot is at the core of the Greenhouse Gas theory of Global Warming. It is absolutely central to how the Earth’s greenhouse works. When this one central prediction fails, the whole theory is thrown into grave doubt.
To be fair, there are at least a few ways out, the most obvious one:
The warming we are seeing is not greenhouse warming.
The tropical tropospheric hotspot is not a central part of AGW theory. It depends on the water vapor feedback being as strongly positive as predicted by no change in global atmpsheric relative humidity, along with a positive feedback from change in cloud albedo.
I think that positive cloud albedo feedback requires (from warming) decrease of global average atmospheric relative humidity, so that the combo of water vapor and cloud albedo feedbacks is the same as (maybe slightly less than) the water vapor feedback alone would be with constant global tropospheric relative humidity. The tropical upper troposphere hotspot of warming depends on a great increase of water vapor in the tropical troposphere causing a reduction of the wet adiabatic lapse rate in the tropical troposphere, as I see this.
The climate models appear to me as poorly tuned rather than totally wrong. I see the climate models as being tuned to hindcast mostly 1975-2005 without consideration of a natural cycle or cycle set that shows up in most global surface temperature datasets, especially global surface temperature datasets that don’t use a recent American outlier sea surface temperature dataset. (ERSSTv4, or maybe also the recent “high res” variant of Reynolds OI.)
It seems to me that climate models, if they were tuned to have manmade warming from 1975 to 2005 being about .2-.22 degree C less than “determined” in the CMIP5 and similar ones, would predict a tropical upper troposphere warming hotspot so minimal that measurements failing to show it are not statistically significantly different from having shown such a small extent of it existing.
Unfortunately it also seems to me that they would then utterly fail to explain the warming from 1975 to 1998.
In the end the point is far more serious and cannot be fudged: you can’t fit a smooth logarithmic relationship between CO2 and temperature to a data set shaped like a mesa.
And that is the real point: To fit the early part requires high climate sensitivity and implies a significant hotspot. to fit the later part requires a much lower sensitivity, to the point where co2 induced warming is of academic interest only.
This is the elephant in the room: All attempts to ‘save’ AGW result in it becoming less catastrophic with every year that passes. And politically, mild to insignificant man made global warming is as useful as a chocolate tea pot.
If it is ‘saved’ to fit the data, it’s not alarming. If it stays alarming it doesn’t fit the data.
The only way to save the theory and keep it alarming is to fix the data.
Go figure.
Albedo from clouds is secondary to the primary heat transfer from evaporation. Water vapor is strongly bouyant. Enthalpy of vaporization is also very high thanks to hydrogen bonding.
Global relative humidity? PLEASE? How about global PRECIPITATION!!! But also virga? Clouds are often signs of intense heat transfer with their altitude being a “hole” through insulation. Model these as Perkins Tubes ( a type of heat pipe which is gravity assisted).
Leo smith: The effect of CO2 can’t be made to fit all the data because it is not the only factor. There is a natural cycle, that (even if only temporarily) had a period around 64 years and a peak-to-peak amplitude around .2-.22 degree C. It was on an upswing from the early-mid 1970s to around 2005, and has been on a downswing since. If the CMIP5 models get toned down so as to underhindcast by about .2-.22 degree C the warming from the early 1970s to 2005, and then a sinusoid with peak-to-peak amplitude of .2 degree C and period of 64 years and peak at 2005 is added to such a fixed CMIP5 output, then such a fixed CMIP5 forecast would be reasonably accurate as long as the natural cycle’s amplitude and frequency holds up.
TonyL
“The warming we are seeing is not greenhouse warming”
Precisely. Google “Climate Change Deciphered” for the actual cause of the warming.
The atmosphere is only slightly thicker over the equator than at the poles, but the troposphere is a lot thicker over the equator than at the poles. This is because around the equator is where widespread warm ocean favors tall tropical thunderstorms and systems of them (such as tropical cyclones) favors convection to higher altitudes. The tropopause is generally below the 300 millibar level in polar areas in winter and around the spring equinox, and generally around or above the 100 millibar level in tropical areas where tropical weather is prevailing. The altitude of the tropopause is often around or below 8 km above sea level in polar areas in winter and around the spring equinox, and gets as high as around 20 km in the tropics. This difference is not mostly explained by thermal expansion from absolute temperature through the troposphere being 25-30% higher in hot tropical areas than in cold polar areas, and it is not explained by the equator having centrifugal force around .5 % of equatorial gravity – even at 20 km above sea level.
This difference is not mostly explained by thermal expansion from absolute temperature through the troposphere being 25-30% higher in hot tropical areas than in cold polar areas, and it is not explained by the equator having centrifugal force around .5 % of equatorial gravity – even at 20 km above sea level.
correct. Why is it that our arguments are always marred by nonsense like this?
It was the reference to ‘centrifugal force’ to explain the higher tropopause at the equator which horrified me.
My high-school physics teacher would have been flexing his ruler, for a swift tap over the knuckles.
A very simple prediction of global warming is that the atmosphere will expand – in effect the atmosphere acts as a temperature gauge. This means that we should find the same pressure levels significantly higher up in the atmosphere. If anything the evidence actually suggests cooling.
Can you give citations for trend in global-average height of the 500 millibar level or any of the other major-noted troposphere pressure levels (or an around-tropopause one) such as 300, 700, or 850 millibar levels to cite cooling? Please keep in mind that about 70% of the mass of Earth’s atmosphere is under the 300 millibar level, and about half is under the 500 millibar level.
Since we do not know if the climate will be warmer or colder on the long run, we don’t know which insurance we need. Against cold or warm? Or both? And if we get an ice age, what do we make with a bundle of money? How long does a fire last from a bunch of Dollars.
Willis, your position on the absence of the hot spot is untenable. Your position is akin to a prosecutor who without any evidence of guilt has arrested a person for a criminal offense yet continues the arrest and prosecution because there is no one better to accuse.
The presence of the mid-tropospheric hot spot is the cardinal prediction of the climate models for the past three decades. The absence of this predicted finding from all existing current data sets is an indication that CO2, natural and anthropogenic, is not the primary driver of the observed heating and the current climate models are false.
Do the models actually require CO2 to model the observed temperature patterns? Perhaps not, Dr. Christy said it best in his testimony before congress “The models without extra greenhouse gasses reproduce the actual observations very well.” (see https://youtu.be/_3_sHu34imQ at 27:45-53) Clearly, the concentration of CO2 in the atmosphere is increased, and it is one of several known greenhouse gasses, but either the sensitivity to CO2 is grossly exaggerated in the models, or the actual “Greenhouse gas effect has natural secondary negative feedbacks, negating any extra warming effect.
Are the current climate models only “Slightly wrong?”
The answer is “No,” they are grossly in error.
Your example of Newtonian gravitational physics regarding orbit of Mercury is a straw man fallacy. Perhaps if your gravitational model predicted the presence of a gas giant alongside the perturbations of Mercury’s orbit, then your example would be apropos.
The continued insistence on and making excuses for the current failed climate models has paralyzed climate science from progressing to an accurate model and ultimately is harmful to the science, the country, and the world population especially the poor and vulnerable.
Since Willis didn’t write this article, you’ll be a long time waiting for a reply. 😉
In order for their catastrophic predictions of the future to make any sense the global warming alarmists must deny these 3 things. And they do
1. The Medieval Warm Period – If it was warmer than now in very recent history yet no catastrophe occurred then the claims of this level of warming leading to catastrophe fall apart.
2. The Tidal Gauges – If there has been no measured increase in the rate of sea level rise during the industrial age then there was no significant man made global warming
3. The Lower Troposphere Satellite Measurements. – If the rate of warming in 1980’s was greater than the rate of warming in the 2000’s despite massive increases in human co2 production then the feedback loop theories fall apart
All of the heat feedback theories are completely disproved by tge fact that we’ve gad as high or higher temperatures before, and no feedback has ever occurred.
This is the major cornerstone of the alarmist CAGW cult, and it is so obviously erroneous, it almost hurts to hear it.
This is so obviously correct but almost nothing is made of it, yet that’s the ‘runaway’ warming theory FALSIFIED right there. You could almost say it kills 97% of scary AGW predictions. It really should be the killer stat’ that puts AGW to bed for good.
The big problem I see in climate models such as most of the CMIP5 ones and their likes: They were tuned to hindcast the past, and the CMIP5 ones have their transition from hindcast to forecast being at the transition from 2005 to 2006. And they were tuned with extra concentration on 1975-2005 as what to hindcast correctly, using factors that exclude natural cycles such as the Atlantic Multidecadal Oscillation and a likely loosely-linked Pacific item that shows up in multi-year-smoothed ENSO indexes and the versions of PDO index that have better correlation with multi-year-smoothed ENSO. So, the way I see it, the climate models consider about .2-.22 degree C of the warming from 1975 to 2005 as being manmade but I see that amount of warming in 1975-2005 as from a natural cycle or set of natural cycles.
Something I suggest looking at: Use Woodfortrees and use any global temperature dataset other than the American ones that use the outlier “Karl Pausebuster” ERSSTv4 for sea component. Choose a start date anytime from 1972 to 1979, endpoint date anytime from 2013.5 to latest available as of now, and midpoint between two linear trends anywhere from 1997 to 2006. Choose a midpoint date that gets the two linear trends to have ends meeting. When I have done this, I mostly came up with 2003-2004, sometimes early 2005 as being when the Pause/Slowdown started. And have a look at the periodic cycle whose period is around 64 years that shows up in all global surface temperature datasets with start date no later than 1900, especially ones other than modern American ones that use ERSSTv4. I favor HadCRUT from the UK as being “least overcooked”.
Donald writes
That’s not the big problem though. That’s fluffing around the edges of the big problem which is that they need to be tuned at all. If the results dont emerge from GCMs without having to be tuned to best suit the time we’ve been observing then there is no reason to suspect they’ll do any good for the time’s we’ve yet to observe because the system that is the climate is going to change…but not necessarily in ways we expect or have seen.
“I mostly came up with 2003-2004, sometimes early 2005 as being when the Pause/Slowdown started”
Very nice Donald!
You found the end of the temperature rise driven by the modern maximum in solar activity that ended in 2003-4, according to my solar calculations.
Which is why I say
The cause of the pause was the cause before the pause.
The sun.
There ia no real evidence that the radiant greenhouse effect that the AGW conjecture depends upon even exists. As derived from first principals, the surface of the Earth is 33 degrees C warmer because of the atmopshere because of the heat capacity of the atmosphere, the depth of the troposphere, and gravity. These elements in effect form a convective greenhouse effect and are not a function of the LWIR absorption properties of some of the trace gases in the atmosphere. 33 degrees C is what has been calculated and 33 degrees is what has been measured. There is no additional warming caused by a radiant greenhouse effect. A radiant greenhouse effect has not been observed anywhere in the solar system. The radiant greenhouse effect is nothing but science fiction as is the AGW conjecture. If CO2 really affected climate then the increase in CO2 over the past 30 years should have caused at least a measureable increase in the dry lapse rate in the troposphere but such has not happened. The lack of a hot spot is just another example of the non-existance of the radiant greenhouse effect.
Yes indeed, wilhas. that is the simple truth. No ‘ghgs’ (unlikely) would have needed atmospheric bleed-off to equilibrate T. That would mean no atmosphere left to speak of. But no matter, because life would never even start without various molecules including some ‘ghgs’.
The equivalent radiating altitude is set at the mass altitude centroid of the atmosphere and has nothing to do with the LWIR absorption properties of some trace gases. In the IPCC’s first report, they published a wide range of guesses at the climate sensivity of CO2. In their last report, the IPCC published the exact same wide range of guesses. So after more than two decades of effort, the IPCC has learned nothing that would allow them to decrease the range of their guesses one iota. If they were able to observe how changes in CO2 affected the effective radiating altitude then they would have been able to at least narrow the range of their guesses but such has not happened.
willhaas April 2, 2017 at 9:48 pm
How would you explain the temperatures on our moon then?
Hot sunny side, cold dark site. Receives the same amount of sunshine as earth does, reflects even less, yet its average surface temperature a mere 197K.
Adding an atmosphere and increasing its rotation rate a little would not increase its temperature to earth like values.
So the real question is, why is the average temperature on earth >90K higher than the moons average temperature.
The convective greenhouse effect has been observed on all planets in the solar system with thick atmospheres. The moon does not have a thick atmosphere so the convective greenhouse effect does not apply.
The Effective temperature for the moon is ~270K, compared to the ~255K for earth.
Why is the moon ~73K BELOW its Effective temperature?
What does this say about the ~255K calculation for earth?
Does the convective greenhouse effect increase the temperature on earth ~90K as that is the temperature difference between the moon and earth?
Another very simple prediction is that the atmosphere will expand – and as a result the pressure levels will rise. Instead the only evidence I’ve seen suggests the reverse for the troposphere as a whole. That means on average there’s been more cooling of the troposphere than warming.
Small correction. The pressure doesn’t rise when the atmosphere expands due to heating. It remains exactly the same. It expands because of thermal expansion, not because there is more of it.
The levels at which a particular pressure is experienced will rise.
Crispin, I think Scottish Sceptic is already correct about this and needs no further correction. According to the kinetic theory of gases, atmospheric pressure at the surface does rise due to heating because the air-molecules move faster at higher temperatures and therefore possess more kinetic energy and momentum. It is precisely their greater energy and momentum that causes them to rise to greater heights above the surface, which manifests as the thermal expansion of the atmosphere.
Is this is a religion? Just asking because this looks like an nth thread hijack attempt.
The lapse rate and convection set the altitude of the tropopause and the thickness of the troposphere as a function of the temperatures of the surface and of the atmosphere at the altitude where the tropopause happens to be. The surface and the atmosphere at the altitude of the tropopause have their temperatures adjusting themselves to have heat outgo of each matching heat income of each. Most of the heat outgo and heat income of each of these is by radiation.
Without greenhouse gases, the surface and tropopause temperatures would be close together, and the lapse rate and convection would make the tropopause very low in altitude and the troposphere very thin. Convection would be minimal, existing only by being forced by the equator being warmer than the poles. With uniform surface temperature and no greenhouse gases, the atmosphere would have uniform temperature matching that of the surface (due to heat conduction), the altitude of the tropopause would be vanishingly low, and there would be no troposphere and no convection.
The altitude of the tropopause depends on pressure and has nothing to do with the LWIR absorption properties of a few trace gases. Such has been observed on all planets in the solar system with thick atmospheres.
Willhas: Are you calling water vapor a trace gas? Meanwhile, the absorption spectrum of Earth’s atmosphere at wavelengths where it matters for Earth and atmosphere temperature thermal radiation is due to gases and vapors whose molecules have at least 3 atoms.
Those who deny that increase of CO2 can’t do anything on basis of its spectral properties or on how little CO2 there is don’t even have their stories straight as to whether its insignificant due to being a trace gas or due to there being so much of it that its spectral effects are already saturated.
As for other examples of a “trace gas” being significant: In a low pressure sodium lamp, sodium is about .15-.2 % of the gas/vapor composition and accounts for over 99% of its spectrum. In fluorescent lamps, mercury vapor is about .2-.3 % (that high only when the lamp is warmed up) of the gas/vapor mixture and accounts for about 99% of the spectrum of the radiation from the gas/vapor mixture.
willhaas April 3, 2017 at 12:05 pm:
> “The altitude of the tropopause depends on pressure”
What about on planet Earth, where it is sometimes below the 300 millibar pressure level, even getting below the 350 millibar pressure level (polar areas in and close to winter) and sometimes above the 100 millibar pressure level, even getting to the 60 millibar pressure level (in convective tropical areas)?
Donald L. Klipstein April 3, 2017 at 8:48 am
Are you aware of the hydrostatic equlibrium against gravity every atmosphere is in?
I assume not, seeing your referenced post.
interesting.
IR active gases are screens, not blankets, though. Okay, what effect should IR active gases have on the temperature profile, given the kinetic theory of gases. Under that theory, hot gas moves faster than cold gas. Well, we know what one IR active chemical does do, when liquid or solid, and that effect is lowering the lapse rate from about -9K/km to about -6.5K/km. So, wouldn’t IR active gases do the same thing, even if the bulk of water’s effect is from conversion of potential energy in the form of the latent heat of fusion and deposition to kinetic energy? If CO2 had the effect posited, shouldn’t we see its effect on the lapse rate?
The lapse rate is a measure of the insulation properties of the atmosphere. It turns out that the lapse rate is a function of the heat capacity of the atmosphere and the pressure gardient and has nothing to do with the LWIR absorption properties of some trace gasses. Actually adding CO2 to the atmosphere will lower the lapse rate which is a cooling effect. There is no evidence that the increase in CO2 over the past 30 years has had any effect on the lapse rate in the troposphere.
Thanks,
That’s my point. If the IR based premise that there should be a tropical tropospheric hotspot was measurable, then we should be able to see that effect on the moist and dry atmosphere’s lapse rate. Since we can’t detect it yet, if it is there, yet we can and do detect water’s effect, would that not show defects in the IR dominated radiative model? I take it that you agree with me that the posited IR effects of carbon dioxide are too small to be resolved against the background.
I don’t agree with the ‘insulation’ bits, but do agree that the lapse rate (change in temperature in the atmosphere as a function of height above the surface) is set by the atmosphere’s mass, the planetary gravitational field and the whole atmosphere’s composition, which determines the heat capacity, which changes, variably, on a regional basis as a result of regional chemical processes.
cdquarles: As you said, water vapor lowers the lapse rate due to latent heat of fusion. More accurately, this effect is mostly from latent heat of vaporization. This explains the difference between the dry and wet adiabatic lapse rates. It has nothing to do with water being IR-active. Warm air with over 1% or 2% water vapor but with relative humidity less than 100% has its adiabatic lapse rate being high due to the dry one being applicable, and cooler air with relative humidity at 100% and clouds present with .5% or .2% water vapor (even including if its cloud droplets were vaporized) would have a lower adiabatic lapse rate due to the wet one being applicable.
Greenhouse gases due to their IR effect cool the stratosphere and warm the surface, giving rise to convection. Water is different in having also a surface-cooling effect due to it having latent heat of vaporization, but its surface-cooling effect from evaporative cooling is less than its surface-warming effect by being the main greenhouse gas.
Without greenhouse gases, the surface temperature would match the temperature of the lower stratosphere, and there would be little or no troposphere in between. But if there should be one due to convection forced by horizontal temperature gradients, it would be thin and have a lapse rate being the dry adiabatic lapse rate of 9 degrees C per km.
willhaas April 4, 2017 at 1:01 pm: The surface and lower troposphere have gotten warmer and the lower stratosphere have gotten cooler since satellites started measuring the temperature of various levels in 1979. Check out even what Christy and Spencer say about this. This means that the lapse rate is increasing or the troposphere is getting thicker or both. I think mostly the troposphere getting thicker. To increase the worldwide temperature difference between the surface and the lower stratosphere by 1 degree C only requires raising the tropopause by about 150 meters worldwide. Its altitude varies from under 8 km to around 20 km depending on where in the world and the season, so a 150 meter rise is something that has to be searched for throughout all the radiosonde soundings, which don’t even cover a majority of the world.
“Climate” by very definition is REGIONAL. There is no more a ‘global climate’ that here is a global language or a global currency. The term ‘climate’ is bandied around incessantly when people actually are talking about temperature, or to be more precise enthalpy. How do you know if something is changing if you have no metric to measure it? In the case of a regional parameter, that metric is a classification. Global warming morphed into climate change when it was obvious there is no such thing. Climate change is morphing not ‘extreme weather’ becasue few if any actual climates exhibit significant change. Climates classified by the Trewartha system are greening; an obvious change for the better. That is why the even more obscure and meaningless term ‘extreme weather’ is becoming popular.
😀
The movement of energy from surface to 32 km (includes 99% of molecules) is resisted by four parallel thermal resistors: latent evap/cond, conduction, convection, radiation. The inverse of the combined resistance is U, the composite thermal conductivity of the atmosphere.
The flow from surface to 32 km is described by: Q, Btu/h = U * A * dT. About as simple an explanation as needed to fit the observations. Above 32km there are no molecules worth mention, no latent, cond or convection, all radiation and S-B applies.
ISR, Btu/h incoming across discular cross section = U A dT, Btu/h outward through spherical atmosphere. This creates the warm surface same way it creates a warm house.
It’s fundamental HVAC. All this up/down/”back” LWIR is just rubbish.
But the hotspot has been found
https://phys.org/news/2015-05-climate-scientists-elusive-tropospheric-hot.html
Discovery was covered by WUWT back in 2015:
https://wattsupwiththat.com/2015/05/14/claim-climate-scientists-find-elusive-tropospheric-hot-spot-over-the-southern-ocean/
Crispin [then] in Waterloo wrote a thorough summary at:
Crispin in Waterloo
May 14, 2015 at 5:05 pm
Excerpt:
The third party them wrote a report (which is cited in AR5) saying that the data is of such poor quality that the hot spot could not be reliable found, but they still had high confidence it is there.
No kidding, that is what they did. They messed up good data until there was no chance of being able to see whether or not there was a hot spot in it, and declared the lousy data to be just that (which by then it was). They next expressed confidence that the hot spot was probably there somewhere. This idea and process was created and monitored by the authors of AR5. I don’t think AR5 contains manipulated junk science, I know it does.
So if that’s how did they do it for AR5, how did they do it for the paper above? Homogenised iteratively? Again and again, and again? And maybe again? At what point and according to which sign did they know they have performed enough homogenisation interations? Has anyone validated their method?
Thanks Neil for recovering that comment.
The AR5 expert reviewer who monitored the section dealing with the cover-up of the absence of the hotspot maintains this story line is correct. The data is good, the satellites confirm it, the hotspot is not there, the data were messed with, the result was garbagy data, the data was declared (by a different group) to be of such poor quality that the hot spot could not be detected. So they declared that the GHG radiative feedback theory was good and the hotspot is probably there.
Geronimo, suggest you refrain from drawing attention to that paper. It is misleading and the information necessary to place the topic in context is not generally available to those who are not regular readers of WUWT. It is, quite simply, a scientific scandal.
Further, the predicted behaviour of the GHG hotspot is that it will be warming 3 times faster than the surface. This poses a problem. The surface in the tropics doesn’t warm much at all from changes in the GHG concentrations. Why then should there be a tropical hotspot? Bit if a theoretical oversight, eh? If the hotspot is not there where is the warming taking place, then where is the warming coming from, and is it because of GHG’s at all? Maybe heat is carried to the poles in warm water. But that only works for the North Pole region. There has been no continental warming in Antarctica in 60 years.
Hotspot: evidence of absence is evidence of conceptual model failure.
Evidence of hiding the evidence of absence is a evidence of moral failure.