Solar variations affect the abundance of clouds in our atmosphere, a new study lead by DTU Space suggests. Large eruptions on the surface of the Sun can temporarily shield Earth from so-called cosmic rays which now appear to affect cloud formation. A team of scientists from the National Space Institute at the Technical University of Denmark (DTU Space) and the Racah Institute of Physics at the Hebrew University of Jerusalem has linked large solar eruptions to changes in Earth’s cloud cover in a study based on over 25 years of satellite observations.
The solar eruptions are known to shield Earth’s atmosphere from cosmic rays. However the new study, published in Journal of Geophysical Research: Space Physics, shows that the global cloud cover is simultaneously reduced, supporting the idea that cosmic rays are important for cloud formation. The eruptions cause a reduction in cloud fraction of about 2 percent corresponding to roughly a billion tonnes of liquid water disappearing from the atmosphere.
Since clouds are known to affect global temperatures on longer timescales, the present investigation represents an important step in the understanding of clouds and climate variability.
”Earth is under constant bombardment by particles from space called galactic cosmic rays. Violent eruptions at the Sun’s surface can blow these cosmic rays away from Earth for about a week. Our study has shown that when the cosmic rays are reduced in this way there is a corresponding reduction in Earth’s cloud cover. Since clouds are an important factor in controlling the temperature on Earth our results may have implications for climate change“, explains lead author on the study Jacob Svensmark of DTU.
Very energetic particles
“Since clouds are an important factor in controlling the temperature on Earth our results may have implications for climate change”
Galactic cosmic rays are very energetic particles originating mainly from super novae.
These particles generate electrically charged molecules – ions – in Earth’s atmosphere. Ions have been shown in the laboratory to enhance the formation of aerosols, which can serve as seeds for the formation of the cloud drops that make up a cloud. Whether this actually happens in the atmosphere, or only in the laboratory is a topic that has been investigated and debated for years.
When the large solar eruptions blow away the galactic cosmic rays before they reach Earth they cause a reduction in atmospheric ions of up to about 20 to -30 percent over the course of a week. So if ions affect cloud formation it should be possible to observe a decrease in cloud cover during events when the Sun blows away cosmic rays, and this is precisely what is done in this study.
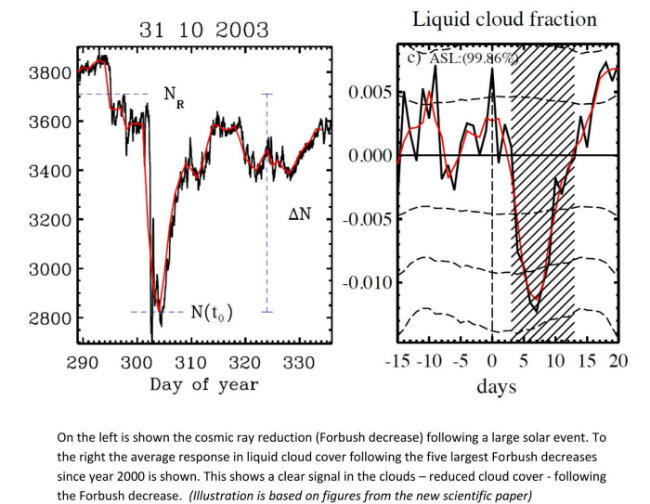
The so-called ‘Forbush decreases’ of the cosmic rays have previously been linked to week-long changes in Earth’s cloud cover but the effect has been debated at length in the scientific literature.
The new study concludes that “there is a real impact of Forbush decreases on cloud microphysics” and that the results support the suggestion that “ions play a significant role in the life-cycle of clouds”.
Arriving at that conclusion was, however, a hard endeavor; Very few strong Forbush decreases occur and their effect on cloud formation is expected to be close to the limit of detection using global atmospheric observations measured by satellites and land based stations. Therefore it was of the greatest importance to select the strongest events for study since they had to have the most easily detected effect. Determining this strength required combining data from about 130 stations in combination with atmospheric modeling.
This new method resulted in a list of 26 events in the period of 1987-2007 ranked according to ionization. This ranked list was important for the detection of a signal, and may also shed some light on why previous studies have arrived at varied conclusions, since they have relied on events that were not necessarily ranked high on the list.
Possible long term effect
The effect from Forbush decreases on clouds is too brief to have any impact on long-term temperature changes.
However since clouds are affected by short term changes in galactic cosmic radiation, they may well also be affected by the slower change in Solar activity that happens on scales from tens to hundreds of years, and thus play a role in the radiation budget that determines the global temperature.
The Suns contribution to past and future climate change may thus be larger than merely the direct changes in radiation, concludes the scientists behind the new study.
Source: http://www.dtu.dk/english/News/Nyhed?id=b759b038-66d3-4328-bbdc-0b0a82371446
The full reference to the new paper is: J. Svensmark, M. B. Enghoff, N. J. Shaviv, and H. Svensmark, “The response of clouds and aerosols to cosmic ray decreases”, Journal of Geophysical Research – Space Physics, 2016, DOI: 10.1002/2016JA022689.
Click here or here to access the abstract and full scientific paper.
Related: (via the Hockey Schtick)
Solar physicist Dr. Leif Svalgaard has revised his reconstruction of sunspot observations over the past 400 years from 1611-2013. Plotting the “time integral” of sunspot numbers from Dr. Svalgaard’s data shows a significant increase in accumulated solar energy beginning during the 1700’s and continuing through and after the end of the Little Ice Age in ~1850. After a ~30 year hiatus, accumulated solar energy resumes a “hockey stick” rise for the remainder of the 20th century, followed by a decline beginning in 2004, all of which show remarkable correspondence to the HADCRU3 global temperature record:

“The most obvious way for warming to be caused naturally is for small, natural fluctuations in the circulation patterns of the atmosphere and ocean to result in a 1% or 2% decrease in global cloud cover. Clouds are the Earth’s sunshade, and if cloud cover changes for any reason, you have global warming — or global cooling.”
maybe the sun did it after all
Blasphemer!
No, the butler did it… (it’s always the butler that did it)
With the candlestick in the study?
Why study candlesticks, isn’t the science settled?
Even Cluedo has about 200 possible solutions. The new Cluedo, with Ms. Bash the Soda Syphon Salesman, may have more.
But with climate there are, per the souls of this parish, a large number of effects, more or less significant I am sure.
I suspect the interplay between these variables is, actually, not really known.
I had a link, once, I thought.
A sort of cloud-sourced list.
Auto
The science is settled, only the data is uncertain.
Eugene WR Gallun
good one, Mark, it took me a few reads to get it… ☺
George W did it. Obama said so right after he promised me that my medical expenses would go down.
Someone PLEASE take that graph above and add the CO2 graph to it and send it to Dr Abram http://joannenova.com.au/2016/08/experts-surprised-to-discover-what-skeptics-have-known-for-years-world-has-been-warming-for-200-years/ and this MSM IDIOT http://www.smh.com.au/environment/-gqz260.html
Those people are not idiots, they willingly deceptive.
Extremely deceptive. They are trying to blame man for millennial trends, not just the hockey stick blade. Not idiotic, but very foolish. But that’s Abrams.
====================
A real sunspots time-evolution has nothing to do the one shown here.
There is no doubt : they are fooling you.
Also what does Svensmark is not science… Everybody knows that (I hope).
Verbal diarrhoea. You are talking out of ton cul.. May I suggest a large dose of imodium
And don’t forget the toilet paper to wipe your chin.
You will discover with time that toncul say less stupidy than wuwt. Easy.
Sunspot evolution :
FLAT since 1950.
Decreasing since 2000.
What about global SURFACE air temperature ?
even decreasing since around 1990
Ah, what (insert scientist’s name you don’t agree with here) does is not science, and here is a wikipedia link to back me up — idiots everywhere.
Embrassez mon cul, s’il vous plait.
RWturner
Yes, for sunspots evolution, wikipedia is ok…
About Svensmark : you explain to me the details of the theory ? And provide me some quantification of the effects ? Without forgetting to explain why it’ relevant : sun is flat since 1950…
Toncul, do you have to keep on turning the gas up on the stove to heat a kettle of water? No one really knows how long it takes the sun to equilibriate…
It depends : After few minutes, it doesn’t warm up anymore, specially if the stove was initially not very warm.
In the last decade sun was at a minima, but ocean keep accumulating energy and surface temperature keep increasing. The kettle of water has been put in the fridge, but it’s still warming…
Tonar$e,
Svensmark’s science is so bad, that the Stanford Linear Accelerator Lab (SLAC) used to have a Web page on how GCRs form clouds, but of course it was taken down. Maybe Dr. Svalgaard of Stanford U. knows why.
[All: Stick to the disagreements about the science, not about the person. .mod]
Gabro,
you give me a summary of the results, in particular the part where they show something about clouds, and climate ? Also, do you think that if there were no galactic cosmic rays, there would be no clouds ? You should open some books.
Anyway, sun is flat since 1950 and decreases since two decades.
toncul,
You should review http://www.nature.com/nature/journal/v533/n7604/full/nature18271.html
It’s the latest result from the CERN CLOUD experiment. They found in the conditions they tested GCRs had little or no impact on cloud formation.
Mind you, in their paper http://www.nature.com/nature/journal/v533/n7604/full/nature17953.html they found GCRs had a major impact.
It all comes down to the chemical make of the atmosphere in the absence of GCRs.
“[All: Stick to the disagreements about the science, not about the person. .mod]”
yep, but what does Svensmark is not science. So how do we do?
[As above. If you believe you are right, stick to the science. Write about the science so you may convince others. If you cannot convince others who read your words, you may need more science as evidence.
Also, never blindly assume that what is “accepted” right now is right now. .mod]
I am sticking to the science.
Ton, your question is an obvious straw man, as even you should be able to see.
GCRs are not the only source of CCNs, obviously. But more of them demonstrably make more CCNs, hence more clouds. And they are more important relatively when there are fewer other sources of CCNs.
Have you really not bothered to study CERN’s experimental results re GCRs and CCNs? I guess not, since you assert without the least shred of evidence that Svensmark’s work is not science.
“[As above. If you believe you are right, stick to the science. Write about the science so you may convince others. If you cannot convince others who read your words, you may need more science as evidence.
Also, never blindly assume that what is “accepted” right now is right now. .mod]”
It’s already done : sun is [flat] since 1950 and decreases since two decades. If you are not convinced by that it is not a scientific issue anymore.
But we can keep going about science : the forcing that, according to you, is supposed to explain most of the climate change is presently decreasing, whereas the climate system is still accumulating energy, which we know from both thermometers measurements and indirectly from sea level rising.
gregfreemyer
I am sorry but there is nothing about clouds there. Just aerosol nucleation.
“But more of them demonstrably make more CCNs, hence more clouds.”
Give me a full quantification of that …
(and compare it to what you would get for the anthropogenic aerosol effect).
Whatever, sun is flat since 1950. So the effect is 0 since 1950, disregarding that CGCR variations are not enough to have any impact on clouds, whatever you think the sensitivity of cloud to CCNs is.
Solar activity has been up and down since 1950, as have alleged average global temperature and GCR flux. And low clouds have generally been correlated with GCRs.
“Solar activity has been up and down since 1950”
up and down, not up and up.
So you disagree with the plot shown by Anthony Watts ?
Do you think that plot is misleading ?
toncul
August 26, 2016 at 8:32 pm
Which plot, the sunspot integral?
That graph does indeed show increasing solar activity associated with alleged warming, as recreated by a suspect gatekeeper, although sunspots aren’t the only measure of solar activity.
If cooling accompanies the coming expected downturn in SSN, then we’ll know more about natural variability. But the gatekeepers will do all in their power to adjust any actual cooling out of existence, so corrupt has so-called “climate science” become.
“…surface temperature keep increasing.”
Your not talking about the current el niño spike are you? We’ve been in “pause” mode for well over a decade. So, no, surface temps have not kept increasing. I agree about OHC. If the ocean is warming faster than ever, then maybe that’s where all the heats going. If so, we’re using the wrong metric (surface temps) for agw…
And again, this “sun flat since 1950” nonsense is just that (nonsense)… SC21 & SC22 were two of the largest solar cycles of the 20th century. You don’t have to keep turning up the stove to keep heating up a pot of water, in fact you can even turn it down some. That’s just b.s. (bad science)…
afonzarelli
I am speaking about surface temperature, whatever the reason of the increase. GHG are not the only factor that affect temperature.
Take GISSTEMP or HadCRUT or other surface temperature index, do a regression over the last decades and you will see it’s increasing.
The question is : is the sun responsible of most of the warming since 1950 ? The answer is no. Because sun irradiance evolution is flat since 1950 and ocean modelling (it’s mainly the heat capacity that do the job here) tells us that most of the warming due to sun has occurred before 1950. You can disagree, because I used the terrible word “modelling” (even if we are just speaking about a big bucket of water). Well, show me it’s not the case with a simple, simplified calculation. Give me a physical explanation.
BUT don’t waste your time because you agree that OHC is increasing. In the last decades : Solar irradiance is decreasing whereas OHC increasing. Which means : climate system is accumulating energy and this is clearly not due to the sun (this is not surprising at all view that solar irradiance variations are small).
The end.
http://lasp.colorado.edu/lisird/tsi/historical_tsi.html
Your original comment (to me) said “the last decade” (not decades)… Look at the ucolorado graph. You can clearly see that SC21-23 are the three largest cycles in a row. (the highest level of solar input!) Again it’s a matter of threshold. You don’t have to keep turning up the stove to keep warming a pot of water. NO ONE KNOWS just how long it takes for equilibration of surface temps. (solar forcings being poorly understood) As for the oceans, that will take hundred of years. As long as SSTs are higher than equilibrium state temperatures then we will see ocean warming. In fact SSTs could drop significantly and the oceans will keep warming. Look, i’m not a “it’s the sun stupid” kind of guy. I don’t know what role the sun actually has in the big picture. (i don’t think the 30 year warming/cooling cycles are necessarily caused by the sun) I just think your putting out a flawed argument that currently has no basis.
Your graph is nice. You should have given it to Anthony Watts… I would ahve been more interested in a calculation.
The point is that solar irradiance has increased on average at the begining of the last century, and has decreased since 2 or 3 decades. Now we are back to the forcing of the begining of the last century. If there were only the sun, we would have reached the equilibrium corresponding to the present forcing (due the larger forcing more than 3 decades ago). Temperature would have start decreasing, and OHC too, or at least, it would not keep increasing as it does. Observation shows that both are presently increasing. Also, the OHC and temperature evolution over the seond half of the last century is not in agreement with the solar forcing evolution, with a huge increase, when solar stop increasing and start to go down.
Moreover, the variations of the solar forcing are so small in comparison with CO2 forcing, that I even don’t know why we are speaking about that.
toncul says
Observation shows that both are presently increasing
henry says
pray, do show me your OWN results that prove this?
here are my own
if anything, man made warming is supposed to affect minimum temperatures
there is no room in my equation for any AGW?
Wow what a completely false argument. It’s not about solar irradiance toncul.
Clue, “forbrush decrease following solar event”, as in solar events decrease cosmic rays which have effects on cloud and ocean circulation.
Regardless of flat irradiance since 1950. Solar activity has indeed fluctuated. So I have no idea what you are actually talking about
Also ocean models, they are awful, you cant make any claim off of ocean models because the oceans are so poorly understood.
https://wattsupwiththat.com/2016/08/25/svenmark-publishes-solar-activity-has-a-direct-impact-on-earths-cloud-cover/comment-page-1/#comment-2286685
https://wattsupwiththat.com/2016/08/25/svensmark-publishes-solar-activity-has-a-direct-impact-on-earths-cloud-cover/comment-page-1/#comment-2286685
Disregard the first link (forgot the s in svensmark…). Mike Jonas touches on a couple interesting points here. He has a very well articulated analogy about the pot on the stove. Below this comment (and svalgaard’s response) is a comment about how heat that enters the ocean is a bit different than surface in that it is retained— mike jonas 8/27 1:30 am.
Somewhat pressed for time here, so i’ll address your last point first… tsi is NOT the only solar forcing. Even if it were, it’s a bit different in that sun light penetrates the ocean’s surface. (therefor more energy would be retained and would more readily warm water) Warmer water would be less effective in cooling the atmosphere. Furthermore, warmer water would lead to more water vapor. AND there are the other solar forcings that are unique to the sun which are not always well understood, accounted for. There is enough correlation with the historical temperature record that bear witness to the power of the sun to influence climate…
Saying that there is an inertia (stove analogy) is not enough. Show that the one that you need to get a huge surface warming and and huge OHC increase and a huge sea level rising, when sun is not increasing anymore and decreasing back (from a very low value), is realistic. Also you should give the value of “other solar forcings” and their time evolution. In particular, make me dream with Svensmark.
Mark – Helsinki. GCRs follows sun variations. So what doesn’t work for the solar irradiance (in term of temporal variations), doesn’t work for GCR too. Anyway, GCR effect is zero, until afonzarelli show us the opposite with some nice calculations.
i think the “stove analogy” is quite apt… It was turned up on high for most of the twentieth century to get our temperature rise. And then it was turned down low to keep it there (“the pause”). Now, maybe this is happening or maybe it isn’t happening, but at least it makes sense that it could be happening that way. You’ve got to remember that we’re coming out of the LIA, when temps we’re much colder and solar activity much lower. So, a weak solar cycle for us is not really weak when you compare with hundreds of years ago. (to keep it in perspective, solar activity in the 20th century was the highest in 8,000 years!) That’s why this time period is so interesting. Even at a prolonged solar maximum (SC24) temps have been barely holding on, only buttressed of late by an el nino. What will the next solar minimum bring? ’08 bottomed out only to be salvaged by an el nino in 2010. We won’t have an el nino this time round and we’re coming of a weak cycle that for the most part left temps flat. So, it should be interesting one way or another…
i think what you’re missing here is the realization that everything is relative to the LIA. Think of the LIA as being our equilibrium state temperature. Everything since then has been above the equilibrium state. Temps in the LIA were about .8C below our recent “pause”. Everything that i’ve seen indicates that we’ve actually been about .7C above the equilibrium temperature. (eventually a new and higher equilibrium state being achieved) So until we drop back down .7C to the equilibrium temp then OHC will continue to increase, sea levels will continue to rise. And if the sun is still relatively active, then we shouldn’t expect to get back to equilibrium any time soon. The last time we were close to the equilibrium state was around the turn of the century (1900). This current cycle and probably the next are not quite as low as that in terms of ssn, and nowhere near as low in terms of tsi (as you can see from lisird)…
Toncul, here’s a graph of sea level rise. You can see where it was near zero just after the turn of the century. SC14 was THE weakest cycle in 200 years and the minimum that followed it bottomed out in 1913. (temp data shows the same thing with temps actually going lower than the equilibrium state temp for a few years) EVERYTHING since then has been above the equilibrium state. SC14 took us to equilibrium and all else has been above that equilibrium since. That means solar cycles have been stronger than SC14. Temps thus have been higher than the equilibrium state. And as you can see OHC/sea level rise has been above stasis. SC14, then, would be at “threshold” strength for a solar cycle…
afonzarelli : to keep it in perspective, solar activity in the 20th century was the highest in 8,000 years!)
No,that is not the case and the TSI curve you showed is wrong too. TSI before 1978 is ‘constructed’ from the sunspot number. Recent research has shown that the earlier version the the sunspot number are incorrectly calibrated. Solar activity the past 100 years has not been exceptionally high.
“Think of the LIA as being our equilibrium state temperature. ”
Why would I think that ? If insolation is normal, then go down, then back to normal, the climate system go back to equilibirum as fast as it deviates from this equilibrium. and you agree:
“The last time we were close to the equilibrium state was around the turn of the century (1900).”
That more or less the same for the increase and decrease during the last century (with a very low values during the last decade). No we’re close to 1900. The largest solar variations are so small in comparison with CO2 forcing (did I tell you that yet ?), that there is not so much left at the end, nothing in fact.
Also your stove analogy is bad, the way you think it : the heating plate (the effect works only for electricl plate) has also an inertia, same as the kettle. Here, the temperature of the heating plate is forced to decrease (sun decrease). And if we force it to decrease too much, then it’s cooler than the kettle and that’s the kettle that warm the plate (OHC has to decrease). Here in fact, we do not care of all that because the stove doesn’t warm efficiently. So we gonna have to find something else to warm up the water and prepare the tea.
toncul says

No we’re close to 1900. The largest solar variations are so small in comparison with CO2 forcing (did I tell you that yet ?),
henry says
no, it is more like 1929?
http://www.woodfortrees.org/graph/sidc-ssn/from:1972/to:2016/offset:10/trend/plot/sidc-ssn/from:1927/to:2016/plot/sidc-ssn/from:1927/to:1972/trend/plot/sidc-ssn/from:1927/to:2016/trend
I am not sure if you knew already – I suppose you could be one of those “willfully ignorant” characters that just toy with people on this site –
but just in case you are not –
here is my argument against any AGW, to give a summary of all my investigations into climate change starting ca. 2009/2010
Concerned to show that man made warming (AGW ) is correct and indeed happening, I thought that here [in Pretoria, South Africa} I could easily prove that. Namely the logic following from AGW theory is that more CO2 would trap heat on earth, hence we should find minimum temperature (T) rising pushing up the mean T. Here, in the winter months, we hardly have any rain but we have many people burning fossil fuels to keep warm at night. On any particular cold winter’s day that results in the town area being covered with a greyish layer of air, viewable on a high hill outside town in the early morning.
I figured that as the population increased over the past 40 years, the results of my analysis of the data [of a Pretoria weather station] must show minimum T rising, particularly in the winter months. Much to my surprise I found that the opposite was happening: minimum T here was falling, ….any month….I first thought that somebody must have made a mistake: the extra CO2 was cooling the atmosphere, ‘not warming it. As a chemist, that made sense to me as I knew that whilst there were absorptions of CO2 in the area of the spectrum where earth emits, there are also the areas of absorption in the 1-2 um and the 4-5 um range where the sun emits. Not convinced either way by my deliberations and discussions on a number of websites, I first looked at a number of weather stations around me, to give me an indication of what was happening:
The results puzzled me even more. Somebody [God/Nature] was throwing a ball at me…..The speed of cooling followed a certain pattern, best described by a quadratic function.
I carefully looked at my earth globe and decided on a particular sampling procedure to find out what, if any, the global result would be. Here is my final result on that:
Hence, looking at my final Rsquare on that, I figured out that there is no AGW, at least not measurable.
Arguing with me that 99% of all scientists disagree with me is useless. You cannot have an “election” about science.
You only need one man to get it right.
I hope you come right.
“So we gonna have to find something else to warm up the water and prepare the tea.”
And that’s what want to do Svensmark. He is trying to warm the water with a clothes pin and some people still believe he will do it.
I presented three papers at a symposium on Earth’s Near Space Environment, 18-21 February 1975, held at the National Physical Laboratory, New Delhi. [1] Effect of solar flares on lower tropospheric temperature & pressure {Indian J. Radio & Space Physics, 6:44-50,1977] and [2] Power spectral analysis of lower stratospheric meteorological data of H, T, u & v [6:51-59] and [3] Power spectral analysis of total & net radiation intensities [6:60-66]. The impact of solar flares occured within 24 hours of flare occurrence but based the existing system, thee impact changed. Radiation followed the sunspot cycle [11 and its multiples].
Dr. S. Jeevananda Reddy
The political dogma of CAGW is settled in the political established UNFCCC. That means that humans also drive the sun?
No, Santa, humans produce a lot of CO2. It’s the man-made CO2 that drives the sun. And that’s a FACT!
Some people just don’t get it 😉
Solar variations affect the abundance of clouds in our atmosphere, a new study lead by DTU Space suggests. Large eruptions on the surface of the Sun can temporarily shield Earth from so-called cosmic rays which now appear to affect cloud formation.
Which Leif does not agree with . We just had a discussion about this today. We shall see.
Yes, here’s the argument:
https://wattsupwiththat.com/2016/08/21/the-north-atlantic-ground-zero-of-global-cooling/comment-page-1/#comment-2285434
Here’s a video about Svensmark’s work:
It’s by these guys, I think:
http://mortensenfilm.dk/documentary
I just watched the whole movie…..very interesting….it make sense of this whole paper and all the comments seen below
..But Dr. Leif Svalgaard seems to be agreeing up above ?
Yes, Salvatore, that’s the glory of this (these) climate blog(s). Dr Svalgaard will show up to give us his take. We DO learn things with opposing view points…
Can’t wait to hear what our resident expert says, alfonzarelli, and, yes, I am being sarcastic.
Yeah, Jay, i don’t blame you… Looks like the good doctor not only has laid an egg, but he also sat on it and hatched it! I still learn a lot from the guy though.
The sunspot integral versus corresponding temperature changes has a strong correlation.
That is what the data shows but who cares about data that is what the AGW enthusiast would say.
I go by the data and this along the historical climatic data record show AGW theory is wrong and that this period of time in the climatic history of the earth is in no way unique.
Further global cooling has begun and this is going to continue as this prolonged solar minimum becomes more and more established.
If you combine the integral of SSN and the integral of ocean cycles, the correlation with temperature is .97
https://rclutz.wordpress.com/2016/06/22/quantifying-natural-climate-change/
This would also tend to indicate that the lack cloud coverage – or the use of averaged cloud effect in parametric or table-driven sections of the GCM’s are another major contributor to their inability to forecast or hindcast. Geophysical phenomenon are real and they matter.
This would also seem to require a review of the tropes-as-postulates about the feedback factor and it’s mechanisms. Do you think that work will actually be done?
“Arriving at that conclusion was, however, a hard endeavor; Very few strong Forbush decreases occur and their effect on cloud formation is expected to be close to the limit of detection using global atmospheric observations measured by satellites and land based stations. Therefore it was of the greatest importance to select the strongest events for study since they had to have the most easily detected effect. Determining this strength required combining data from about 130 stations in combination with atmospheric modeling.
This new method resulted in a list of 26 events in the period of 1987-2007 ranked according to ionization. This ranked list was important for the detection of a signal, and may also shed some light on why previous studies have arrived at varied conclusions, since they have relied on events that were not necessarily ranked high on the list.
Possible long term effect
The effect from Forbush decreases on clouds is too brief to have any impact on long-term temperature changes.”
$$$$$$$$$$$$$$$4
interesting. when I looked at Forbush events ( they are rather large compared to normal variations in GCR) I found…… NOTHING.
Turns out they needed a “new method” to find anything
atmospheric modelling???
Regardless the effect is temporary..
Like volcanos in a way.
Like weather
Steve,
This result shows that GCR flux affects cloud formation. Hence when the sun’s magnetic field reduces GCRs over longer periods, the climate will warm. The point isn’t just limited to temporary flare bursts.
I’d have thought this fact was obvious. So the effect is on earth’s climate, not just space WX.
The climate has warmed over the past several cycle, while CGRs have increased…
Yes, but it ultimately stopped warming, didn’t it?
Surely one cycle alone can’t rule. What happens if you graph GCRs vs. Global temps and include ocean temp oscillations.
Fonzie says,
“Yes, but it ultimately stopped warming, didn’t it?”
No, it didn’t.
http://www.woodfortrees.org/plot/gistemp/from:1985/plot/gistemp/from:1985/to:1998/trend/plot/gistemp/from:1998/trend/plot/uah/from:1985/plot/uah/from:1985/to:1998/trend/plot/uah/from:1998/trend
YES, IT DID STOP WARMING!!! For nearly two decades according to both your graphs. And then we hit the el nino spike, after which temps are headed back down where the were. Do you get a thrill by coming here and showing everybody how brain dead stupid you are? (OR are you just being stupid on purpose a la alinsky?)
So less input of energy in the climate system according to afonzarelli, but more input of energy says observations (ARGO, sea level observations). It doesn’ fit.
Also clouds form without CGCR…. It’s time to learn by opening some books.
Ton,
Time for you to read some actual scientific papers.
https://www2.acom.ucar.edu/sites/default/files/…/Kristjansson.pdf
If link doesn’t work, Google:
Effects of Galactic Cosmic Rays on the Atmosphere and Climate
Jón Egill Kristjánsson, Univ. Oslo
Toncul, solar activity is still high by historical standards. While the ocean is gaining heat, it’s not doing so faster and faster. SSTs have been flat for well over a decade, so ocean warming has been consistent. UKMO argo data had ocean temps decreasing until 2010 and then increasing after that (dovetailing with the solar cycle)…
Jeez Mosh, have to hand it to you – you’re an expert at just about anything aren’t you.
Particularly good at drive-by snide remarks at science that doesn’t fit your take on things climate.
Since it was published in JGR we have to assume that a few folks who have a considerably more in-depth understand of this than you have, had a hard look at this. “Skeptics” don’t have many pals to turn to in the climate establishment.
@tetris
August 26, 2016 at 1:55 am: No point in replying to Mosh nor Yush et al. Alinsky, yes indeed.
As I recall (and please correct me if I am wrong), when you looked at Forbush events, you specifically looked at grid locations in which there were no clouds. It isn’t surprising that a Forbush event would not increase cloud cover in those areas.
The sun and the cosmos can come out of the closet now.
Yeah, it’s almost as though we’ve become “solarphobic”…
Several years ago I noted a warming in TLT data when a strong CME occurs (but not always). It usually lasts for a week to 10 days before cooling takes place. The question I asked then is whether there had been any long term change in the numbers of CMEs. Never got an answer.
Looks like this is along the same lines.
The science from Dr. Svensmark is compelling and the cosmoclimatology theory is elegant !
Lets enumerate the science Dr. Svensmark has, a Hypothesis/Theory, multiple experiments including CLOUD, experimental resultant data (wow actual real data), the conclusion is made and whatever Lief say’s is irrelevant if he ignores the science/data Dr. Svensmark has published from his many experiments.
So there was a use for all the jet setting climate evangelists after all—-jet contrails in the absence of cosmic rays.
Plotting the “time integral” of sunspot numbers from Dr. Svalgaard’s data shows a significant increase in accumulated solar energy beginning during the 1700’s and continuing
1) the integral of positive numbers diverges towards infinity.
2) the integral of the difference between a time series and its mean is always zero
3) the integral of the difference between a time series and some value, depends on what that value is, which then makes it a free parameter. If you vary that parameter to fit some data, you are just doing curve fitting with no physics.
Huh? Does the curves apparently varying in synch mean there is no correlation? Svensmark’s model seems to be a possible mechanism, but I am missing what Dr Svallgaard is writing.
You vary the free parameter until you get something that looks good.
climate modeling in one sentence.
>>climate modeling in one sentence.
Oooh, nice one Pat.
I am stealing that one….
R
Number 2 is not true. Think of cosine wave. Its mean is zero but the integral of (cosine – mean) is a sine wave. A sine wave is not always zero.
The integral over a sine wave is zero over the whole wave
The integral of the anomaly over time is also zero, so long as the period of the integral matches the period of the anomaly.
The problem comes in integrating absolutes, when in reality you need to integrate the difference from the average.
if for example one was to calculate the average sunspots over the past 400 years, and integrate the difference between this average and the actual number of sunspots, there would likely be a strong correlation with the temperature anomaly.
As far as I can tell from the Figure, the integral is of the difference between the yearly values and the mean. This means that the integral value at the right-hand end of the Figure is zero [also at the left-hand side]. But the whole exercise is more nonsensical than I thought. Why should the climate system know about when we invented the telescope about 1610 [which is the starting point of the integration]? Why not start in 1700 [when the sunspot series becomes better known], or 1800 [when the data is reliable]?
This is what you get by carrying out those integrals:
http://www.leif.org/research/Sunspot-Group-Integrals.png
Note how all three integrals begin and end with zeroes.
Of course, all of them misses the warming up to 1945.
The whole thing is nonsense of purest carat.
How can the integral of a time sequence minus the mean value of that time series possibly be different from zero ??
The integral of a cosine wave over any integer cycles is zero. So is the mean of a cosine wave.
If you have a cosine wave plus a DC component, the integral of that composite waveform over an integral number of cycles is just the mean times th total interval.
G
>>The whole thing is nonsense of purest carat.
Not necessarily, Leif. There are superpositions of many feedback-waves in the saga that is our climate. And if you add a little PDO and AMO to your graph, you might get something approximating to the temperature record.
Just suggestin’.
Ralph
“The integral over a sine wave is zero over the whole wave” I know, but that is not what you said.
As usual Leif in denial of the data.
Even when it is his own data.
Pretty sure his problem was with how the data was used, not whether the underlying data used was correct.
Don’t get all heated up, Lief, it would take you some time to cool down.
@Dan – The plot is coherent, unlike your response(s). As the text indicates, it shows the relative contributions to GMST of the _outputs_ (in degC) of a simple coupled model whose inputs are TSI (w/m^2), CO2 (ppm) and aerosol concentration are converted to forcing via sub-models of the physical processes, In particular the TSI contribution is convolved (look it up) with an exponential time response which models the relaxation time of the ocean. A portion also being lagged in a separate process to model the time delay of the thermohaline circulation. An system characterized by an exponential time response is sometimes referred to as a leaky or dissipative integrator as opposed to the pure integrator Leif is objecting too. A pure time-integral has a Laplace transform A/s, while the dissipative version has a pole in the Laplacian frequency domain, i.e. Vo/Vi= A sp/(s+sp) where sp=-1/tau, the relaxation (or dissipation) time constant.
So whereas a pure integrator like in Leif’s plot above responds to an impulse with a step, a dissipative impulse response decays exponentially towards zero. This is why Leif’s point about the starting value is both correct and irrelevant. It is correct in that we don’t known where to start the integration. But if we knew the initial condition it would not matter where we start, which is to say its a boundary condition problem. However, this unknown initial condition (which is a constant at the output of the “integrator”) is equivalent to an impulse at the input (integrate an impulse and you get a step), and as mentioned above, the response to an impulse decays toward zero over time. Thus to first order the unknown boundary condition doesn’t matter as long as we throw away a few tau’s worth of data. Fortunately we have TSI data far enough back in time that the BC error can be assumed nero zero at the start of the instrumental period.
It is also not correct to simply integrate about the TSi mean, which is a dynamic value. Rather there is some equilibrium value above which the system gains energy and below which it loses energy. This is a model parameter that must be derived from the observed data.
Here are some of the modeled results
http://wp.me/a2xhN5-9M
http://wp.me/a2xhN5-9N
Note the AMO is still evident in the residual. If we simulate a tambora-sized event
http://wp.me/a2xhN5-9O
If you are interested in a paper descibing the method and results see https://montpeliermonologs.files.wordpress.com/2016/08/tsimodel.pdf
Hmmmm. I wish I understood this a little better. I’ve long mistrusted Leif’s integrating because it just seemed like something was wrong with it, but couldn’t put my finger on it from lack of knowledge and numeracy.
Leif? A response?
===========
But the ocean isn’t a pure integrator. It has a relaxation time constant (pole in the frequency domain) and it also has significant lag as subducted energy is decoupled from the atmosphere until it emerges years later at the poles. It’s true that we don’t know the initial storage condition but this is a transient error that relaxes toward zero. If you assume the system was at at low during the Dalton Minimum circa 1700, the initial condition transient error has 150 years or so do die out by the time the instrumental period rolls around.
Re “curve fitting” without physics:
1) The heat storage/Thermohaline circulation described above is a physical model. Like all models it has parameters that are unknown. Bayesian analysis can give us the spread of these parameters and tell us how much confidence we should but in the model
2) The time domain response is the convolution of the input with the system transfer function. This puts severe constraints on the degree of freedom in parameter selection. It is simply not true that any arbitrary input curve can be matched to a given observation by diddling the parameters.
The plot below shows the results of a plausible model. The lagged TSI (using the series you pointed me to in a previous post adjusted to forcing per the equation you referenced), Note that the TSI signal might account for the rise between 1900 and 1940, and the 1950s decline. Since 1960 the CO2 signal dominates.Admittedly the correlation pre-1900 is poor but so is the accuracy of both time series during that period and we could still be seeing remnents of the boundary condition error.
Hope you are doing well.
Another example of not understanding the difference between power and energy. Energy is the time-integral of power. Temperature divided by the effective thermal capacitance is energy. TSI is a forcing i.e. power. Plotting temperature and TSI on the same graph is like plotting your odometer reading and your speedometer reading on the same graph. It’s nonsense.
Perhaps you should read before commenting. To wit, “The lagged TSI (using the series you pointed me to in a previous post >>>adjusted to forcing <<< per the equation you referenced),
Jeff – Do you even know what a time-integral is? Here is a clue, it has nothing to do with lag. If you can be more specific, perhaps I can help you understand.
Dan – W/m2 x ocean surrface area (m^2) x time of irradiance = Joules, lots and lots and lots of Joules. Lighten up or find someone else to troll. I’m not your huckleberry.
Jeff – That is necessary but insufficient. It would be pretty close if you did that for each year and added them all up. But your graph doesn’t do that. It shows TSI (lagged) not the integral of TSI. The graph is nonsense.
The numerical integration is done correctly and combined with an approximation of the net of ocean cycles and the increase of water vapor at http://globalclimatedrivers2.blogspot.com . The result matches measured average global temperature 98% since before 1900.
Hi Dan – thank you for this post.
http://globalclimatedrivers2.blogspot.ca/
I have been too busy to duplicate your work, so must accept it at face value for now.
It appears your integral of solar activity, combined with a ~60 year ocean cycle, can duplicate average global temperature quite well. The recent “adjustments” to the surface temperature data make this more difficult. I only use satellite temperatures after ~1979,
In the shorter term, the Nino3.4 index appears to predict average global temperature ~4 months in the future, and does so quite well (except after major volcanoes that cause temporary cooling).
https://www.facebook.com/photo.php?fbid=1030751950335700&set=a.1012901982120697.1073741826.100002027142240&type=3&theater
What would tie it all together is a means of predicting El Nino behaviour, for example:
http://www.issibern.ch/teams/interplanetarydisturb/wp-content/uploads/2015/01/Asikainen_03_2014.pdf
Best, Allan
@Dan – See post above August 27, 2016 at 6:55 am
Allan – IMO your work is putting a finer point that my stuff glosses over with 5-year smoothing. Perhaps there is a way to merge the two.
Jeff – So where is your prediction for the average global temperature trend?
My prediction for the trend in 2015 using data through 1990 is 0.035 K cooler than the calculation of the trend using data through 2015. The graphs are there for all to examine.
Not much of a believer in trends, especially those of the time domain variety. I prefer to deal in probabilities. The two plots below show the probability of reaching the x-axis temperature anomaly at 2xCo2, The top graph is for a model derived from unaltered time series. The second plot shows the same model with denoised temperature data using the wavelet denoising described in the paper. The spread is the posterior parameter distribution from a bayesian MCMC-Hastings monte carlo.

FYI Dan – this is one reason why I’ve been busy this summer.
Best, Allan
http://www.highrivertimes.com/2016/08/25/aer-suspends-mazeppa-plant-operations-amid-concerns
AER SUSPENDS MAZEPPA PLANT OPERATIONS AMID CONCERNS
By Paul Krajewski
Saturday, August 27, 2016 5:33:46 MDT PM
Months before the Alberta Energy Regulator (AER) ordered the suspension of all operations at the Mazeppa sour gas processing plant on Aug. 9, it was a former company engineer who informed the regulator about serious safety concerns he had regarding the facility and infrastructure.
Allan MacRae, member of the Association of Professional Engineers and Geoscientists of Alberta (APEGA), reached out to the regulator about what he referred to as potentially “disastrous” safety risks the plant’s operation posed to the public and environment in the months leading up to the AER order.
In an email sent to the regulator’s senior executive on May 28, MacRae stated he had serious safety concerns about the plant that is owned and operated by Lexin Resources Ltd. and LR Processing Ltd.
In May, MacRae said he became aware of issues at the facility and its infrastructure and conducted his own week-long investigation using public records and verbal discussions to corroborate the allegations.
During the early 1990s, MacRae said he was the general manager of engineering for Canadian Occidental Petroleum Ltd., known today as Nexen. He noted the company owned and operated the Mazeppa plant until it was taken over by Compton Petroleum Corp. and, most recently, Lexin.
In a statement from the AER, the information MacRae provided was used in the regulator’s overall inspection and compliance assurance process.
In the initial email, MacRae stated Lexin and LR allegedly failed to pay surface lease rentals, which resulted in loss of access to sour gas wells. The firms also allegedly conducted infrequent injection of anti-corrosion chemicals to its gas pipeline gathering systems and provided inadequate financial resources for plant maintenance, he added.
From his understanding, MacRae said the plant handled sour gas up to 40 per cent hydrogen sulfide (H2S), the maximum amount permitted under AER regulations, with wells located within 2.4 kms of highly populated areas of Calgary.
He said sour gas is a naturally occurring substance that contains significant amounts of H2S and, if released to the atmosphere, could pose extreme health risks to the public and environment.
“As little as 0.1 per cent H2S is instantly fatal when inhaled,” he added.
As a result of his investigation, MacRae advised the AER he found standard maintenance was allegedly not being adequately performed at the facility and infrastructure, which he believed could result in an increased risk of H2S being released into the atmosphere.
“If a large release of H2S occurred and the wind direction was unfavourable, I believe there would be no time to evacuate the nearby communities and a major catastrophe could occur,” he said.
Even if the risk of H2S release was moderate, MacRae said the consequences could still be disastrous.
As a member of APEGA, MacRae said he is ethically obligated to report concerns related to public and environmental safety. For this reason, he informed the regulator of his findings.
As of Aug. 23, the AER reported in an email provided to the Times all but one pipeline associated to the Mazeppa plant had been depressurized, but gave no indication when it would be fully suspended as per AER shut-in requirements. These include each pipe being emptied, purged, isolated and left in a safe state.
Ryan Bartlett, AER public affairs advisor, said the regulator has worked with Lexin and LR to address a number of issues related to facility and infrastructure operations at the plant for several months.
Bartlett said the regulator performed an inspection in February and identified a number of deficiencies.
However, he noted Lexin failed to comply with AER requirements between February and June and was ordered to suspend all facility and infrastructure operations on Aug. 9.
“(This was done) to ensure the plant is in a safe state with no risk to the public or environment,” Bartlett said.
The AER order document from Aug. 9 stated Lexin and LR informed the regulator on June 29 that its sour gas release monitoring system was no longer operational and that if an incident or emergency occurred, the regulator would be responsible for managing the situation, not the firms in question.
In the AER order, the regulator also stated the firms terminated the majority of the plant’s staff on June 30 and left six employees to operate and manage the Mazeppa facility and infrastructure.
Bartlett said the AER continues to monitor and inspect plant operations regularly and prioritizes issues with potential impact to public and environmental safety.
Additionally, he said Lexin and LR have been ordered to provide a comprehensive plan about how the companies will respond to incidents and monitor ongoing operations.
If Lexin fails to comply with AER requirements, Bartlett said the regulator can order complete suspension or abandonment of other energy infrastructure, charge administrative penalties, institute legal proceedings or sanction upper management against working in the province.
“All licensees in Alberta are required to follow our requirements,” he said. “Our rules apply across the board.”
Lexin and its associated firms were reached out to by email and phone for a response multiple times. No answers were provided to the Times by publication date.
pkrajewski@postmedia.com
Allan – Good for you! Doing what Professional Engineers do.
Jeff – Thermalization explains why CO2 (or any other noncondensing ghg) has no significant effect on climate. So-called Climate Sensitivity is not significantly different from zero. Average global temperature does change with water vapor, however, and water vapor is currently increasing (and has been since it has been reported by NASA/RSS since 1988.
Increasing global average water vapor has a warming effect which is countering the on-going cooling effect of dwindling numbers of sunspots and declining average sea surface temperature (declining temperature phase of the net of ocean cycles).
dan says
and water vapor is currently increasing (and has been since it has been reported by NASA/RSS since 1988.
henry says
can you elaborate? why is it increasing? reports?
HenryP – Water vapor increase is discussed at http://globalclimatedrivers2.blogspot.com with links to RSS source data and Willis’ articles in WUWT. IMO WV increase should be self limiting (more warmer clouds radiating, higher albedo) but no sign of it being self limiting yet.
It’s nice to see mechanism here. This make s sense and adds depth.
It seems to me that this paper violates the acceptable speech standards of the #ExxonKnew AGs. Svensmark will likely be extradited and prosecuted for this. If he knows what’s good for him, he should head straight away to his local Ecuadorian embassy and seek asylum.
If Leif ever says the Sun matters, you know what that means… we’re DOOOOOOOOOMED! (All in fun, Dr. S.; wishing you’d update your solar activity plots! It’s been a long time since spring.)
The paper concludes that Forbush decreases have an effect on ions and suggests that ions play a significant role in the life-cycle of clouds, but the number of such decreases is very small [one per year on average] and each lasts only a few days, so the effect on climate is negligible
But that is the whole point of the argument. I do not see Svensmark saying that Forbush events have any impact on climate (in fact, they say that they do not). What they are doing is pointing out that you can see the impact of Forbush events on clouds.
Changes in solar activity less massive than Forbush events cannot be measured because our cloud observations are – quite simply – not good enough. However, once you have shown – as Sevensmark has done- that solar activity affects clouds then you have a mechanism for small changes in solar activity having an impact on clouds – even if we can’t yet measure this.
Is your suggestion that Forbush events are unique and that other changes in solar activity don’t change the level at which cosmic rays reach the upper atmosphere?
Is your suggestion that Forbush events are unique and that other changes in solar activity don’t change the level at which cosmic rays reach the upper atmosphere?
Forbush events are rare and short. The usual modulation of cosmic rays is done by the changing geometry of the solar wind: http://www.leif.org/research/HCS-Nature-1976.pdf
Bob: You nailed it. Leif actually created a strawman in this case. Well done.
Rob, if the solar cycle affected clouds in any meaninful way then we would see that cycle reflected in ICOADS and more recently ISCCP data. We don’t. Wrote about that extensively with data illustrations in the climate chapter of The Arts of Truth reviewed by Lindzen, and again in essay Cloudy Clouds in Blowing Smoke.
The 2010 Dessler paper actually shows clouds are variable, with a likely net feedback very close to zero, not significantly positive as he, CMIP3 and AR4, and CMIP5 and AR5 all have it. Faulty cloud parameterization. See also very poor model/observed cloud comparisons between sat and CMIP5 models for one cloud type in essay Models all the way Down. Only way models come close is if you smush them all together in some meaningless ensemble anomaly mean, because individually they are all way off.
The usual modulation of cosmic rays is done by the changing geometry of the solar wind
===========
exactly! so it the solar wind that primarily affects clouds and climate, not TSI, because TSI is relatively constant, while the solar wind is not.
The problem is that climate science has been looking in the wrong place. They have been looking at thermal radiation when they should have been looking at atmospheric ionization.
The geometry of the solar wind changes over the solar cycle [hence the variation of cosmic rays], but the variation repeats pretty much the same in every cycle, so there are no long-term changes.
Oh yes, time to bring up my clock again. The shape of the peak of cosmic rays alternates from sharp one eleven year cycle to flat the next. This gives two of one type of peak and one of the other in each phase of the PDO, with the next phase having one of one type of peak and two of the other.
This is a lower order effect, but how long has it had to entrain something in the oceans? I can’t calculate it, but I can see the scale.
========================
Leif let me see the peaks, then I heard the clock.
===================
[??? .mod]
The longer it’s had to entrain, the harder it will be to find. How long has the sun been alternating shapes of peaks like this, Leif?
=================
As long as the Sun has been around.
Entrained, little doubt, when the basins were configured differently, but carried along, carried along.
============
Given that the climate is a chaotic system, it isn’t even a theoretical possibility that we should be able to expect a single run to produce accurate results.
The first instinct would be to look for attractors but Lorenz pours cold water on that idea.
Thanks, Leif; I don’t think we’ll know this for awhile.
=========
Know what?
heh, mod, the ‘shapes of the peaks’ and the ‘clock of the oceanic cycles’. It’s no good if it has to be explained.
============
[Sorry about that … But we do read each comment. .mod]
Leif, to know if there is any validity to my hypothesis. We’ve been talking about this for a long time. Please, don’t play dumb.
There is a difference from one eleven year cycle to the next in the shape of the peak of cosmic rays. You’ve told me this yourself, and I understand that it is a lower order effect. This probably has some minute effect effect on cloud formation, and grouped in threes to a phase, sixes to a cycle of the PDO, for instance, it might explain the alternate cooling and warming phases of the oceanic cycles.
It has had billions of years to entrain. I hope it doesn’t take that long to disprove my hypothesis.
==========
and grouped in threes to a phase,
They come in groups of two, not three.
At the next solar minimum the GCRs will have a flat peak and intensity will be a few percent less that the last minimum. If the GCR effect itself is small, the flat/peaked effect is even smaller. I do not expect to see any effect above the noise.
But clearly there are long term changes in solar magnetism, as in the Maunder and Dalton Minima, and prior such low SSN intervals.
Solar activity now is close to Dalton minimum conditions. Is the climate?
Within the entrained oceanic cycle, they are grouped three to a phase and six to a cycle. One group of three is in the cooling phase and the other, different, group of three is in the warming phase. I thought you understood this. My apologies for not being more clear, now and in the past.
=================
They come in groups of two, which you can combine in any number of [mostly meaningless] ways. Whatever you do, there does not seem to be any measurable effect. A test of this is to look for a difference effect in cycles from max to max [cosmic ray cycles go from solar max to solar max] for the two possible cases [flat/peaked]. If there is any such effect you would have a 22-year cycle in climate, and none have been demonstrated [as with anything else, there are lots of claims of such cycles – but none compelling]. If there were a 22-yr cycle, then six cycles would be, say, [(low-high-low)-(high-low-high)] with combined effect [(low)-(high)], but no 22-yr exists, so why bother?
I agree we won’t see much effect from this tiny difference. I’m proposing a mechanism by which the oceanic cycles have been entrained to this tiny effect from the sun. Maybe we’ve been talking past each other all these years.
=============
Well, there is a 22 year cycle to the shapes of the peaks. And you have understood the clock and the fit to the oceanic cycle.
===============
I understand your 4:57 argument. We can but look some more, I guess. Curious, though, that there are 33 year events in climate and not 22 year ones.
===================
Still, it might have something to do with the timing of the effect, the shape. That would not necessarily be accounted for in your argument at 4:57. I think our difference might be that I’m suggesting a much smaller effect, entraining over eons, an effect not captured by your test.
===========
eons don’t do much for the current debate…
Yup, and yet the oceans lash to a beat.
============
LS: “The geometry of the solar wind changes over the solar cycle [hence the variation of cosmic rays], but the variation repeats pretty much the same in every cycle”
I thoroughly disagree.
Cosmic rays are an inverse proxy for sunspot cycles but not for the solar wind. Just look at the neutron rate through the mid 1970’s when the solar wind was very strong:
http://neutronm.bartol.udel.edu/listen/fig5.gif
Sigh. the cosmic ray variation has two components:
1) a major one due to the changing geometry [as I described in my link] of the solar wind
2) a smaller contribution from solar flares, CME, and other transients.
And compare the neutron count to the solar wind profile between the sunspot maxima of 1969 and 1980:
http://snag.gy/PrMAr.jpg
@ur momisugly Rob
My thoughts exactly! And it is a bloody shame that the attackers miss the point of Svensmark and only go for the Forbush events. It just shows they know that Svensmark is right.
I hope I live to see the day that Svensmark gets his Noble Prize in Physics, The man is a genius.
And give him a Noble Peace Prize too for saving humanity from the horrors of manmade climate policies.
Leif wrote:
lsvalgaard on August 25, 2016 at 2:39 pm
The geometry of the solar wind changes over the solar cycle [hence the variation of cosmic rays], but the variation repeats pretty much the same in every cycle, so there are no long-term changes.
——–
This statement, I think, does not mean anything. When you say long term, that depends on the time scales. There are an almost infinite number of time scales, feedback and lag effects. The idea that cosmic rays affect clouds is known. To dismiss the affect as net zero with what you wrote assumes everything else is constant and known. Cloud cover is chaotic and affected by many things. If we know something can effect cloud cover in a certain direction it seems reasonable that ir must have an effect.
we know something can effect cloud cover in a certain direction it seems reasonable that it must have an effect.
We don’t KNOW that there is an effect. The observations [increasing cosmic rays, global warming instead of cooling] indicate that there is no effect of the kind claimed.
Good, thanks
lsvalgaard on August 26, 2016 wrote:
We don’t KNOW that there is an effect. The observations [increasing cosmic rays, global warming instead of cooling] indicate that there is no effect of the kind claimed.
—
Leif; thank you for taking the time to entertain me. I can see that we are saying different things. I’m not saying we can see the effect on global temperatures. We can only do a controlled experiment in the lab. We cannot do a controlled experiment in the skies –we do not know what the response is with and without the stimulus in the skies. I am also not saying that delta global temperatures can even be measured, at all, especially with regard to how cosmic rays affect temperature.
What I am saying is that we do know that cosmic rays affect cloud formation in the lab at least. I believe it is reasonable to assume effects in clouds in the skies based on empirical results in the lab. I would say that if cosmic rays affect cloud formation and cloud formation affects climate, then there could and or should be some effect on climate.
LS: “a major one due to the changing geometry [as I described in my link] of the solar wind”
Sigh, that is baloney as the charts I have posted show.
But solar activity can not possibly have a direct impact on climate…
All of the models tell us that CO2 is the only variable that matters, and their predictions have all be bang on accurate so far. Why just look at the ice free poles, and the 15 foot high rise in sea level that has swallowed up Manhattan, and of course yesterday I was nearly killed by the hottest day on record again not to mention the three hurricanes and two earthquakes that global warming caused in my neighborhood.
“But solar activity can not possibly have a direct impact on climate…
“All of the models tell us that CO2 is the only variable that matters, and their predictions have all been bang on accurate so far. Why just look at the ice-free poles, and the 15-foot-high rise in sea level that has swallowed up Manhattan, and of course yesterday I was nearly killed by the hottest day on record again – not to mention the three hurricanes and two earthquakes that global warming caused in my neighborhood.”
Nice. I particularly liked the, “…and of course yesterday I was nearly killed by the hottest day on record again…”
Thumbs up, and keep it up! ;^>
Brad Crawford
The IPCC position on the influence of the sun is pretty clear:
Ref: Fig AR5;WGI; TS-07
IPCC hypothesize virtually no direct or indirect influence from the sun on earths global temperature.
By their hypothesis mankind pulled the earth out of the little ice age – well before we really started to emit CO2 into the atmosphere – truly amazing.
The usual modulation of cosmic rays is done by the changing geometry of the solar wind
================
solar wind is nowhere in the IPCC chart. Instead they reference solar irradiance.
Which is proper as cosmic rays have nothing to do with the climate.
lsvalgaard That may be true but from I observe CO2 does not either. After all the CO2 crowd has failed most if not all of their predictions as to the effects of CO2.
“cosmic rays have nothing to do with the climate”
It doesn’t look like it, but that doesn’t rule out the solar wind.
If there only were any evidence of that, it would be nice, and validate a lot of my work on this back in the 1970. But alas, that is not the case.
“lsvalgaard That may be true but from I observe CO2 does not either. After all the CO2 crowd has failed most if not all of their predictions as to the effects of CO2.”
Then why bring it up? Dr S. said nothing about CO2.
lsvalgaard, can you please provide in brief summary the key factors as you see them that influenced/caused the climate to change from cold to warm from “Little Ice Age” to early 20th Century? Cheers. L
http://www.leif.org/research/Climate-Change-My-View.pdf
Thanks LS, much appreciated, good stuff… Cheers. L
“But alas, that is not the case.”
As far as you can see…
>>Leif
>>Which is proper as cosmic rays have nothing to do with the climate.
Which is not true, if Svensmark is correct and cosmic rays do have a direct effect on cloud cover. And while the normal sunspot cycle (and therefore cosmic ray flux) shows little medium-term variation, they MUST have varied considerably during the Maunder Minimum.
So there could well be sunspot-cosmic-ray influences on climate, during grand minima. And this is just one of many forcings and feedbacks that comprise the complex drama that is our climate. So don’t expect to draw a wavy line and find the complete answer just from solar influences.
R
And while the normal sunspot cycle (and therefore cosmic ray flux) shows little medium-term variation, they MUST have varied considerably during the Maunder Minimum.
That is just begging the question. There is some evidence that the Maunder minimum was not all that different as far as the Sun is concerned: http://www.leif.org/EOS/2011GL046658.pdf
“Therefore, the best estimate of magnetic activity, and presumably TSI, for the least-active Maunder Minimum phases appears to be provided by direct measurement in 2008-2009.”
The Maunder spots were ‘large, sparse, and primarily Southern Hemispheric’. That argues for something different going on in the sun.
============
I note that H2O (g) is not listed as a greenhouse gas on this table, except for a small stratospheric contribution. Yet the chart on my wall showing radiation absorbtion bands are rather wide for H2O.
That is because H2O is described as a feedback and not a direct greenhouse gas. This discards a huge amount of physics but of course it means that CO2 can be elevated into its wholly unearned position.
They neglect completely the vast energy storage capacity of the ocean. Small but positive effects accumulated over time can have a much larger effect than the direct warming the IPCC considered.
Anyhow, IPCC regard the energy accumulation on earth – the global warming – to be the sole responsibility of human activity. There is no room in United Nations theory for long term warming by natural causes. Just as if IPCC know, without direct measurements, what the “forcings” where like in the little ice age, ending in the preindustrial times around 1750. United Nations is blaming all climatic changes since the little ice age on mankind. Pretty absurd in my mind.
Could the cosmic cloud seeding be causing the increase in extreme rain events as well (thereby turbocharging Earth’s heat removal system)?
I ask because locally at least, we’ve been blowing through rain forecasts since mid June (sometimes getting up to 2 inches when the forecast called for a couple of showers at most, and also accompanied with some unusually large temperature drops compared to a normal event). On the flipside though, it’s created perhaps one of the greenest Summer periods in memory.
No. GCR from galactic supernovas don’t get focused on Kansas. And see comment below concerning event frequency and duration based on the paper itself.
It is the dramatic cool down (.5 C) from El Nino. All that water vapor from ocean evaporation has to return to the surface.
We now have a wonderful opportunity to see if what he proposes is true, although it will take quite a few years. We are coming into a period of few sunspots and a quieter Sun and we have the satellites in place to measure results.
So those of you who don’t believe in what Dr. Svensmark presents, please keep any denigrating comments to yourself. We don’t need them.
this is a big time paper….yet…I haven’t seen anything In the huff post, WaPo. Resiliance, Yahoo, mashable, Breaking Energy about it…..hmmmm…wonder if it could be they are biased?
Perhaps it is not such a big time paper, after all.
Denial to the end.
It’s certain warrants more exposure than a crack in the Antarctic ..that all these rags picked up on. The correlation is better than the co2 correlation which Munshi sees as spurious and doesn’t pass the Monte Carlo test. The co2 rate is purely linear….slightly exponential whereas temperature is obvious not linear. I don’t know how this stacks,up with which a statistical correlation but the fit seems much better than co2
Read my comment above.
and?
I don’t think so. See following comment for details.
yes it puts a nail in the coffin of GCR having ANY measureable effect on the long term secular trends
in climate.
[you yourself have said science is never a closed cased, so stop with the ridiculous coffin metaphors, you sound like Joe Romm -Anthony]
Meanwhile, the religious trends are very obvious.
If the sun can influence cloud formation (and I really think it does over and above just emitting light), then couldn’t a ground based system generate ions in the right layers of the atmosphere to produce clouds? Kind of like treating cancer, you would have several beams that intersect at a specific spot. That would make an interesting experiment if even possible.
Produce high level clouds to reduce heat, and low level clouds to produce rain.
Of course, I wouldn’t want to be the bird that flew through the beam….
Meanwhile, yet another study that helps to explain the up and down nature of temperature without invoking ‘nasty deadly polluting CO2’ as the main culprit.
It is the sun and the evidence is mounting and by the way global cooling has begun.
“global cooling has begun”
That’s a silly statement. You don’t have any clue, and neither does anyone else.
The clue is in the ocean and I expect we’re about to see it. ARGO’s on a plateau, perhaps very slightly tilted. What’s next? We’ll see.
=============
No, Kim. With respect, it’s just jumping at squiggles, and a non-existent global temperature.
It’s not a silly statement. You’re the one who doesn’t have a clue, J.A.
“Large eruptions on the surface of the Sun can temporarily shield Earth from so-called cosmic rays which now appear to affect cloud formation.”
It seems that they always have. It’s just that now the Warmists are likely going to have to deal with it.
The fact that Earth has been warming while the Sun has been cooling certainly helps.
http://www.woodfortrees.org/plot/gistemp/from:1972/scale:200/plot/gistemp/from:1972/scale:200/trend/plot/sidc-ssn/from:1972/plot/sidc-ssn/from:1972/trend/plot/esrl-co2/from:1972/offset:-320
But, at best, you are counting your chickens before they hatch.
Read the paper. There are only 26 FD events. The strength ranking is very mathematical, but the underlying logic is weak, so whether the ranking is ‘real’ is open to question. The matching to clouds involves some semi arbitrary lags, and the end statistics are pretty weak. A Monte Carlo bootstrap does not give you a true statistical significance about the actual observed GCR/cloud data. It estimates a significance for a model of the data. So interesting, but not compelling. Especially as there are many more abundant cloud condensation nuclei sources. Turpines and isoprenes from coniferous and nonconiferous forests, respectively. Dimethylsulfide from ocean algae. Many more of those condensation nuclei in the atmosphere than from GCR, imo.
Little to do with climate even if Svensmark has made his case. 26 FD events in 16 years, with a statistically weak effect lasting about a week. ~26 weeks out of 16 * 52 = 832. Nothing happening concerning GCR and clouds the other 97% of the time that climate is still doing its thing with clouds.
ristvan,
“Nothing happening concerning GCR and clouds the other 97% of the time that climate is still doing its thing with clouds.”
Huh? Wouldn’t things “concerning GCR and clouds” be happening all the time? . . And wouldn’t small changes in total cover/mix of clouds, be essentially impossible to detect/measure at this point in time?
(I tire of people speaking in absolutes, when their title is not God ; )
And wouldn’t small changes in total cover/mix of clouds, be essentially impossible to detect/measure at this point in time?
If they are, then we cannot honestly claim that those impossible to measure changes show that GCRs are the main driver of observed climate variation, can we?
Of course not, Isvalgaard, but neither can we rightly speak of GCRs not being a significant component in climate variation . . can we?
Yes we can, because there is no real evidence for that. The past several solar cycles, the sun has become quieter and cosmic rays have increased, which should have cooled the climate. Instead it has warmed. So, no evidence of a significant GCR influence.
It would be neutral lol apparently, just saying I find it funny…
“The past several solar cycles, the sun has become quieter and cosmic rays have increased, which should have cooled the climate. Instead it has warmed.”
Several? It seems like two to me . . Should have cooled? What if there are other significant components and/or time delay aspects? The “control knob” concept is kinda simplistic as I see these matters . .
Cycles 21, 22, 23, and 24.
PS~ I utterly reject the idea that you can “rightly speak of GCRs not being a significant component in climate variation”, period. You are not God (I’m pretty sure ; )
to my mind it makes as much sense as Co2 being the main driver of climate.
Earth may have warmed during Cycles 21 & 22. The next two, not so much.
last decade the warmest ever…
http://www.climatecentral.org/gallery/graphics/10-warmest-years-globally
JK, there is no discernable GCR effect outside the FDs. In this new paper by him. My comment stands. Your logic fails.
Only in faked, totally bogus, adjusted, cooked book “surface data”.
Check me if wrong, but IMO in the UAH satellite data, the decade 1998-2007 was warmer than the interval 2008-2016, so far. This El Nino year might change that, but a La Nina appears to be setting up.
Going from memory here, so again, if wrong, please correct me.
UAH had 2014 as third warmest (or maybe 6th?), but replaced it with 2015 as third warmest in the satellite record, while 1998 remained hottest. If this year surpass 1998, then even in one of the satellite records, we’d have a new winner. But 2017 probably won’t be.
Which, now that I think on it further, means I should have included Cycle 23 as warming, even though falling from its early (1997-98) height, as it appears overall warmer than Cycle 22.
ristvan,
“JK, there is no discernable GCR effect outside the FDs.”
If an effect is “discernable” due to a reduction at times in the effective agents (GCRs in this case), then it seems to me the effect itself must be going on when the reduction is not occurring . . I don’t understand what the flaw in that logic is . . Perhaps I’m misunderstanding something about this stuff, but otherwise, I feel my statements stand . .
lsvalgaard, cycles 21, 22 and 23 were larger than cycle 20, smaller than 19; they were comparable to 18 and 17; and larger than any back to cycle 11. Since 1930, only the current one, 24, has been distinctly low — that, and the falloff from 23. I don’t expect the serious cooling quite yet.
Cycle 25 will probably not be smaller than 24: http://www.leif.org/research/Prediction-of-Solar-Cycles.pdf
LS: “The past several solar cycles, the sun has become quieter and cosmic rays have increased, which should have cooled the climate. Instead it has warmed.”
In previous solar minima, negative North Atlantic Oscillation increased, which would drive a warm AMO. That would initially give an accelerated rise in the global mean surface temperature, like there was from 1995-2005, followed by a long pause 😉
Dr Svalgaard:
You write:
“The maximum effect does not last a whole week, so any impact is at least three times smaller than what you claim”
I assume what you mean by this is “any impact is at most one third the size…..”
After all, one cant get less than one time less than any quantity.
Precision in the use of language, especially when attempting to communicate arithmetic concepts is important.
“three times less?
geez.
so any impact is at least three times smaller than what you claim
It could be four times smaller…but at least three times. Perfectly clear and understandable
https://www.ahdictionary.com/word/search.html?q=time
6. b. times Used to indicate the number of instances by which something is multiplied or divided: This tree is three times taller than that one. My library is many times smaller than hers.
The beauty of the English language [that I have come to love] is the wonderful flexibility and lack of respect for [silly] rules peddled by small minds.
There’s too much obsession with what GCRs and clouds might be doing to the atmospheric temperatures. What about what they are doing to the ocean temperatures.
================
>>Leif
>>The past several solar cycles, the sun has become quieter and
>>cosmic rays have increased, which should have cooled the climate.
Try adding the PDO and AMO cycles into the equation, before being too confident with your statements, Leif. And the reduction in solar cycles does not really take hold until 24.
R
And the reduction in solar cycles does not really take hold until 24.
http://www.leif.org/research/SC21-to-24.png
Ristvan,
26 large FD events over 16 years is 1.6 per year.
They last about a week which is 1.9% of a year.
Each of these caused a reduction in atmospheric ions of up to 20 to 30%
This equates to an annualized impact on atmospheric ions of 0.75% which is a significant impact.
Svensmark has proven in laboratory tests, and now through real world observations, that variations in cosmic rays cause variations in cloud cover. Specifically, he has now shown that solar eruptions cause variations in cosmic rays which cause changes in cloud cover.
If the FD effect on cloud cover lasts a week, I presume you would now accept that, at the very least, changes in solar eruptions do directly affect the weather! Thirty years of such changes would make it a climate change?
Don’t show you bias so blatantly. It is not 16 years, but 20 years, The maximum effect does not last a whole week, so any impact is at least three times smaller than what you claim. And you have not shown that a small fraction of a percent is in any way ‘significant’.
Isvalgaard,
To accuse someone of bias is an ad hominem attack. You then make the assertion that the effect is trivial. All you need is an appeal to authority and you have the trifecta!
Did you take into account medium and small FD events? The truth is that nobody knows what the temperature impact would be of that much reduction of atmospheric ions – or double that much – or half that much. Yet you seem certain it is trivial – I am not.
To accuse someone of bias is an ad hominem attack.
Bias is something that shows itself.
You then make the assertion that the effect is trivial. The truth is that nobody knows what the temperature impact would be of that much reduction of atmospheric ions – or double that much – or half that much. Yet you seem certain it is trivial – I am not.
The null-hypothesis must be that there is no effect. It is up to he who claims that the effect is significant to actually show [with calculation, numbers, evidence, …] that it is. Not just to say that it is.
The Last decade would expected to be the warmest still with a slowdown in the warming. Oceans have 1,000 times more stored heat than the atmosphere……..if this effect is small it can lead only to a very gradual slowdown in the warming as the great inertia from what was a previously bigger imbalance can take a couple of decades to slowly turn….as stored heat in the oceans grdually belches out…….like we’ve just seen with the recent Èł Niño.
This does not mean global cooling or even that GCR’s have a significant effect. Just that if its small but exists, you won’t find it jumping out because the new imbalance, if there is one, will be blended in slowly and challenging to separate from ocean cycles and other factors, like the additional increase in CO2.
Mike, you’re assuming that the heat won’t just stay down there. There is a temperature gradient in the ocean and the ocean should keep warming until a new equilibrium state is established.
It’s kinda silly to look for the effect in atmospheric temperatures, and argue about it, when the action is in the ocean temperatures. That’s the proposed mechanism for clouds and GCRs.
==================
Phase lags and complex systems… “Harder to pick than a broken nose” 🙂
ristvan August 25, 2016 at 2:04 pm
ristvan my friend, baby steps. What Doc Svensmark is doing is new. Records only go so far. Is he right or wrong?I do not know not enough observations and a lack of proper equipment. Some of which has to be yet designed and built. Excuse, imagined first. Right now Doc Svensmark and his merry band are proposing a alternative possibility to CAGW. Good for them.
I agree don’t treat it as fact, but do not dismiss it because it is a work in progress.
I have the greatest respect for Doc lsvalgaard and understand that professional rivalries can play a role.
The question is who is holding the Brontosaurus head.
Lastly on a different subject the Karl paper. I have been told that the agw folks had a problem with ship temperature readings, and thus are adjusting the buoys to match suspected errors.
Have they used modern comparisons with the SS John W Brown? It is a intact Liberty Ship that runs tours on the eastern seaboard. Its intake values for temp measurements should be the same as the 1940s.
Next what do you know of the Defender Engines used in smaller ships? Coast Guard vessels. Some produced by Scott 7000+ by Hudson. The Hudson engines did not have sea intake it was all internal. If their data base uses these ships ( they would have 4 to 6 engines for power plants) they have a problem.
sorry off topic its just been bothering me
michael
MM, where to begin? You want to win the climate war against warmunists, or win your own personal little skirmish? Ponder that long and hard. On old Liberty ship on one existing route using one old defender engine says NOTHING about the world. Nothing at all.
Svensmark is a skirmish, as pointed out above by event timing and duration. The big climate battles are model veracity, climate sensitivity, failed warmunist past ‘projections’, and renewables intermittency. NUTS, as General McCauliffe said at the Bulge Battle.
Nicely U Trimmed Sense 2 4.
====================
?
try again
michael
This is wrong .
Please ignore ” Mike the Morlock August 25, 2016 at 6:17 pm”
I was looking for feed back.
The ship I referenced is a museum ship. rebuilt to spec.
20,000 lite tonnes I think. My point is how can you use all of these different ships for measuring temperature without even knowing the power plants.??? The Defender and other Scott engines were Gas powered not oil and ganged to gather in Coast guard and maybe LST and LSP type ships all ocean going Are the included in temperature data bases? I Know not. Toss in lend Lease.
What I am trying to say is Using ship data is bad idea and does anyone have information as to the engineering spec.of ships of the times? I am outside my level of incompetence. Not my area.
michael
Mike,
I have been a ship’s engineer during a few years a long time ago (1965-1968). Cooling water inlet was monitored constantly, especially for the banana ships which needed a lot of exact cooling (11 +/- 0.5 °C) to prevent ripening at one side and “freezing” on the other side. In that period bucket measuring of seawater surface temperature was probably done too, but I am not sure, as that was done by the deck officers. The data were sent to the meteorological service together with wind speed, cloudiness, types of clouds,…
In the early days, there were only bucket measurements, even these changed with the type of bucket (more or less isolated or not at all). Motor inlet temperatures also differs from the bucket temperatures for the simple reason that the temperature of the upper surface and a few meters down at the motor inlet may differ with several degrees…
Even satellite measurements of the sea surface is not that easy: satellites measure the “skin” temperature, that is of the upper fraction of a mm, which can be several °C hotter on a sunny day and cooler at night than in the rest of the upper meter of water…
That all needs corrections to make the different data sources more or less comparable, which in general are quite arbitrarily for the far past.
The newest “correction” by Thomas Karl is of a different order and obviously introduced to kill the “pause”…
Like the kind of small minds who repeatedly refer to the period of time since 1850 as “ever”
Dr Svalgaard?
Way I see it is that according to Leif, the Sun could simply disappear from the sky and it wouldn’t make the slightest bit of difference to us!
Sun could simply disappear…it wouldn’t make the slightest bit of difference
==========
some solar scientists might have to change jobs.
Would it be a problem??
“Way I see it is that according to Leif, the Sun could simply disappear from the sky and it wouldn’t make the slightest bit of difference to us!”
I would say that makes you, at best, pretty obtuse. At worse, willfully ignorant.
(or maybe sarcastic?)
not for at least 8 minutes…lol
I’ve looked at clouds from both sides now.
From up and down and still somehow
It’s cloud’s illusions I recall
I really don’t know clouds at all.
Joni Mitchell.
When I read “Svensmark publishes” my immediate thought was “Pippa Passes”.
I think I have seen the light at the end of the tunnel and after a careful spectral analysis, I’m pretty sure it’s not a locomotive. 🙂
commieBob
“Pippa Passes” — Had to look that one up. Didn’t read it, read a little about it. Think I will skip it. If Pippa stands in for a poet then the premise is that a poet spreads (or at least preaches) morality as he passes through the world making the world a better place.
You know of any poets who are making the world a better place? You do get a lot of left-wing holier than thou babble smearing people who are far more moral than the poets.
Eugene WR Gallun
This girl gets one day a year off. She spends it walking through the country singing. As a result, things happen that she is totally unaware of.
You can read anything you want into poetry. I prefer to think of Pippa as Lorenz’s butterfly flapping her wings and causing a bunch of stuff plus a snow storm in Detroit (which, for some inexplicable reason, Browning omits to mention). Interesting coincidence … my Lit 100 professor became a raging drunk the same semester I took his class.
I know of one. Abai_Qunanbaiuli (1845 – 1904) is pretty much the national poet of Kazakhstan. His major work is The Book of Words. In it he excoriates his countrymen for being vain, lazy, ignorant, racist, and stupid and he exhorts them to get their asses in gear. His simple message takes a mere 45 chapters.
Did he improve the people of Kazakhstan? Perhaps. In any event, he said things that had to be said and the people loved him and did not string him up.