Guest Post by Willis Eschenbach
[UPDATE: Upon reading Dr. Shaviv’s reply to this post, I have withdrawn any mention of “deceptive” from this post. This term was over the top, as it ascribed motive to the authors. I have replaced the term with “misleading”. This is more accurate since it describes the effect of the analysis on the readers, and not the intentions of the authors. Dr. Shaviv and his co-authors have my apologies for my unwarranted accusation of bad faith.]
I see that Dr. Nir Shaviv has a blog post up regarding the recent fixing of problems in the historical sunspot record. He put up several interesting graphs and made several interesting claims, and I wanted to comment on them. To begin with, here’s an overview of his claim about the new sunspot record:
So, what do I think about it [the new sunspot data]? First, I have no idea whether the calibration is correct. They do make a good argument that the SN reconstruction is problematic. Namely, some corrections are probably necessary and there is no reason a priori to think that what they did is invalid. However, their claim about solar activity in general not varying much since the sun came out from the Maunder minimum is wrong. There are other more objective ways to reconstruct solar activity than subjective sunspot counting, and they do show us that solar activity increased over the 20th century. So at most, one can claim that solar activity has various facets, and that the maximum sunspot number is not a good indicator of all of them.
And here is his first graph, comparing the new and old sunspot data:
 Figure 1. Dr. Shaviv’s first figure from his blog post, showing the old and new sunspot numbers.
His basic claim is that the changes in historical sunspot numbers don’t make a difference, and that there is still an increase in solar activity over the 20th century. Since both datasets are very similar during the 20th century, the new/old dataset choice makes no difference. However, I wouldn’t say that “solar activity increased over the 20th century”. It increased from 1900 to 1960, and decreased after that.
He then puts up the yearly aa index data, and points out that “The AA index (measured since the middle of the 19th century) clearly shows that the latter part of the 20th century was more active than the latter half of the 19th century.” Well, yes … and the sunspot data says that as well, and again this is true no matter which sunspot dataset is used. So I’m not clear how this adds to his argument.
Next, he examines the beryllium isotope 10Be record. This record is claimed to reflect solar activity. I say it is a very poor proxy for solar activity. I’ve pointed out a variety of problems with this “proxy” in my post here. Dr. Shaviv says:
The longer 10Be data set reveals that the latter half of the 20th century was more active than any preceding time since the Maunder minimum.
Note that he’s making a brand new claim, that the latter half of the 20th century is more active than anything since 1700. Again, I must point out that both sunspot datasets, new and old, say the exact same thing. However, they differ greatly from the 10Be proxy. In addition, he is also using the 10Be data to tacitly claim a significant increase in solar strength since 1425 or so.
 Figure 2. Solar activity proxies, showing concentration of the beryllium isotope 10Be (blue), as well as the sunspots (red). From Dr. Shaviv’s blog post.
So does Figure 2 show that the old sunspot number is correct? Does it show that solar activity has been increasing since 1425, or that the sun has been “particularly active in the latter half of the 20th century”? Well … no. All it shows is that 10Be is a very poor proxy for solar activity. Let me add a few annotation lines to Dr. Shaviv’s graph to illustrate one of the reasons why it’s a bad proxy.
 Figure 3. Solar activity proxies as in Figure 2, with added lines connecting the 10Be data to the sunspot record.
I’ve added a horizontal red line at a 10Be concentration of about 1.1 or so. From there, I’ve dropped vertical violet lines to the sunspot data, and then horizontal blue lines over to the sunspot scale.
So … if the marvelous 10Be “solar activity proxy” has an averaged value of 1.1, does that mean that the sunspot level is zero, or twelve, or twenty-four, or thirty-six sunspots per year? I’m sorry, but using 10Be data as a “solar proxy” in that manner doesn’t pass the laugh test.
Dr. Shaviv’s final claim in his blog post is that there is a clear solar effect on the sea level. He says (emphasis mine):
The second point I wanted to write about is a recently published analysis showing that the sun has a large effect on climate, and quantifying it. … Daniel Howard, Henrik Svensmark and I looked at the satellite altimetry data. It is similar to the tide gauge records in that it measures how much heat goes into the ocean by measuring the sea level change (most of the sea level on short time scales is due to thermal expansion). Unsurprisingly, we found that the satellite altimetry showed the same solar-cycle synchronized sea level change as the tide gauge records.
…
You can see in fig. 4 how much the sun and el-Niño can explain a large fraction of the sea level change over yearly to decadal time scales.
In support of this idea that the small approximately 11-year variations in the sun affects the sea level, he posts the following graph:
 Figure 4. Graph quoted in Dr. Shaviv’s blog.
Figure 4 is from the paper by Howard, Svensmark, and Shaviv, The solar and Southern Oscillation components in the satellite altimetry data. Their abstract states (emphasis mine):
Abstract With satellite altimetry data accumulating over the past two decades, the mean sea level (MSL) can now be measured to unprecedented accuracy. We search for physical processes which can explain the sea level variations and find that at least 70% of the variance in the annually smoothed detrended altimetry data can be explained as the combined effect of both the solar forcing and the El Nino–Southern Oscillation (ENSO).
So to be clear, they are talking about studying how solar forcing and ENSO affect sea level. According to their abstract, they model the sea level, using solar forcing and ENSO as their independent variables, to get the purple line in Figure 4 above. And to be fair, Figure 4 shows a pretty good match between model (purple line) and data (blue dots).
Now, in order to get their model results (lovely purple line) to match the sea level data (blue dots), would you care to know how which solar dataset the authors actually used? Because after the big buildup about the sun, and about solar forcing, I was certainly curious which dataset they would choose. Would they look at TSI, total solar irradiance? Of, since Svensmark is a proponent of solar-modulated cosmic rays affecting the climate, would they use the neutron count dataset that measures cosmic rays? Or would it be something else, solar wind or something … the paper gives the answer.
…
…
…
No solar data. Period.
Not one bit of solar data was used in their study. No aa index data. No TSI (total solar irradiation) data either. No trace of the sunspot data. Not a sign of the cosmic ray information. Nothing about the solar wind. No sign of heliomagnetic information. Rude truth is, no solar data of any kind were harmed in the creation of their model … because no solar data of any kind were used.
Instead, what you see is a seven-tunable-parameter model (purple line), using solely El Nino 3.4 data as the only observational input, that has been fitted to the sea level data (blue dots in Figure 4 above). No solar data was involved at all.
Well, of course when I found that out, I had to go see why they didn’t use the solar data. After all, we have reasonable TSI data and good sunspot data for the period.
 Figure 5. Sunspot data (black, at bottom, scale on right) and satellite TSI (total solar irradiance) data (color) from a succession of satellites. SOURCE
I started by doing what the authors did. I used the detrended Colorado sea level data and the Trenberth El Nino 3.4 data. I’ll call the El Nino 3.4 Index the “ENI” for simplicity.
Next I standardized the datasets, which means I transformed them by subtracting out the mean (average) and dividing by the standard deviation. This gives both datasets a mean of zero and a standard deviation of one. I often do this to get an idea of how well related a couple of datasets might be, when they are in different units. Note that this standardization procedure does not include any tunable parameters. Here’s the result:
 Figure 6. A comparison of the standardized detrended monthly Colorado satellite sea level (red) and the monthly El Nino 3.4 data (black)
As you can see, there is a reasonably good overall correlation between the El Nino 3.4 Index (“ENI”, black) and the detrended sea level (black). Now, what we want to determine is whether the solar variation is a possible explanation for the difference between the ENI and the sea level. To do that we need to look at the “residuals”, which means the part if the sea level data that is NOT explained by the ENI. The procedure is to use the ENI values to calculate the expected corresponding sea level values. Then we subtract those fitted sea level values from the actual sea level values, and what is left are the “residuals”. These residuals are the variations in sea level which are not related to the ENI. The residuals are what we hope is explained by solar fluctuations. Here is a graph of the residuals over the period after we subtract out the El Nino 3.4 variations:
 Figure 7. Residual sea level after removal of the El Nino variations.
Now, when the authors saw that, they must have been very happy. That sure looks a whole lot like a solar-related variation to me. So what’s not to like?
Well, as also unfortunately happens at times with my own ideas, a beautiful theory founders on a hidden reef of data. Let me overlay the actual solar variations on top of the residual sea level shown in the figure above. I’m showing both the sunspots and the TSI, so you can see how the sunspots are an excellent proxy for TSI.
 Figure 8. Residual sea level as in Figure 7 (black), overlaid with the sunspot (blue) and TSI (red) data. This is the new sunspot data, but for this period the new and old data are nearly identical.
I’m sure you can see the problem the authors faced with using actual solar data … the TSI/sunspot records (red/blue) start out well correlated, with both bottoming out in about 1996. But then, the TSI/sunpots inconveniently peak around 2001 and bottom out around 2008-2009. Meanwhile, sea level peaks at around 2006, about five years after the TSI/sunspots, and doesn’t bottom out until 2011 … no bueno for their lovely theory.
So, just what is a poor scientist supposed to do in such a case? Sadly, what Dr. Shaviv and the other authors decided to do was to just add a simple sine wave to the model and claim that it is the “solar term”. Here’s their graph of their so-called “harmonic solar component” …
 Figure 9. The “harmonic solar component” used in their model
And here’s how it fits into the previous figure …
 Figure 10. As in Figure 8, but overlaid with their “harmonic solar component” (black/yellow). For clarity I have not shown the underlying TSI/sunspot data, only the gaussian averages (red/blue).
How lovely! You see that a sine wave (black/yellow line) is a pretty good fit to the sea level over the period. The only problem is that despite the authors calling it the “harmonic solar component”, there is nothing “solar” about a sine wave at all. Zero. Nada. It has nothing to do with the sun. Instead, it is merely a 12.6 year sinusoidal cycle that has been fitted to match the sea level data.
And why have they chosen a 12.6 year cycle? The study says:
Last, we take P = 12.6 years, which is the duration of the last solar cycle.
However, I note that the actual length of the last solar cycle was 12.4 years (trough-trough, from the data shown above). I also note that the best fit of the simple sine wave to the residual sea level data gives a “harmonic solar component” with a period of 12.61 years. It is possible that is a coincidence.
Conclusions? In no particular order …
• The 10Be beryllium isotope truly sucks as a solar proxy when used as it was in their study.
• Climate science is in a horrible state when you can pass off a bog-simple 12.6 year sine wave as a “harmonic solar component”. The journal, the peer reviewers, and the authors all share responsibility for this highly misleading study. The study is not about “The solar and Southern Oscillation components in the satellite altimetry data” as the title claims. Iit’s not about solar anything. Instead, it is about fitting a sine wave to sea level data. That is false advertising, not science of any sort.
• Finally, a seven-parameter model? Have these folks never heard the story of Von Neumann’s elephant? Obviously not … so I attach it for their edification. In any case, they have the following parameters in their model:
The intercept parameter, which adjusts the model results vertically
The trend parameter, which sets the trend of the model results
Three sine wave parameters (amplitude, phase, and period) for their grandly-named “harmonic solar component”
The ENI index parameter, setting the effect of the ENI
The ENI index integral parameter, as they’ve used both the ENI and the integral of the ENI in the model
Seriously? Seven tunable parameters? Von Neumann weeps …
In any case, summer is here, the day is warm … I’m going walking in the solar forcing.
Best to all,
w.
The Usual: If you disagree with someone, please quote the exact words that they used that you disagree with. I’m tired of being accused of things I never said. Quote the words you object to so we can all understand what you are getting at.
[UPDATE]: In the comments, Brandon Shollenberger says correctly, albeit quite unpleasantly, that I was remiss in not discussing the authors’ stated reason for using a fitted sine wave in place of the real solar data, so let me remedy that oversight. They say:
The above empirical fit assumed a harmonic solar forcing. Although it is only an approximation, it significantly simplifies the analysis. By describing the radiative forcing anomaly as a complex number: ΔFsolar(t) = ΔFsolar exp(−iωt), each component of the sea level can then be described with a complex amplitude. The phase will then describe a lag or lead relative to the solar forcing.
Let me begin by saying that if the real solar data had fit the sea level record, if the actual solar observations had provided strong and unequivocal support for their hypothesis that tiny variations in the sun affect the sea level, they would have used the real data without a qualm or a question. And rightly so, I’d do the same myself, as would you or anyone. Finding such clear evidence of solar influence would be the jewel in the crown, it would be the final piece to the puzzle that folks have searched for over centuries.
But the fact is, as the graphs above clearly show, the solar data does NOT match up with the sea level residuals, not in any sense. And it also doesn’t match up with the sine wave, so their claim that the sine wave is an “approximation” of the solar data doesn’t hold water either.
As a result, we can start with the certain knowledge that they have left out the main explanation for why they didn’t use the solar data—because it didn’t fit the sea level residual for beans. They’ve put a sine wave in their instead and called it a “harmonic solar component”. I call that highly misleading.
However, there is another, larger reason that describing the sine wave “solar” anything is misleading, which is that it “begs the question”. This oft-misused expression means that the speaker assumes what they are trying to demonstrate—in this case, they assume that the cause is the sun, and go forwards with that unproven, untested, and unlikely assumption. They have assumed that the solar variations are the missing link in explaining sea level variations, but that solar-sealevel connection is exactly what the authors are trying to prove! Circular logic at its finest.
So they can’t assume that connection, they have to demonstrate it … and unfortunately, the solar data doesn’t support it.
Let me try to clarify this by example. Suppose I’m studying the effect of gamma rays on marigold growth. And unfortunately for my lovely hypothesis, the gamma ray data is uncorrelated with the marigold growth data.
But I notice a sine wave can be fitted to the marigold growth data quite well, and the sine wave kinda sorta looks a bit like my gamma ray data, and even better, using the sine wave allows me to “significantly simplify the analysis” … sound familiar? So I throw away all of my gamma ray data, and I just use the sine wave in my analysis.
Here’s the question. Given that there is no gamma ray data of any kind in my study, am I justified in calling the sine wave a “harmonic gamma ray component”, and calling the cycle of the sine wave the “gamma ray cycle”? Or is that misleading?
I say it is misleading as hell, because it leads the reader to believe that gamma rays and the “gamma ray cycle” are indeed the cause of variations in marigold growth, when in fact my gamma ray study showed the opposite, little correlation. Here’s the bottom line. Once I pull out the gamma ray data and replace it with a sine wave, I no longer have a gamma ray model. I have a sine wave model. My sine wave model can only tell me if there is an apparent sine wave component to the marigold growth. It can’t tell me anything about gamma rays because there are none in my model.
Note that the same thing is happening in their paper. Despite the fact that the solar cycle is clearly NOT correlated with the sea level data, and despite the fact that there isn’t one scrap of solar data in their study, they call a simple sine wave a “harmonic solar component”, they ascribe causality to “the Sun”, they call what their model shows “solar forcing”, and they talk at length of “solar cycles” in an effort to persuade the reader that they’ve demonstrated their case about the sun causing sea level variations … when in fact, the data shows the opposite, little correlation. Here’s the bottom line. Once they pull out the solar data and replace it with a sine wave, they no longer have a solar model. They have a sine wave model. Their sine wave model can only only tell us if there is an apparent sine wave component to the sea level. It can’t tell us anything about solar variations because there are none in their model.
And that’s why their paper is misleading. Here’s the simple version. If you have to use a sine wave because the solar data doesn’t fit, you can’t claim it is a “harmonic solar component” when that is what you are trying to prove … even if it ”significantly simplifies the analysis”. It may indeed let you simplify the analysis, or it may not, but that doesn’t magically make it a “harmonic solar component”. It’s a fitted sine wave, and claiming otherwise is misleading.
Finally, the authors never seem to have considered the effect of their replacement of actual data with a sine wave. While it is true that you can do analyses using a sine wave that you can’t do using the real data, because the real data doesn’t look like a sine wave … doesn’t it seem to you that the results of said analyses are likely to apply only to the world of the sine wave, and not to the world of the real data?
Freeman Dyson tells the story of Von Neumann’s elephant (emphasis mine)
We began by calculating meson–proton scattering, using a theory of the strong forces known as pseudoscalar meson theory. By the spring of 1953, after heroic efforts, we had plotted theoretical graphs of meson–proton scattering.We joyfully observed that our calculated numbers agreed pretty well with Fermi’s measured numbers. So I made an appointment to meet with Fermi and show him our results. Proudly, I rode the Greyhound bus from Ithaca to Chicago with a package of our theoretical graphs to show to Fermi.
When I arrived in Fermi’s office, I handed the graphs to Fermi, but he hardly glanced at them. He invited me to sit down, and asked me in a friendly way about the health of my wife and our newborn baby son, now fifty years old. Then he delivered his verdict in a quiet, even voice. “There are two ways of doing calculations in theoretical physics”, he said. “One way, and this is the way I prefer, is to have a clear physical picture of the process that you are calculating. The other way is to have a precise and selfconsistent mathematical formalism. You have neither.” I was slightly stunned, but ventured to ask him why he did not consider the pseudoscalar meson theory to be a selfconsistent mathematical formalism. He replied, “Quantum electrodynamics is a good theory because the forces are weak, and when the formalism is ambiguous we have a clear physical picture to guide us.With the pseudoscalar meson theory there is no physical picture, and the forces are so strong that nothing converges. To reach your calculated results, you had to introduce arbitrary cut-off procedures that are not based either on solid physics or on solid mathematics.”
In desperation I asked Fermi whether he was not impressed by the agreement between our calculated numbers and his measured numbers. He replied, “How many arbitrary parameters did you use for your calculations?”
I thought for a moment about our cut-off procedures and said, “Four.”
He said, “I remember my friend Johnny von Neumann used to say, with four parameters I can fit an elephant, and with five I can make him wiggle his trunk.”
With that, the conversation was over. I thanked Fermi for his time and trouble,and sadly took the next bus back to Ithaca to tell the bad news to the students. Because it was important for the students to have their names on a published paper, we did not abandon our calculations immediately. We finished them and wrote a long paper that was duly published in the Physical Review with all our names on it. Then we dispersed to find other lines of work. I escaped to Berkeley, California, to start a new career in condensed-matter physics.
Whilst the discussions on what caused the ice ages (or brought them to an end) is extremely interesting, there is an obvious explanation as to at least one component part. The details are murky, and of course, the devil usually lies in the detail.
Of much more relevance to today, and the (c)AGW hypothesis is what caused the Holocene Optimum and the variation of temps within the Holocene, notably the Minoan, Roman and Medieval Warm Periods, what caused the LIA, and what brought us out of the LIA?
These are the questions that need to be answered, and if proxy evidence on CO2 is correct, it is obviously not CO2.
Some suggest that these events may not have been global but were restricted to the NH. This assertion is based on the lack of evidence regarding the SH. The absence of positive evidence does not prove anything notwithstanding the famous Sherlock Holmes line about the dog that did not bark. The fact that the SH contains more ocean and that there were no advanced civilisations in the SH whose history or written record has been influenced by climate is reason enough not to be concerned by the lack of evidence as the extent of these warming (or cooling) periods in the SH.
Further, even if these warming (and cooling) events ere in fact limited to the NH, that in itself raises interesting questions as to the mechanism that would result in warming (or cooling) of only one of the hemispheres. One might expect some variation in response of the two hemisphere due to the different distribution of ocean and land mass, but not a complete absence of effect.
Until we can answer and explain the warming and cooling seen in the Holocene, we will never get a grip on (c)AGW.
Until we can completely explain what we mean by natural variation, what it consists of, and the forcing associated with each and every individual component (including where there is variability in each forcing, the upper and lower bounds of each constituent forcing), we will never be able to get a grip on (c)AGW. In short, we do not know whether the pattern of warming seen since the start of the industrial age is anything beyond that which may be expected from natural variation within the climate system.
One only has to look at the range of past temperatures of the earth to appreciate that natural variation can potentially be substantial, and whilst we may not yet understand matters, the most obvious explanation for the range of natural variation is variations in the extent of solar insolation reaching the surface and/or being absorbed by the oceans.
I am extremely sceptical of all the curve fitting, but that said, I still consider that although mechanisms are presently not known still less understood, variations in solar insolation (whether these be variations is solar out put in some specific or all wavelengths, cosmic rays, variations in the Earth’s magnetic field, changes in patterns/extent of cloudiness etc) is likely to be the dominant component of natural variation.
I am surprised that at a time when the sun appears to be going through a quiet period (whatever that might mean) and whilst no one knows for how long, someone would wish to rule out the sun as a major driver of climate variation/change. We will probably know within the next 15 years whether the sun is a significant player (although even then, we may not understand why), such that I would have expected every reasonable person/scientist to have an open mind.
Let’s wait and see how the future pans out, and we will then be in a much better position to judge the importance of and the role of the sun in influence climate variation here on planet Earth.
>>The details are murky, and of course,
>>the devil usually lies in the detail
>>Let’s wait and see how the future pans out,
Re: Ice Ages.
The problem is we are being told: “Its the Milankovitch cycle, its the Milankovitch cycle, the science is settled, the science is settled, stop asking difficult questions.”
Sorry, but that is not science. A true scientist would admit that we are not entirely sure, but we are confident that Milankovitch cycles are one factor, and the topic is still under investigation.
But the science is most certainly NOT settled.
Ralph
Excellent review, Richard Verney. I suspect proxies from the Southern Hemisphere out rank historical information; proxy analysis is maturing and many of them are demonstrating the global nature of various warming and coolings that have been disputed.
But your paragraphs are solid sense, they stick to the ribs of the bare skeleton that is climate science today.
=============
I enjoyed this climate cycle video from a former NASA meteorologist, he explains the lunar cycle impact on the Arctic. http://notrickszone.com/2015/08/12/now-starting-to-see-a-dramatic-cooling-in-the-arctic-says-former-noaa-meteorologist-extremely-cold-from-2025-to-2050/#sthash.3GL7rkYM.BMPvydBp.dpbs
Willis referred to the circularity in assuming a (solar) component in order to prove it as ‘deception’. This was translated by some people as Willis saying the deception involved the authors doing something they did not describe. Following this literal reading it becomes trivial to quote from the paper to show that the authors did indeed describe what they carried out in their methods section (which of course they would but that was not the locus of the said ‘deception’). The confusion engendered by this sort of talking at cross-purposes, which some people are forever intent on perpetrating, results in bad blood.
My own suggestion, if I am anyone to make suggestions, would be to simply rescind the word ‘deception’ and keep everything else the same. Willis’ points stand regardless of any ‘deception’, a word that carries different connotations in different contexts and is understandably provocative.
As Willis says in the comments above:
Quote:
I wasn’t so much curious about what started the ice ages as I was by the strength of the ~21,000 year cycles. My question was, why don’t we see temperature variations based on those cycles?
Indeed, the change in gross insolation is about 80-100 wm2, and yet the climate does not appear to react to that massive change in energy at all.
http://s16.postimg.org/63v3fs8xx/Last4_Ice_Ages_Milankovitch.png
And if the climate is not responding to a 80 wm2 change in insolation, as it failed to do 170k and 280k years ago, we can be sure of a few things:
a. The climate is stable, self-regulating, and insensitive to relatively large changes in insolation.
b. The small change in forcing-feedback caused by CO2 (however much it is) cannot be responsible for temperature changes.
c. Milankovitch cycles cannot be solely responsible for ice ages.
But the ice ages did coincide with rising insolation. So what was the difference between previous rises that produced no climatic reaction, and the rises that caused the sudden end of an ice age? What is the 100k-year modulating factor that will allow rising insolation to have a great er effect. And don’t say CO2, because that lags temperature. And CO2 cannot have a 100k-year driving periodicity, as opposed to a 100k-year reactionary periodicity.
My best guess comes back to the Sun – the very thing that Leif will not consider. In my view, an ice sheet sitting over northern England and all of Canada is untenable in the modern climate. The summer weather is simply too warm and sunny to not melt the ice sheets. In which case, the ice ages are likely to be invigorated by excess cloud cover, which prevents the winter ice from melting. And then every 100k years the clouds part and the ice melts.
In which case, we may come back to the Svenmark theory for a cause of the ice ages. The high neutron, cloudy ice age is in full swing. But then the neutron flux reduces, less clouds are formed, the skies clear, and the ice age suddenly ends. And the neutron flux can be modulated either by the Earth and its magnetospere or by the Sun’s activity.
So what component in this proposal, would give a 100k-year periodicity?
Ralph
the Sun – the very thing that Leif will not consider
On the contrary, I have considered this at great length, but just found it wanting.
The Svensmark theory, in particular, is a failure. The cosmic ray modulation the past three hundred years has no correlation with climate. Milankovich theory is in good shape: http://wps.prenhall.com/wps/media/objects/2513/2574258/pdfs/E16.7.pdf
Sorry, but this link is a mark of desperation. A scientific ‘explanation’ without a single graph. Yeah, that’ll work. What it actually says here is:
Start quotes:
“Why did the strong effects of obliquity and precession provoke such a weak response, while to weak 100,000 year cycle provokes such a strong response?”
“Some guesses have been advanced that … The oceans could lock into a 100,000-year cycle somehow”
“The 100,000 year oscillation of Earth’s passage through the ecliptic … None of these possible explanations seems particularly convincing”
“An intriguing answer may be that the 100,000 year (is) a frequency modulation effect”
“This dynamic oscillation may play a role in reality, but it seems to need more theoretical grounding.”
“Examination of data from a lake in Hungary from 2.6 to 3.05 million years BP do not
show the Milankovitch timing at all.”
“… seems to indicate there is a problem in our understanding of the Milankovitch mechanism. The physics of the situation has no easy explanation.”
End quotes.
.
What they are doing here, is guessing. That’s ok, that is how the scientific process starts – with a guess. But please do not try and convince us that Milankovitch ice ages are a fully-fledged and proven hypothesis. They just do not have a clue about what causes the 100k-year ice-age cycle. In fact, this is about as convincing as the idea that nearly every event on the planet is caused by a trace gas in the atmosphere. (Which demonstrates how far science has sunk into the abyss of consensus conformity. Joining a band-wagon, is NOT science.)
Top 100 effects of CO2:
https://www.americanprogress.org/issues/green/news/2007/09/24/3462/the-top-100-effects-of-global-warming
And another thing this article does not address, let alone answer, is why the climate refused to respond to strong Milankovitch forcings on numerous occasions, just as Willis pointed out. It just glides on through these warming cycles as if nothing was happening, waiting for the 80 to 120 k-year event that allows an interglacial to proceed. That aspect has not been explained whatsoever, by this or any other paper you have presented on this thread.
And neither have you explained how an ice sheet can survive as far south as the north of the USA, or the Midlands of England, during a summer with 10% more N hemisphere insolation than we have today. Do you really think that is going to happen?
The only way out of that conundrum, as far as I can see, is wall-to-wall cloud cover. So what the scientific community need to do is stop resting their laurels upon Milankovitch cycles, because we know that side of the equation, and start looking into how cloud cover can vary on global scales with a 100k-year cycle. It may also be interesting to see if there is a cloud-cover signature in the plant record. I am sure different plants will thrive, depending on whether there is permanent cloud cover or broken skies.
Thinking out of the box, is an essential component in scientific discovery and progress. Because the science is NOT settled.
Cheers,
Ralph
I see that you omitted the most important quote:
“It is now generally agreed that the orbital effect is the primary cause of glacial interglacial changes in an ice age climate because of development of recent evidence supporting the theory.(122,125,228) Models also seem consistent with observation.(234) On the twenty-fifth anniversary of the publication of Ref. 224, Crowley commented that any initial “skepticism faded as evidence for a widespread imprint of orbital cycles in the geologic record mounted.”(235) He goes on to write: “In the 25 years since the publication of [Ref. 224], the importance of Milankovitch cycles has penetrated many areas of paleoclimatology. These data, and some classic land sections … have helped scientists to stitch together a near-continuous orbital-scale chronology for the past ~40 million years, allowing much more precise timing of important evolutionary and extinction events and better estimates of the timing and rate of climate change.”(235)”
>>I see that you omitted the most important quote:
Yes, I read that quote too. But that is simply the desperation of a man who wishes to stay within the consensus.** Quote: “Models seem consistent with observation.” Yeah, great, and with another parameter they could have made the Milankovitch trunk wiggle.
But what both he and you have not explained, is how a 10% Milankovitch increase in insolation for thousands of years will have no effect whatsoever on steadily declining temperatures. Until you have explained that, the theory is worthless.
And your refusal to engage with the many problems with the Milankovitch theory is quite informative. You will normally have an answer and explanation to everything, but here you simply deflect and evade. Why? Because you know there is a problem with the consensus view, but you will not address it nor confront it.
You are, in effect, doing what the supposed 97% of scientists who ‘agree’ on climate change are doing – giving equivocal answers to evade the issue, so as not to rock the consensus boat.
Ralph
** A shameful part of all modern sciences, but quite prevalent.
Paul Nurse’s BBC hatchet job on climate skeptics was a good case in point – not one iota of balance within the entire program. This was BBC and Royal Society propaganda, not science, and even I could see the many errors in his assertions and arguments. It was proven, so he said, that recent warming is man-made, because it was happening ‘quickly’. Errr – any quicker that the Minoan, Roman or Medieval warming periods, or the Little Ice Age? No. This propaganda program was not science, it was simply Paul Nurse hanging on to his job as the president of the Royal Society.
And a wonderful program on the Anglo-Saxon invasions of England. The program set out to demonstrate that the current view was wrong, and there was NO major invasion by the Anglo-Saxons. And then at the end he comes on and says ‘and so this proves that the British have always been a multicultural nation with a large proportion of immigrants’. But this was a political statement, to garner government funding, and the complete reverse of what the historian had previously argued.
So do scientists and historians amend their views to suit the political climate? Of course they do.
R
I consider the evidence strong enough to accept the Milankovich theory as ‘a cornerstone of climate science’. The details will be worked out with time. Already, some progress has been made, e.g.
“Basic physical arguments are used to show that, rather than focusing on the absolute global ice volume, it is much more informative to consider the time rate of change of global ice volume. This simple and dynamically-logical change in perspective is used to show that the available records support a direct, zero-lag, antiphased relationship between the rate of change of global ice volume and summertime insolation in the northern high latitudes” From http://www.leif.org/EOS/2006GL027817-Milankovich.pdf
But that is simply the desperation of a man who wishes to stay within the consensus. Models seem consistent with observation
If you took the trouble to actually study the paper you would find this graph (Figure 3):
http://www.leif.org/research/Milankovich-Fit.png
as a example of how good the fit is. This is good enough for me. No desperation here. Just good science.
As I read the various post I have come across one common denominator which is everyone is trying to come up with a one item cause and effect for the explanation as to how the climate may change.
If one looks at my post sent at 8:49 am Aug 15 , I showed all the different factors that are involved that play a role in why/how the climate may change to one degree or another.
Milankovitch Cycles are definitely in the mix and like solar variability how effective they are or not depends on the 9 other points I had presented in my post sent at 8:49 am Aug 15.
For example why did Milankovitch Cycles only start to cause inter-glacial /glacial cycles for only the past 2.5 million years or so and not prior to this time?
The reason most likely was the land/ocean arrangements and the initial state of the climate being far from the glacial/inter glacial threshold.
It was not because Milankovitch Cycles did not play a role in the climate back then as they do now , but the role they played was obscured by other factors not acting in concert with the Milankovitch Cycles.
This is the point I keep trying to make (mostly in vain), that it is a combination of factors that have to phase in the right way, at the right time to give that big climatic impact and why many times when one item is being used to be associated with the cause as to why the climate changed gets lost in noise and or gets obscured. The reality being however, it does still play a role but is being obscured by other forces at play at the same time.
This is why it is so easy to say this item or that item does not play a role in how the climate changes and why it is so hard to show the link between an x item changing and the climate changing.
Here is his reply.
I think my reply however to Willis is better.
To anyone following the sunspot story, Nir Shaviv responds to Willis Eschenbach’s critique
http://www.sciencebits.com/reply-eschenbach
Shaviv says: ” nobody promises us that long term variations in the solar wind will be the same as the long term variations in the sunspot number”.
Well, I shall promise him that. The solar wind is controlled by the open magnetic flux, and the long-term variation of that flux [and of the cosmic ray modulation] is very similar to the sunspot number:
http://www.leif.org/research/Usoskin-et-al-2015.png
Leif proves my point with the bottom graph which is lower global temperatures are present in the period 1640-1710 and 1790-1845 when minimum solar activity was present for long durations of time.
Even the period 1880-1920 exhibited cooler global temperatures with again somewhat weaker solar activity.
Let me say this about Leif. As far as skills in making solar predictions one has to take that seriously agree or not.
The climate issue is another matter ,but it comes down to two basic arguments which are how much variability does the sun exhibit in totality (all of the various solar parameters) and is that variability enough to impact the climate?
It is not a straight forward question mainly because the data gong back prior to recent times is not black and white and as I have said many forces are acting upon the climate at the same time.
how much variability does the sun exhibit in totality (all of the various solar parameters)
All of those have shown no long-term trend over the past 300 years, so would predict [if the sun is the primary driver] that the climate also would have no long-term trend over the past 300 years.
No that is not correct because the data shows to various degrees a global temperature decrease at times of prolonged minimum solar periods of time.
That is what the data show with each prolonged solar minimum period of time.
No that is not correct because the data shows to various degrees a global temperature decrease at times of prolonged minimum solar periods of time.
Except not the the recent minimum.
But we are discussing the long-term trend, not the minima.
The problem and the reality is something is causing a semi cyclic climatic cycle within the larger Milankovitch induced climatic cycles and through the process of elimination the sun along with the 9 points I made in my earlier post are prime candidates when viewed in totality , unless one has another explanation.
If it is earth bound intrinsic factors how /why would they result in a semi cyclic climatic pattern if they themselves are not only random and chaotic but are impacting a system that acts in a non linear fashion?
Milankovitch Cycles yes for the big picture but not for periods like the YD..
AMO cycle of 30 years falls and 30 years to grow. The trend nil. But for people in the UK is colder 30 years and 30 years warmer.
http://www.woodfortrees.org/graph/esrl-amo/from/trend/plot/esrl-amo/from
Hmmm, is the recent minimum prolonged?
So there’s a trend, huh. What’s causing it?
===============
No, the recent minimum is very much as the minima 100 years ago and 200 years ago. Is climate the same? No.
SDP, what limits whatever multiplying factor there might be in the some aspect of the full spectrum of the sun. Well, uh, clouds could; likely do.
==============
>>Except not the the recent minimum.
Oh, come on Leif, give it a chance.
The climate is not going to turn on a sixpence (pre-decimal currency).
And if winters are a key measure, rather than some randomly smeared global average temperature, then I might point to the US and the UK already having some of the severest winters we have had in decades and centuries. And that is before the solar minimum has even got started.
R
Today where I live the temperature is 100 F. Weather is not climate, and weather in cherry-picked locations even less.
Since there has been no long-term trend the past 300 years in Galactic Cosmic Rays, Svensmark’s GCR-cloud hypothesis is already falsified unless you maintain that there also has been no long-term trend in climate the past 300 years.
Leif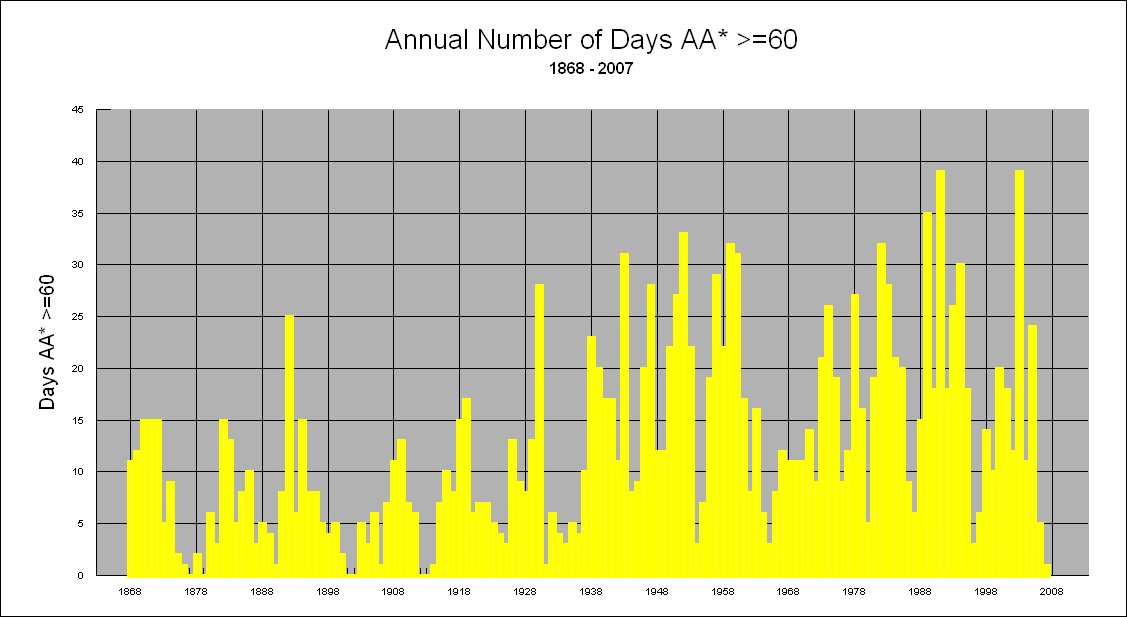
Since there has been no long-term trend the past 300 years in Galactic Cosmic Rays, Svensmark’s GCR-cloud hypothesis is already falsified
____________________________________
But the Geomagnetic aa index does have a rising trend.
Image from NGDC-NOAA days >60
.
And Tallbloke’s reduction to days >50 extenuates the similarities to sunspot activity. I presume he is correct in this, since it is a copy of a Stanford graph.
http://soi.stanford.edu/results/2001_MDI_sr_review/images/Image67.gif
.
So there is a link between sunspots, Ap and Aa, and possibly therefore a link to terrestrial climate too. It is not my job to find out what that link is, I have another profession entirely. It is a combination of your job and honest climate scientists, if such a thing exists.
Cheers,
Ralph
As I have pointed out several times, the aa-index is also wrongly calibrated with a discontinuity in 1957 [aa was too low before that], see e.g. Section 5.3 of http://www.leif.org/research/2007JA012437.pdf
“The jump at 1957.0 is 2.9 nT or 12% of the average value of Aa. At times where Aa is much smaller, such as at the beginning of the 20th century, the percentage discrepancy is much larger (40%). We interpret the difference to be an indication that the calibration of aa as measured by rotational means before 1957 is in error by this amount”. This has now been widely accepted.
It has since been possible to re-evaluate geomagnetic activity. Here is the Ap index since 1844 [Ap and Aa measure the same thing]:
http://www.leif.org/research/Ap-index-peaks.png
The red arrows point to the maximum that always occurs during the declining phase of the cycle due to coronal holes and high-speed solar wind streams.
The one item about climate change is how does one explain the abrupt climate changes which the very slow Milankovitch Cycles can not be reconciled to?
I have addressed this to some degree in my earlier post sent at 8:49 am Aug.15.
This abrupt climatic change(the why/how aspect) issue needs to be addressed before we can say we understand why the climate changes.
For example bond events, the 1470 year climate cycle, the YD sudden beginning and ending which by the way is not an isolated event but has happened many times in the historical climatic records.
Salvatore look at this chart. What do you think AMO will fall? What happens with the trend?
http://www.woodfortrees.org/graph/esrl-amo/from/trend/plot/esrl-amo/from
Is the next few years the trend AMO drops below the zero? Is CO2 will help maintain the temperature of the ocean?
Ren,
My thought is sea surface temperatures in general will be declining due to prolonged solar minimum conditions.
Kim
The sun along with the 9 points I made in my earlier post is what influences the climate when those points are taken in totality.
If secondary effects such as cloud coverage changes, geological activity changes or atmospheric circulation changes are tied to solar activity it then just makes the solar /climate connection that more compelling.
The present prolonged solar minimum period(post 2005) has just started and needs to play out.
I say if this was 1660 today would be a spotless sunspot day.
In addition we have three sunspot counts presently
NOAA -68.4 for Jun.
ISES -36 .0 for Jun.
Layman -25.5 for Jun.
In addition just to show sunspot activity does not tell the entire story look at the geo magnetic activity the last few days versus sunspot activity.
In addition just to show sunspot activity does not tell the entire story look at the geomagnetic activity the last few days versus sunspot activity.
Or, even better: five minutes ago…
Since 2010.
http://www.woodfortrees.org/graph/esrl-amo/from:2010
Who cares? That is not the long-term trend.
Just an observation. You can’t warm the oceans and surface if the irradiation doesn’t reach the surface. Sunspots only tell 1/2 the story. You can have the hottest sun in history, but if clouds reflect back most of the irradiation and prevent it from reaching the surface, the earth’s lower atmosphere won’t warm.
What makes the clouds? Water evaporated from the sea. What makes the water evaporate? Sunlight. More Sun, more clouds. Sunspots tell the story of how much sunlight impinges on the Earth.
“For example why did Milankovitch Cycles only start to cause inter-glacial /glacial cycles for only the past 2.5 million years or so and not prior to this time?”
Good question.
Milankovic cycles were there for 100s of millions of years, however the N. Atlantic – Arctic oceanic currents gateway was substantially affected by rising of submarine ridges to the south east flank of Iceland, coinciding with creation of a new volcanic zone in the southeast (Katla–Vatnajökull) about 3 million years ago.
Shaviv’s reply to Willis. Here’s a small sampling of it…
http://www.sciencebits.com/reply-eschenbach
It is hard for me to find even one correct statement in Eschenbach’s piece, which leaves so many wrong ones to address.
Let me start with his main crux. Eschenbach claims that in the paper by Howard, Svensmark and I, we have approximated the solar cycle as a sine with arbitrary phase instead of using a direct proxy. He then continues to fit the satellite altimetry data to the ENSO, and then fit the residual to the sunspot number. When he finds no correlation, he resorts to all sorts of negative remarks to describe our work, and in particular writes that “The journal, the peer reviewers, and the authors all share responsibility for this deception”.
But more importantly, to reach his conclusions, Eschenbach assumes that if solar forcing has a large effect on climate, the sea level should vary in sync with it. This assumes that the sea level adjusts itself immediately to changes in the forcing. This ignores the simple physical fact that the heat capacity of the oceans is very large such that the oceans are kept far from equilibrium. Instead, it is the amount of heat, and therefore the sea level through thermal expansion that is expected to be proportional to the solar forcing. In other words, instead of comparing the sea level to the sunspot number, which is what Eschenbach did, he should have compared the sea level change rate to the sunspot number. If we look at his figure, and differentiate the sea level by eye, we see that this is exactly the case!
It is quite upsetting that Eschenbach did this mistake even though it was clearly explained in our paper, and it is also explained in my previous paper from 2008, where one can clearly see that the sea level change rate varies in sync with solar activity over more than 80 years.
I have been lurking here for a while and I find the whole thing rather amusing. Willis Eschenbach tried to tear down Shaviv’s post and article. Shaviv replied and appears to have completely shredded all of Eschenbach’s arguments. Yet, all that Eschenbach could do is to slightly apologize for calling Shaviv and his colleagues “deceivers”. What about replying to Shaviv’s main point that Eschenbach found no correlation because he should have considered the rate of change of the sea level and not the sea level itself??? If Shaviv is correct (and so it appears!), Eschenbach just polluted blogsphere with wrong accusations using bad language.
i can’t help but wonder “if it fits a 12.61 sine wave, albeit not the sun what else is producing this?”
most likely a “tidal cycle” just like the moon does affect the sea tides daily and moon – sun positions affect it monthly, i would not be surprised to see planets and planet conjunctions affecting it in other cyclic ways albeit ways smaller. but that has nothing to do with solar activity. The only “near perfect” sine wave to my knowledge in a system are thus the planet positions from the sun’s viewpoint, and even those do vary a lot seen from earth’s viewpoint…
good piece of review
Willis is wrong on the Be10 as a proxy I think. Look at the Be10 and aa Index. They both have the same rising trend through the whole of the 20th century (unlike sunspot number). Be10 might not be a good proxy for some solar metrics, but it appears to match the aa Index. I’m probably not the first to bring this to his attention, it seem like such an obvious error in his analysis.
What we all need to do is watch and see what happens to solar activity going forward and then what if anything happens to the climate going forward.
This is really the first opportunity since the Dalton Solar Minimum to see what effects a prolonged solar minimum may have on the climate.
Again the other 9 points I had said earlier have to be included in the evaluation ,in my earlier post made on this site.
As far as the AP index there is no doubt that in the several decades prior to year 2005 the index was MUCH higher in contrast to the years post 2005 thus far.
But not compared to the several decades prior to 1880:
http://www.leif.org/research/Ap-index-peaks.png
When dealing with climate you must take the long view not just the past few years, or days, or minutes…
Here is the question which I do not have a real answer to which is in 2005 to use a year the solar activity became much less in contrast to the years prior to 2005.
What does this mean for future solar activity ? That is the question, is it going to continue this way, pick up again or what?
Leif if you answer I hope you can give the why behind your conclusion. Then again I do understand this is not an exact science.
The reconstructions of Ap and aa in the past is described here
http://www.leif.org/research/IAGA2008LS-final.pdf and here
http://www.leif.org/research/How%20we%20determine%20solar%20wind%20parameters%20for%20the%20past%20150%20years.pdf
The question is what is future solar activity going to be like?
No, as far as explanation the past and present situation at this point in time, guesses about the future are not helpful, but smacks more of wishful thinking .
It is not wishful thinking it is wanting to know and time will tell.
My eyes this time will be on the solar wind speed. During the last severe solar lull 2008-2010 the solar wind speed stayed elevated in contrast to the lull.
What will happen this time? My guess is the solar wind speed will fall in line if subdued solar activity is long enough in duration which would diminish the coronal holes over time.
The solar wind speed ALWAYS has a maximum during the declining phase of the sunspot cycle, often just before the minimum. This is quite normal and the reason is understood [fewer closed magnetic fields to inhibit the formation of coronal holes]. Right now, the solar wind speed and the magnetic field or climbing towards that maximum.
I understand that.
http://www.solen.info/solar/old_reports/2009/march/indices.html
Great representative example of high solar wind despite otherwise very low solar activity.
I don’t think you are paying attention. This happens before or at EVERY solar minimum.
See e.g. http://www.leif.org/research/Historical%20Solar%20Cycle%20Context.pdf
Whilst I agree that any ‘prediction’ about the future could only be a guess, we can nonetheless begin to assess what the future may hold in relation to the (c)AGW ‘theory’ since there are only 3 possibilities going forward, namely:
1. CO2 emissions will continue to rise on a BAU basis, and the ‘pause’ will come to an end, and temperatures will begin to rise (not necessarily in sync with rising levels of CO2, but nonetheless temps will rise).
2 CO2 emissions will continue to rise on a BAU basis, and the ‘pause’ will continue
3. CO2 emissions will continue to rise on a BAU basis, and the ‘pause’ will come to an end, and temperatures will begin to fall.
Now the sun will either remain in a ‘quiet’ phase, or it will not during the course of the next 15 or so years.
If the sun remains ‘quiet’ and scenario 3 is the scenario that factually pans out, will the role of the sun as a significant player in driving the climate be strengthened or weakened, or will the jury still be out?
I suspect that in this scenario initially the jury will remain out, but if cooling onsets for the next 10 to 15 years, I would envisage that come mid 2020s many more scientists will take up the role that the sun has as a driving force behind climate.
Because of the oceans, there are obviously large lags, so one would not expect to see significant changes on a quick basis, but if we see the sort of cooling that was seen between 1940 and mid 1970s despite the ‘high’ level of CO2 which are now in our atmosphere and which will rise at a rate of about 1.5 to 2 ppm per year, then (assuming that the sun remains ‘quiet’ this will significantly undermine the case for CO2 being a significant climate driver and will strengthen the case for natural variation, and in the absence of a better understanding of precisely what natural variation is, the case for the sun (by which I include changes in cloud cover) will be very much strengthened.
One question that is not often addressed is why is the average temperature of the oceans so low if the oceans are heated not only by the sun but also by DWLWIR? After all, they have been heated for approximately 4 billion years and there has been plenty of time for oceanic currents/ocean over turning to distribute the energy being inputted in to the top of the ocean.
It is only because the average temperature of the oceans is so low that the planet experience ice ages. If the oceans were ‘heated’ to say an average 15 to 20 degC throughout the bulk of the ocean, large fields would be unable to accumulate and whilst land glaciers may accumulate the northern oceans would not freeze and warm winds would continue to blow.
I suspect that in this scenario initially the jury will remain out, but if cooling onsets for the next 10 to 15 years, I would envisage that come mid 2020s many more scientists will take up the role that the sun has as a driving force behind climate.
There have been pauses before or even declining temperatures while solar activity was increasing [e.g. 1935-1965] and I don’t think reasonable scientists will ignore history and only base their guesses on the present.
Leif if you would read my 9 points I explained why that happens.
You explain why the solar wind right now is gaining strength? and that the magnetic field is increasing?
After all, they have been heated for approximately 4 billion years
When you heat something it radiates the heat, so the oceans have also been radiating the heat away for 4 billion years.
The solar wind and magnetic field as you said may be gaining in strength but not as much as other past more active solar cycles at this stage of the solar cycle and that is what matters.
Look at the AP index still low in contrast to post 2005 and I believe it is not going to get anywhere near that level going forward.
As for the solar wind that will fall off if the prolonged solar minimum becomes firmly entrenched over time.
You ‘believe’. There is really no evidence for such a belief. The solar wind and Ap are still increasing. At the approach to all minima, we see the Wind/Ap increase and we are nowhere near the end of the cycle.
You may be correct, let us see what happens.
Willis Eschenbach,
Facts are not in evidence wrt your claim “the effect of the [Dr. Nir Shaviv’s and his associates’] analysis on readers” is that it is “misleading”.
You say it did not mislead you. Please tell how you obtained knowledge that it has had actual real “misleading” effect on actual real “readers”. Did you survey “readers” or have some other source for your knowledge of the actual impact on actual “readers”?
There is a reasonable view by some commenters on this thread who say they thought the subject work product of Dr. Nir Shaviv & his associates was not misleading at all.
I think you are backhandedly insulting “readers” by saying they will be misled by reading the subject work product of Dr. Nir Shaviv & his associates.
Seems like your latest overall tactic of using the label “misleading” is unprofessional posturing toward the subject work product of Dr. Nir Shaviv & his associates
John
Apparently Willis was doing his best to philanthropically protect the facile readers from the “deceptive” and “misleading” conclusion that variations in absorbed solar energy has an important effect on ocean heat content changes and thus thermal expansion and sea level fluctuations.
http://www.icess.ucsb.edu/~davey/MyPapers/Siegel_etal_JGR1995_COARE.pdf
Introduction: Solar radiation is the dominant heat source for the ocean. However, the role of solar radiation penetration within the tropical ocean has only recently been assessed. The penetrating solar flux is regulated primarily by the magnitude of the incident solar flux and the concentration of optical attenuating materials in the upper ocean, which are commonly inferred using chlorophyll a phytoplankton pigment concentrations. The penetrating solar flux through the [Pacific warm water pool] mixed layer is potentially a large fraction of the incoming solar radiation, as the mixed layer is shallow and optically clear. Further, as estimates of the net air-sea heat flux for the [Pacific warm water pool] on climatological timescales are relatively small (~40 W m-2), small changes in any component of the heat flux budget control whether the near-surface layer of the [Pacifica warm water pool] heats or cools.
Discussion and Significance: The present observations illustrate two important points concerning the role of solar radiation penetration in the maintenance and perturbation of [Pacific warm water pool] thermal climate. First, the penetration of solar radiation through the [Pacific warm water pool] mixed is large and is an important component of the [Pacific warm water pool] heat budget. The cruise observations indicate that 9.8% of the incident solar radiation penetrates to a depth of 30 m (the mean mixed depth for the [Pacific warm water pool]) . This corresponds to a climatological mean in situ penetrative flux at 30 m of 22.5 W m-2 using a recent solar flux climatology calclulated using the International Satellite Cloud Climatology Project C1 data set (Table 1). This penetrating flux is more than one half the climatological mean air-sea heat flux for the [Pacific warm water pool] (~40 W m-2).
http://onlinelibrary.wiley.com/doi/10.1029/2010JC006264/full
Here we present an exceptionally well-dated marine sediment sequence in the eastern Norwegian Sea which records 1–2°C variations of temperature in northward flowing Atlantic waters that are robustly correlated with various estimates of solar activity spanning the last 1000 years. The temperature and solar proxy variations appear to be synchronous within dating errors, which, together with the large amplitude of the temperature signal and its correlation into central Europe, suggests strong coupling of the regional atmospheric and oceanic responses to the Sun. … Lowest isotope values (highest temperatures) of the last millennium are seen ∼1100–1300 A.D., during the Medieval Climate Anomaly, and again after ∼1950 A.D. The largest and most sustained isotopic increases (coolings) are centered at ∼1500 A.D. and ∼1700 A.D., corresponding to the regional Little Ice Age. … The presence of medieval and 20th century warmth and Little Ice Age cooling in our records suggests a possible connection to known solar variations at these times (i.e., the Spører and Maunder minima and medieval and modern maxima, respectively). … For the period after 1500 A.D., during which we have greatest confidence in the sediment age model, correlations with the various solar proxies range from ∣R∣ = 0.71 to 0.87 (all significant at >99%). … On balance, the observed relationship of nSST [near sea surface temperatures] and solar proxies suggests a climate response to the Sun within the characteristic inertial timescale of the upper ocean, which is one to several decades. Recurrent, episodic volcanic forcing may also influence the ocean climate signal at this timescale, however, our results indicate that approximately 50–70% of the observed multidecadal to century-scale δ18O variation may be explained by solar forcing alone.
Conclusion: We have presented an oxygen isotopic proxy record of near-surface temperature of Atlantic waters from the area of their primary flow into the eastern Norwegian Sea and find that it is robustly and near-synchronously correlated with various proxies of solar variability spanning the last millennium. The associated decade- to century-scale variation of estimated nSST ranges from 1 to 2°C, significantly larger than expected based on thermodynamic considerations alone. We suggest that this is due to a solar influence on the regional modes of atmospheric variability which, in turn, control the poleward transport and temperature of warm Atlantic surface waters. Our findings beg the question of why such a clear connection has not been detected previously.
http://www.pas.rochester.edu/~douglass/papers/PLA_Sun_II_in_press.pdf
Global ocean temperature time series from the surface to depths of 2000 m since the year 2000 are found to agree in detail with those of other diverse climate indices. It is asserted that these systems are driven by a forcing unquestionably of solar origin that has two manifestations: (1) a direct phase-locked response to what is identified as a solar forcing at a frequency of 1.0 cycle/yr for the whole time series; (2) a second phase-locked response at a period of two years or three years. With these findings it is becoming clear that the entire climate system is responding to the varying incident solar radiation
http://onlinelibrary.wiley.com/doi/10.1029/JC091iC09p10585/abstract
The heat balance of the global ocean surface layer is calculated using bulk flux formulations. Maps of the long-term monthly and annual means of the net surface energy flux together with the four components of the total flux (latent heat flux, sensible heat flux, incoming radiation, and outgoing radiation) for the global oceans are presented. Incoming solar radiation and latent heat flux are the two dominant components that control net surface energy fluxes. Wind speed, cloud cover, and the gradient of specific humidity are the three most important meteorological parameters in determining surface flux.
http://onlinelibrary.wiley.com/doi/10.1002/grl.50099/pdf
Variability in solar irradiance has been connected to changes in surface climate in the North Atlantic through both observational and climate modelling studies which suggest a response in the atmospheric circulation that resembles the North Atlantic Oscillation or its hemispheric equivalent the Arctic Oscillation. It has also been noted that this response appears to follow the changes in solar irradiance by a few years, depending on the exact indicator of solar variability. Here we propose and test a mechanism for this lag based on the known impact of atmospheric circulation on the Atlantic Ocean, the extended memory of ocean heat content anomalies, and their subsequent feedback onto the atmosphere. We use results from climate model experiments to develop a simple model for the relationship between solar variability and North Atlantic climate.
Links between solar irradiance variations and North Atlantic surface climate have been pointed out numerous times from both observations [Kodera and Kuroda, 2002;Woollings et al., 2000;Zhou and Tung, 2010;Lockwoodet al., 2010; L. J. Gray, personal communication] and climate modelling studies [Shindell et al., 2001;Mattheset al., 2006;Haigh, 2001;Ineson et al., 2011;Chiodo et al.,2012]. There is a comprehensive review in Gray et al.[2010]. These studies point to a deep, barotropic signature in atmospheric circulation that maximizes in winter and is indistinguishable from the North Atlantic Oscillation (NAO) or Arctic Oscillation, the dominant mode of interannual variability.