By Christopher Monckton of Brenchly
Joe Born (March 12) raises some questions about our paper Why models run hot: results from an irreducibly simple climate model, published in January in the Science Bulletin of the Chinese Academy of Sciences.
To get a copy of our paper, go to scibull.com and click on “Most Read Articles”. By an order of magnitude, our paper is the all-time no. 1 in the journal’s 60-year archive for downloads either of the abstract or of the full text.

Mr Born says that he is not sure he should take on trust our assertion that the Planck or instantaneous climate-sensitivity parameter is about 0.31 Kelvin per Watt per square meter; that we “obscure” the influences on the fraction of equilibrium temperature response attained in a given year; that we have used that fraction “improperly”; that we have incorrectly assumed a steep initial increase in temperature response; that we have relied on a model generated by a step-function representing the effects of a sudden pulse in CO2 concentration rather than one in which concentration increases by little and little; that it is “not clear” how we have determined that the 0.6 K committed but unrealized global warming predicted by the IPCC was not likely to occur; that our model should have taken more explicit account of the fact that different feedbacks operate over different timescales; that we were wrong to state that in an electronic circuit the output voltage transits from the positive to the negative rail at loop gains >1; and that our discussion of electronic circuitry was “unnecessary”.
Phew! I shall answer each of these points briefly.
First, however, Mr Born’s essay is predicated on a fundamental assumption that is flat wrong. He says that increasing CO2 concentration raises the optical density of the atmosphere, in turn raising the effective altitude [so far so good],
“and, lapse rate being what it is, reduces the effective temperature from which the Earth radiates into space, so less heat escapes, and the Earth warms”.
No. The characteristic-emission layer – the “altitude” from which the Earth appears to radiate spaceward, and at which, uniquely in the climate system, the fundamental equation of radiative transfer applies – is the locus of all points at or above the Earth’s surface at which incoming and outgoing radiation are equal. In general, the mean altitude of the locus of these balance-points rises as a greenhouse gas is added to the atmosphere. Thus far, Mr Born is correct.
His fundamental error lies in his assertion that the increase in the Earth’s characteristic-emission altitude reduces the effective temperature at that altitude, “so less heat escapes, and the Earth warms”.
The truth, which follows from the definition of the characteristic-emission layer and from the fundamental equation of radiative transfer that applies uniquely at that layer, is that the Earth’s effective radiating temperature is unaffected by a mere change in the mean altitude of that layer. It is not, as Mr Born says it is, “reduced” as the altitude increases.
The radiative-transfer identity, first derived empirically by the Slovene mathematician Stefan and demonstrated theoretically five years later by his Austrian pupil Ludwig Boltzmann, equates the flux density at the characteristic-emission layer with the product of three parameters: the emissivity of that layer; the Stefan-Boltzmann constant; and the fourth power of temperature.
Now, the flux density is constant, provided that total solar irradiance is constant (which, averaged over the 11-year cycle, it broadly is), and provided that the Earth’s albedo does not change much (it doesn’t). Emissivity is as near constant at unity as makes no difference; and the Stefan-Boltzmann constant is – er – constant. It necessarily follows that the temperature of the emission layer is constant unless any of the other three terms in the equation changes – and none of them changes much, if at all, merely in response to an increase in the mean altitude of the characteristic-emission layer.
Precisely because the effective radiating temperature at the characteristic-emission layer is near-constant under an increase in the mean altitude of the characteristic-emission layer, and precisely because the lapse rate of atmospheric temperature with altitude is very nearly constant under that increase, it is the surface temperature, not the effective radiating temperature at the characteristic-emission altitude, that rises in response to that increase in altitude.
Many of the subsequent errors in Mr Born’s understanding appear to flow from this one.
So to the individual points he makes.
First, the value of the Planck parameter. We stated in our paper that we had accepted the IPCC’s stated value. We might also have explained that we did not take it on trust. Indeed, the first of many fundamental errors in the climate modelers’ methodology that I identified, back in 2006, was the mismatch between the official value 0.31 K W–1 m2 and the Earth’s surface value 0.18 K W–1 m2 that was implicit in Kevin Trenberth’s 1997 paper on the Earth’s radiation budget.
As our paper explains, to a first approximation the Planck parameter is simply the first differential of the fundamental equation of radiative transfer – i.e., 0.27 K W–1 m2. However, allowance for the Hölder inequality obliges us to integrate the differentials latitude by latitude, based on variations in both radiation and temperature. That brings the value up by about one-sixth, to 0.31 K W–1 m2.
To verify that the modelers had done this calculation correctly, I asked John Christy for 30 years’-worth of satellite mid-troposphere temperature anomaly data in latitudinal steps of 2.5 degrees and spent a weekend doing the zenith angles, frustal geometry and integration myself. My value for the Planck parameter agreed with that of the IPCC to three decimal places. And, precisely because all of the parameters in the fundamental equation of radiative transfer are as near constant as makes no difference, the Planck parameter is not going to change all that much in our lifetime.
Next, Mr Born says we “obscure” the influences on the fraction equilibrium temperature response attained a given number of years after a radiative perturbation. Far from it. We begin by making an elementary point somehow not stated by Mr Born: that if there be any feedbacks (whether net-positive or net-negative) operating on the climate object, then the instantaneous and equilibrium temperature responses to a given radiative perturbation will not be identical, and there will be some pathway, over time to equilibrium, by which the temperature response will increase (with net-positive feedbacks) or decrease (with net-negative feedbacks) compared with the instantaneous response.
We continue by explaining the IPCC’s values – in its 2007 and 2013 reports – for the principal temperature feedbacks. We further explain that the response to feedbacks over time is not linear, but (assuming the IPCC’s strongly net-positive feedbacks) follows a curve in which, typically, half the approach to equilibrium occurs in the first 100 years, and the remainder occurs over the next 3000 years (see e.g. Solomon et al., 2009). We also provide a simple table of values over time that are unlikely to introduce too much error. The table was derived from a graph in Gerard Roe’s magisterial paper of 2009 on feedbacks and the climate. Far from obscuring anything, we had made everything explicit.

Mr Born goes on to say we had used the fraction of equilibrium temperature response “improperly”. However, it is trivial that in all runs of our model that concerned equilibrium sensitivity (and most of them did) that fraction is simply unity. In those runs that concerned instantaneous sensitivity (some did), that fraction is simply the ratio of the Planck to the equilibrium sensitivity parameter. In those runs that concerned transient sensitivity, we were dealing with sub-centennial timescales, so that up to half of the equilibrium response should have been evident. All of this is uncontroversial, mainstream climate science. Admittedly, it is very badly explained in the IPCC’s documents: but not the least value of our paper has been in explaining simple concepts such as this one.
Next Mr Born says we have incorrectly assumed a steep initial increase in temperature response (one can see this steep initial response quite clearly in Roe’s graph). Mr Born may or may not be right that there should not be a steep initial increase; but, like it or not, that is the assumption the IPCC and others make. We provided worked examples in the paper to show this. In short, Mr Born’s quarrel on this point is not with us but with the IPCC.
Furthermore, once we had calibrated the model using the IPCC’s assumptions and had obtained much the same sensitivities as it had published, we then adopted assumptions that seemed to us to be less inappropriate, and ran the model to reach our own estimates of climate sensitivity: around 1 K per Co2 doubling.
One of those assumptions, attested to by a growing body of papers in the literature, some dozen of which we cited, is that temperature feedbacks are probably net-negative. Here, for instance, is a graph from Lindzen & Choi (2009), showing the predictions of 11 models compared with measurements from the ERBE and CERES satellites:

Given the probability that temperature feedbacks are net-negative, we ourselves had not assumed a strong initial temperature increase: for that assumption, made by the IPCC, depends crucially on strongly net-positive feedbacks, some of which – such as water vapor – are supposed to be quick-acting. However, the ISCCP data appear to suggest no increase in column water vapor in recent decades, and even something of a decrease at the crucial mid-troposphere altitude:

Mr Born complains that in determining the fraction of equilibrium temperature response at any given year we relied on a model generated by a step-function representing the effects of a sudden pulse in CO2 concentration rather than one in which concentration increases by little and little. So we did: however, as the paper explains, we tested the model to ensure that the results it generated over, say, 100 years were much the same as those of the IPCC. It generated broadly similar results.
As it happens, I had first come across the problem of stimuli occurring not instantaneously but over a term of years when studying the epidemiology of HIV transmission. My then model, adopted by some hospitals in the national health service, overcame the problem by the use of matrix addition, but sensitivity tests showed that assuming a single stimulus all at once produced very little difference compared with the time-smeared stimulus, merely displacing the response by a few years. Similar considerations apply to the climate.
Besides, our model is just that – a model. If Mr Born does not like our values for the fraction of equilibrium temperature response attained after a given period, he is of course free to choose his own values by whatever more complex method he may prefer. But, unless he chooses values that depart a long way from mainstream climate science, the final sensitivities he determines with our simple model will not be vastly different from our own estimates.
Next, Mr Born says it is “not clear” how we have determined that the 0.6 K committed but unrealized global warming predicted by the IPCC was not likely to occur. On the contrary, it is explicitly stated. We assumed ad argumentum that all warming since 1850 was anthropogenic, ran our model and found that the variance between its predicted warming to 2014 and the observed outturn was nil, implying – as explicitly stated in the paper, that there is no committed but unrealized global warming in the pipeline. See table 4 of our paper.
Interestingly, the official answer of the “hokey team” to our point is that we should have assumed that more than all the warming since 1850 was manmade. On that point, we disagree. For They cannot at once argue that the hefty increase in solar activity between the Maunder Minimum 0f 1645-1715 and the near-Grand Maximum of 1925-1995 had no influence on global temperature, but that the decline in solar activity since its peak in 1960 is so great that it would have caused significant cooling in the absence of anthropogenic forcings over the period.

Mr Born also complains that our model should have taken more explicit account of the fact that different feedbacks operate over different timescales. Well, our transience fraction may be tuned at will to take account of that fact. And we even presented a table of values of that fraction over time to take account of a mainstream, conventional distribution of temperature feedbacks and their influences over time. If Mr Born disagrees with Dr Roe’s curve, he is of course entirely free to substitute his own. We presented not tablets of stone but a model.
Next, Mr Born devotes much ink but not much light to his assertion that we were wrong to state that in an electronic circuit the output voltage transits from the positive to the negative rail at loop gains >1. We consulted the reviewed literature; a process engineer with three doctorates, who also consulted the literature; a doctor of climatology specializing in feedback analysis as applied to the Earth’s climate; and a Professor ditto (the last two being among the top six worldwide in this highly specialist field). I also discussed the question of the response-versus-loop-gain curve with a group of IPCC lead authors at a talk I gave at the University of Tasmania three years ago.
Not one of these eminent advisers agrees with Mr Born. That, on its own, does not mean he is wrong: but it does mean that the point we raise is at least respectable.
The Bode feedback-amplification equation is entirely clear: at loop gains >1 the equation mandates that the temperature response becomes negative. In an electronic circuit one can of course – as Mr Born does at rather tedious length – find ways of making the circuit oscillate even in the absence of loop gains >1, and one can find ways of making it not oscillate even at loop gains >1.
However, the equation actually used in the climate models (including ours) is, like it or not, the Bode system-gain equation. Mr Born carefully plots only that part of the graph of the equation below a loop gain of 1:

However, our paper plots the graph both sides of a loop gain of unity. A loop gain of 1 is equivalent to the feedback sum of 3.2 Watts per square meter per Kelvin in Mr Born’s graph, for in the climate the loop gain is the product of the feedback sum and the Planck parameter, and the Planck parameter is the reciprocal of 3.2.

On reading Mr Born’s piece one would think the point we had raised was both trivial and inappropriate. However, the specialists whom we consulted, and the equation itself, suggest that our point is both non-trivial and substantial.
Indeed, the Professor, until I debated the issue with him before a learned society somewhere in Europe a couple of years back, was a true-believer in the profitably catastrophist viewpoint. When I displayed the full plot of the Bode equation he went white.
He wrote to me afterwards, sending me a paper in which he had himself urged caution in the use of Bode in climate modeling. A few weeks ago he got in touch again to say he has thought about the matter ever since and has now concluded – damn you, Monckton – that I am right, and that in consequence climate sensitivity cannot be more than 1 K and may be less.
He has submitted a paper for peer review. If that paper is published, and if it proves correct, the science will indeed be settled – but in a direction entirely uncongenial to the profiteers of doom.
One of the IPCC lead authors in Tasmania interrupted my talk when I showed the full Bode graph and said: “Have you published this?” No, I replied. “But you must,” he said. “This changes everything!” Yes, I said, I rather think it does.
If the Bode equation is inappropriate for loop gains >1, then it may also be inappropriate for loop gains <1. It may – at least in its unmodified form – be the wrong equation altogether. And without it one cannot get away with claiming the absurdly high and unphysical sensitivities the IPCC profits by asking us to believe in.
At minimum, tough asymptotic bounds to constrain the behavior of the equation at the singularity should be imposed. That, at any rate, is what the very small variability of global temperature over the past 810,000 years would suggest: and, on that point, Mr Born surely agrees with us.

The hokey team have responded to this point by saying that the paleoclimate record (showing temperature varying by only 3.5 K either side of the long-run mean over the past 810,000 years) demonstrates high net-positive feedback in response to very small forcings over the period.
Accordingly, I consulted an eminent geologist who said the positive and negative forcings over so long a timescale were very substantial. So I consulted another geologist. He said the same.
Mr Born’s final point is that our discussion of electronic circuitry was “unnecessary”. Not so. The models use an equation taken from electronic circuitry, where it represents a real event, the phase-transition of the voltage from the positive to the negative rail at a loop gain of unity, and misapply it to the climate, which is an object in a class to which that equation does not apply, especially at the very high loop gains implicit in the IPCC’s estimates of climate sensitivity.
There are two principal reasons why the Bode equation – unless it is modified in some fashion analogous to Mr Born’s modification of a circuit to prevent its output from behaving as it would otherwise do – does not apply to the climate.
First, as temperature feedbacks and hence loop gain increase, there comes no moment at which the effect of the feedbacks is to reverse the output and push temperatures down, though that is what the Bode equation in the form in which it is applied to the climate models mandates.
Secondly, in an electronic circuit the output [voltage] is a bare output: it does not act to equilibrate the circuit following the perturbation amplified by the feedback. In the climate, however, an increase in surface temperature is precisely the mechanism by which the object self-equilibrates, and the Bode equation simply does not model this situation.
For these reasons, we considered it important to raise an early red flag about the applicability of the Bode equation. We are not the first to have done so, but as far as we know our brief treatment of the problem is more explicit than anything that has been published before in the reviewed literature.
I have a further paper on the Bode question in the works that has passed review by an eminent expert in the field (I don’t know who, but the journal is in awe of him). The paper will be published in the next few months.

At no point did that reviewer (or any reviewer) question the validity of the point we raised. On the contrary, he said that the paper was a good definition of a real problem. The paper describes the problem in some detail and raises questions designed to lead to a solution.
Readers who have struggled through to this point may now like to read our paper in Science Bulletin for themselves. There is, perhaps, not a lot wrong with it after all.
It seems to me that errors in thinking are evident in many of the posts that are made in this thread. One error is to think that all mathematical relations from the variable X to the variable Y are functional relations. Another is to think that this functional relation is linear. If and only if the relation is functional and linear, the ratio of Y to X is a constant. This kind of thinking leads amateur and professional climatologists alike to the conclusion that there is necessarily the constant that is called the “climate sensitivity” when this conjecture is untestable from the nonobservability of Y, the “equilibrium surface air temperature.”
Climate Change зависит от солнечной активности “has solar activity influence on the Earth’s global warming?” http://eurecalert.org/e/5rst via,от альбедо Earth а альбедо зависит от формы планеты.Однобокий рост внутреннего ядра http://go.nature.com/w6iks3 деформируя кору изнутри http://shar.es/lnJxx0 изменяет форму Earth.”Een acute aanvalvan ontlastingsdrang die “ERNSTIG EN NAKEND” is”. http://www.davidhanauer.com/buckscounty/rindingrocks,http://www.bbc.com/news/science-environment-31322817.Monumental Earth Changes приводит к изменению гравитации планеты http://news.discovery.com/earth/global-wrming/earths-gravity-dips-from-antarcticice-loss-141001.htm изменяет наклон Earth от которого тоже зависит альбедо “Earth Mattres:Earth’s tilt bringsbigshanges during seasons of the year -altoonaMirror.com-Altoon,PA/News,Sports,jobsComunity information-the Altoona Mirror http://shar.es/1fFoSQ and орбиту Earth от которой также зависит альбедо http://wp.me/p7y41-vDW.Эти и другие изменения подтверждающие ссылки на которые я пока не нашёл продолжаются поэтому происходит колебание солнечной радиации и зависящее от уровня солнечной радиации в атмосфере Earth давление в верхних слоях атмосферы.От давления в атмосфере зависит преобладание ветров а значит и погоды в различных регионах Earth http://www.newsweek.com/speking-green-tongues-scientist-discovers-new-plant-language-264734
Okay, a wrap-up. , one of the “parameters” of their model.
 values that are implausible. Among the reasons I find them implausible is the one I gave upthread: negative-feedback step responses sometimes exceed positive-feedback ones. I therefore asked that the authors explain how they obtained the Table 2 values from the Gerard Roe paper, whose Fig. 6 was ostensibly the source.
 in Monckton et al.’s Table 4 to arrive at temperature-increase value implies there’s warming yet to be realized from the CO2-concentration increase we’ve already experienced: the already-experienced 0.8 K divided by an
  value of 0.6 yields 1.3 K ultimately expected, or 1.3 K – 0.8 K = 0.5 K yet to be realized. But their §6 seems to draw just the opposite inference: “[T]he model fairly reproduces the change in global temperature since then, suggesting that the 0.6 K committed but unrealized warming mentioned in AR4, AR5 is non-existent.” In explanation, Lord Monckton variously just referred us to Table 4 or served up this credulity-challenging assertion: “The definition of “committed but unrealized warming” that the IPCC has in mind is not the warming to equilibrium that has not yet occurred as a result of our past sins of emission, but the warming that it considers ought to have occurred to date.” Be that as it may, I do think I can conclude that I interpreted their use of
  correctly, which was my real concern; some confusingly described IPCC assertion and the inference Monckton et al. drew with regard to it probably aren’t too important.
 values for
  and the corresponding equilibrium climate-sensitivity parameters
 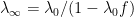 for respective feedback-coefficient values
  . Let’s say we find that the observed temperature matches the resultant fourth-row value: the feedback coefficient thereby inferred is 2.1 watts per square meter per Kelvin, which implies an equilibrium climate sensitivity of 3.4 K.
 watts per square meter per Kelvin—which corresponds to an equilibrium climate sensitivity of 12 K, not 3.4 K—than from the fourth-row feedback coefficient
  watts per square meter per Kelvin. If we had a denser table, we could conclude that the feedback coefficient
  is actually around 2.6 watts per square meter per Kelvin, from which we would infer an equilibrium climate sensitivity of 6.2 K rather than the 3.4 K that the Monckton et al. approach would suggest.
Lord Monckton has given an intelligible answer to only one of the three main issues I raised in the post to which the head post here was supposedly a response. My post was principally directed to Monckton et al.’s “transience fraction”
Monckton et al.’s Table 2 gives
That graph provided only one curve—or, arguably, three—yet Monckton et al.’s Table has five rows. It should have been a simple matter to explain how the authors thus multiplied curves. Instead, Lord Monckton merely said, “If Mr Born disagrees with Dr Roe’s curve, he is of course entirely free to substitute his own.” Why the evasion?
The use of
Lord Monckton actually did give a straight answer (in the midst of inapposite ones) in response to my observation that in applying their model Monckton et al. computed the response to forcing that increased over time as though it had appeared all at once at the beginning of the interval. His answer was, yes, they do treat the stimulus as having arrived all at once, but the resultant difference in temperature-change output is not large.
But whether you consider it large depends on how you’re using it. Let’s say that over the past 75 years CO2 concentration has doubled, we have observed the (arguably) resultant change in global-average temperature, and we want to infer the equilibrium climate sensitivity from that transient climate response. As Monckton et al. teach, we multiply the resultant forcing by the product of the transience fraction
But that’s the inference drawn from assuming that the entire forcing increase occurred 75 years ago rather than steadily over the last 75 years. If we make the latter, more correct assumption instead, we conclude that the observed temperature increase is closer to what we would expect from the table’s last-row feedback coefficient
In other words, although there may be cases in which the two approaches yield similar results, it takes quite a bit of care to avoid misleading results from the Monckton et al approach.
Further wrap-up.
As to the circuit issue, I’m not going to revisit the substance. I don’t think that will be resolved until Lord Monckton goes back to his consultants and goes over facts such as those I raised in my post and the comments upthread. There may be some hope, because I may have detected a little walking back already. (“It is of course obvious that the Bode graph as it stands does not really represent even an electronic circuit. There are obvious asymptotic bounds preventing an infinite positive (or, above unity, negative) voltage from being output by the circuit.”) Or maybe not.
I am cognizant of Lord Monckton’s observation that “Mr Born has so far been silent on how they actually use the equation: it is in their manner of using it that climate sensitivity ends up being prodigiously exaggerated.” I will continue to be silent about that, because I don’t know how IPCC modelers use “the Bode equation,” whatever Lord Monckton means by that. It would not surprise me at all that such modelers apply mathematics badly, but Lord Monckton has offered only conclusory statements to that effect. I’ve observed only that the arguments Lord Monckton has made about the differences between climate and circuits lack merit. True, circuits differ from climate. But saying things like “transit to the negative rail” doesn’t inspire confidence in Lord Monckton’s having identified ways in which modelers have failed to recognize relevant distinctions.
Nor will I accept Lord Monckton’s invitation to go look up oscillators. No, I’m not an expert, but I was dealing with oscillators during the Johnson administration, so neither am I a complete tyro. I assume Lord Monckton will eventually revisit with his experts the specifics we’ve raised here and that he will then quietly drop the circuits topic or re-spin it. Anyway, I think I’ve done my part on that topic. I’ll just continue with others to cringe in vicarious embarrassment until he finally grabs the line so many of us have thrown him.
As to two other issues, on which Lord Monckton has expended a lot of argument and seems to be confusing semantics with substance, I’ll give it one more go. Here’s the first one. . A century ago it was
  because the atmosphere's optical density then was lower then than it is now. As Lord Monckton says, the effective radiating altitude always has the same temperature
  . So the temperature at
  was
was  a century ago, and the temperature now at
  is
is  , but a century ago the temperature at
  was lower: it was
 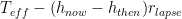 . In other words, the temperature at what is now the effective radiating altitude has increased, although the temperature at whatever is the effective radiating altitude is always
  . (Please read that last sentence again.)
 , lower than its current value
  : the surface temperature has risen by the same amount as the temperature at
  (or, for that matter, at
  ).
). . This is true even if the system is at equilibrium, i.e., even if just as much radiation is being emitted as is being received.
 to
to  . But the surface temperature wouldn’t, not instantaneously. And neither would the temperature at
  , even though it has just become the effective radiating altitude. That is, although we say that the effective radiating altitude’s temperature is always
  , we have assumed, for the sake of defining “forcing,” a situation in which thermal inertia would force it initially to depart from
  .
. . It is that hypothetical radiation imbalance that we take as today's value of forcing: it’s the radiative imbalance that would have occurred if the optical density had just instantaneously changed from the reference value to today’s value.
 will equal
  . If instead we considered the forcing to be zero whenever the radiation flow is in balance, then our model would dictate
  when there's no imbalance, and that’s not what we want.
 , the subject of my post?
Monckton of Brenchley: “The error was his assumption that a change in the altitude of the characteristic-emission surface consequent upon a radiative forcing would cause the temperature of that surface to change. No.”
My comment about effective radiating altitude was definitional, not factual, and, although I think I was right, nothing depended on that.
Let’s think this through. I’ll go slowly.
The effective radiating altitude now, today, is
If in our model world we ignore or set to zero the various feedbacks (including lapse-rate feedback), the surface temperature a century ago was
Okay, still with me? If not, go back and read again. I’ll wait.
Ready? Okay.
Now, the purpose of the original post's emission-altitude discussion was to define what we mean by “forcing.'' According to our model, the surface temperature is a response to “forcings.” If we ignore the transience fraction, the forcing value we use for now in our model must be greater than the forcing value we use for then if, as we just said it did, the surface temperature now exceeds the surface temperature then. If the forcing then was zero, in fact, the forcing now, according to the model without feedback, must be
So how do we characterize that forcing? Well, suppose that optical density increased in an instant by the amount that we’ve been assuming it increased over a whole century. At that instant, the effective radiating altitude would increase instantaneously from
In that situation there would be a radiative imbalance equal (in our linearized world) to
The point of that discussion was not to assert that the effective radiation altitude is changing much in temperature; it was to adopt a definition of “forcing” that can afford us a non-zero forcing value even though there's no radiative imbalance. We have to define forcing in that way so that the zero-feedback value of
That was my point in raising the radiation altitude. But suppose I’m somehow wrong about how forcing arises. Everything in my post dealt only with how the model treats the forcing we have, not with how we got it. So what does any misapprehension of mine about how forcing arises have to do the transience fraction
Monckton of Brenchley: “The misinterpretation—commonplace, but wrong—is in his assumption that the Planck parameter is a feedback just like all the others. No. In fact, it plays a special role in the determination of climate sensitivity, is not summed with the true feedbacks but is, uniquely, instead multiplied by their sum.” . Once we add feedback there’s also a feedback block whose operation is multiplication by
  and whose output is added to the forward block’s no-feedback input to become the composite input of the forward, multiply-by-
 block.
 block’s internals. Internal to that block for the toy, one-box arrangement I used as illustration is an integrator with
  feedback. So long as those internals’ time constant—i.e.,
  in my diagram—is small with respect to the time resolution of interest, that block is essentially the multiply-by-
 block that Lord Monckton sees; I’ve just looked inside it.
 . I needn’t have employed that expedient, but it had the added virtue of showing that temperature does not respond instantaneously to radiative forcing. At the time resolution Lord Monckton was dealing with, though, that response may appear instantaneous, so there’s nothing (or nothing simple enough to describe here) wrong with Lord Monckton’s treating it as occurring instantaneously.
This is just a different way of looking at the same thing.
Lord Monckton envisions the following block diagram. Before feedback he sees a forward block whose operation is multiplication by the “Planck climate-sensitivity parameter”
At least for present purposes, I have no quarrel with that.
But I descend an abstraction level and look at the multiply-by-
I included the internals for purposes of exposition. I put them there to show how positive feedback could slow
What’s wrong is to imagine that anything substantive in this context turns on whether we treat the “Planck” coefficient as feedback or gain. (And, no, I don’t object to using the latter term when no power is applied.) All that matters is the behavior that flows from whatever treatment we choose.
Finally: I’m afraid I’ve found this exchange disappointing. value and thereby tease out the portion that exposes the effect of feedback on equilibrium response. A significant number of this blog’s regular readers, including me, have made simple models, the essences of which are their step responses. Monckton et al. drew inferences by using their own, Table 2 series of step responses for selected levels of feedback.
Monckton et al.’s innovation was to divide the step response by its
Those responses did not seem consistent with each other, so many of us were interested in precisely how Monckton et al. inferred the Table 2 values from the Gerard Roe paper. The explanation should have been easy to give. Yet the authors, or at least Lord Monckton, insisted on withholding that information.
The paper raises other, subtler issues, but I doubt that we will ever reach them if we can’t get information about the basics.