Guest essay by Leo Smith – elevated from a comment left on WUWT on January 6, 2015 at 2:11 am (h/t to dbs)

As an engineer, my first experience of a computer model taught me nearly all I needed to know about models.
I was tasked with designing a high voltage video amplifier to drive a military heads up display featuring a CRT.
Some people suggested I make use of the acoustic coupler to input my design and optimise it with one of the circuit modelling programs they had devised. The results were encouraging, so I built it. The circuit itself was a dismal failure.
Investigation revealed the reason instantly: the model parametrised parasitic capacitance into a simple single value: the reality of semiconductors is that the capacitance varies with applied voltage – an effect made use of in every radio today as the ‘varicap diode’. for small signals this is an acceptable compromise. Over large voltage swings the effect is massively non linear. The model was simply inadequate.
Most of engineering is to design things so that small unpredictable effects are swamped by large predictable ones. Any stable design has to work like that. If it doesn’t, it ain’t stable. Or reproducible.
That leads to a direct piece of engineering wisdom: If a system is not dominated by a few major feedback factors, it ain’t stable. And if it has a regions of stability then perturbing it outside those regions will result in gross instability, and the system will be short lived.
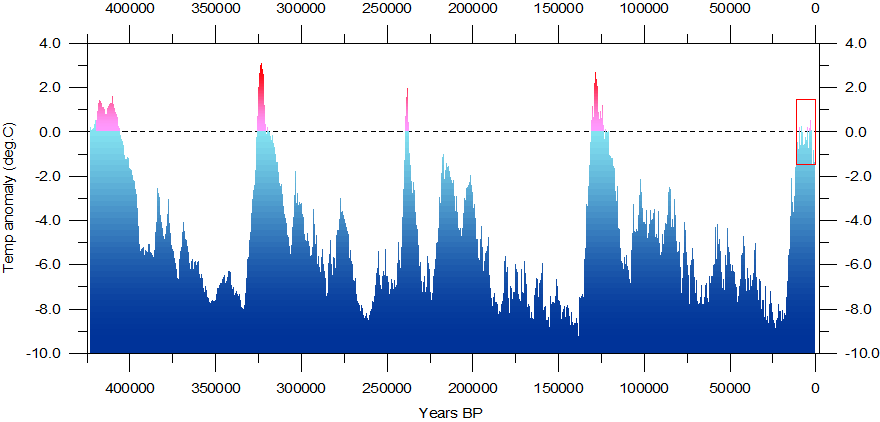
Climate has been in real terms amazingly stable. For millions of years. It has maintained an average of about 282 degrees absolute +- about 5 degrees since forever.
So called ‘Climate science’ relies on net positive feedback to create alarmist views – and that positive feedback is nothing to do with CO2 allegedly: on the contrary it is a temperature change amplifier pure and simple.
If such a feedback existed, any driver of temperature, from a minor change in the suns output, to a volcanic eruption must inevitably trigger massive temperature changes. But it simply never has. Or we wouldn’t be here to spout such nonsense.
With all simple known factors taken care of the basic IPCC style equation boils down to:
∆T = λ.k.log( ∆CO2)
where lambda (λ) is the climate sensitivity that expresses the presupposed propensity of any warming directly attributable to CO2 (k.log(CO2)) radiative forcing and its resultant direct temperature change to be amplified by some unexplained and unknown feedback factor, which is adjusted to match such late 20th century warming as was reasonably certain.
Everyone argues over the value of lambda. No one is arguing over the actual shape of the equation itself.
And that is the sleight of hand of the IPCC…arguments about climate sensitivity are pure misdirection away from the actuality of what is going on.
Consider an alternative:
∆T = k.log( ∆CO2) + f(∆x)
In terms of matching late 20th century warming, this is equally as good, and relies merely on introducing another unknown to replace the unknown lambda, this time not as a multiplier of CO2 driven change, but as a completely independent variable.
Philosophically both have one unknown. There is little to choose between them.
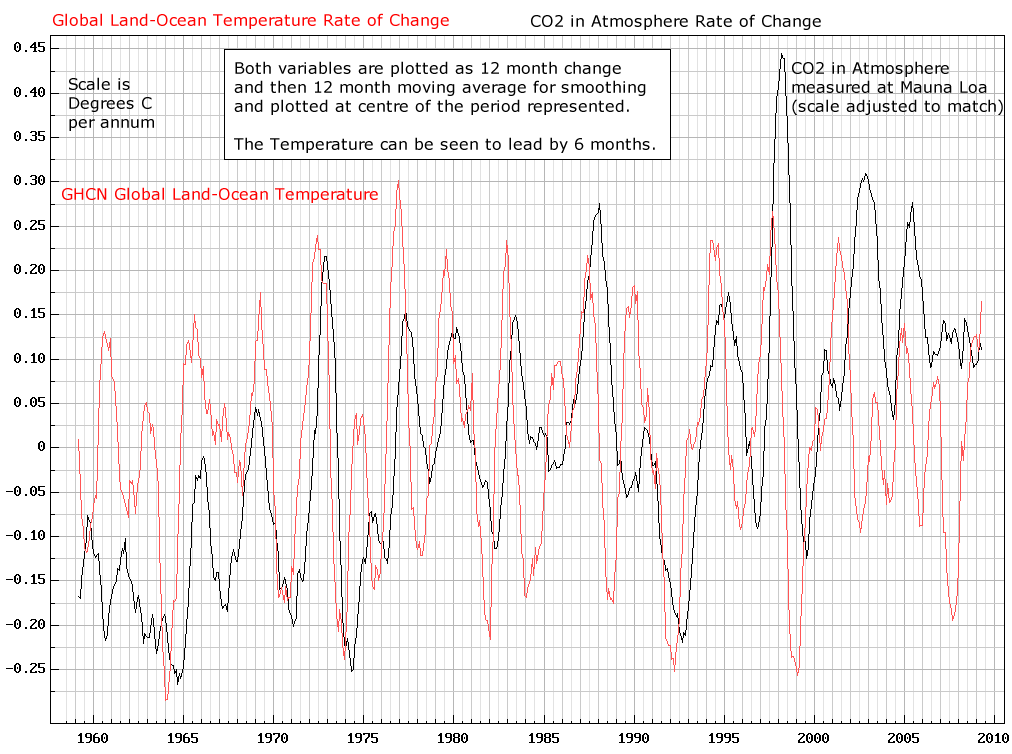
Scientifically both the rise and the pause together fit the second model far better.
Worse, consider some possible mechanisms for what X might be….
∆T = k.log( ∆CO2) + f(∆T).
Let’s say that f(∆T) is in fact a function whose current value depends on non linear and time delayed values of past temperature. So it does indeed represent temperature feedback to create new temperatures!
This is quite close to the IPCC model, but with one important proviso. The overall long term feedback MUST be negative, otherwise temperatures would be massively unstable over geological timescales.
BUT we know that short term fluctuatons of quite significant values – ice ages and warm periods – are also in evidence.
Can long term negative feedback create shorter term instability? Hell yes! If you have enough terms and some time delay, it’s a piece of piss.
The climate has all the elements needed. temperature, and water. Water vapour (greenhouse gas: acts to increase temperatures) clouds (reduce daytime temps, increase night time temps) and ice (massive albedo modifiers: act to reduce temperatures) are functions of sea and air temperature, and sea and air temperature are a function via albedo and greenhouse modifiers, of water vapour concentrations. Better yet, latent heat of ice/water represents massive amounts of energy needed to effect a phase transition at a single temperature. Lots of lovely non-linearity there. Plus huge delays of decadal or multidecadal length in terms of ocean current circulations and melting/freezing of ice sheets and permafrost.
Not to mention continental drift, which adds further water cycle variables into the mix.
Or glaciation that causes falling sea levels, thus exposing more land to lower the albedo where the earth is NOT frozen, and glaciation that strips water vapour out of the air reducing cloud albedo in non glaciated areas.
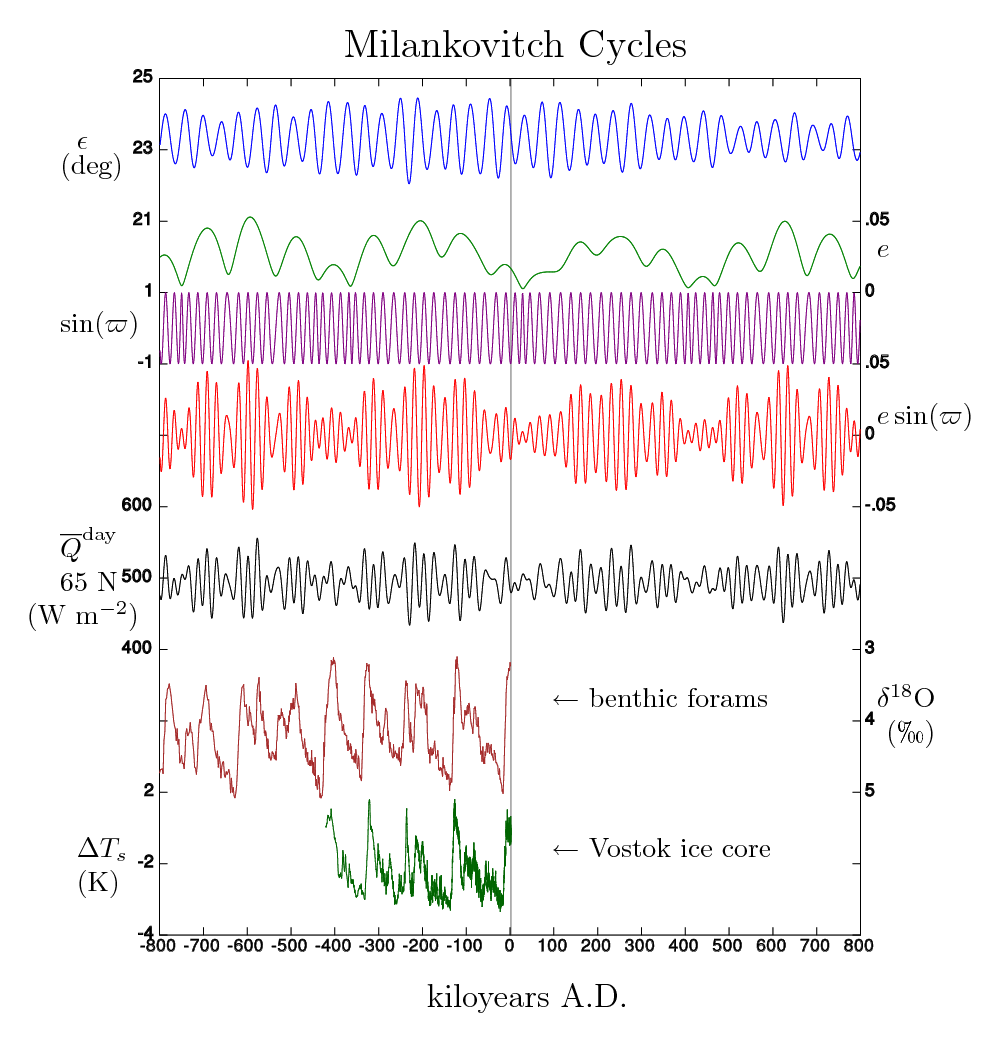
It’s a massive non linear hugely time delayed negative feedback system. And that’s just water and ice. Before we toss in volcanic action, meteor strikes, continental drift. solar variability, and Milankovitch cycles…
The miracle of AGW is that all this has been simply tossed aside, or considered some kind of constant, or a multiplier of the only driver in town, CO2.
When all you know is linear systems analysis everything looks like a linear system perturbed by an external driver.
When the only driver you have come up with is CO2, everything looks like CO2.
Engineers who have done control system theory are not so arrogant. And can recognise in the irregular sawtooth of ice age temperature record a system that looks remarkably like a nasty multiple (negative) feed back time delayed relaxation oscillator.
Oscillators don’t need external inputs to change, they do that entirely within the feedback that comprises them. Just one electron of thermal noise will start them off.
What examination of the temperature record shows is that glaciation is slow. It takes many many thousands of years as the ice increases before the lowest temperatures are reached, but that positive going temperatures are much faster – we are only 10,000 years out of the last one.
The point finally is this: To an engineer, climate science as the IPCC have it is simplistic nonsense. There are far far better models available, to explain climate change based on the complexity of water interactions with temperature. Unfortunately they are far too complex even for the biggest of computers to be much use in simulating climate. And have no political value anyway, since they will essentially say ‘Climate changes irrespective of human activity, over 100 thousand year major cycles, and within that its simply unpredictable noise due to many factors none of which we have any control over’
UPDATE: An additional and clarifying comment has been posted by Leo Smith on January 6, 2015 at 6:32 pm
 but more like

Look, this post was elevated (without me being aware…) from a blog comment typed in in a hurry. I accept the formula isn’t quite what I meant, but you get the general idea OK?
If I had known it was going to become a post I’d have taken a lot more care over it.
Not used k where it might confuse,. Spotted that delta log is not the same as log delta..
But the main points stand:
(i) The IPCC ‘formula’ fits the data less well than other equally simple formulae with just as many unknowns.
(ii) The IPCC formula is a linear differential equation.
(iii) There is no reason to doubt that large parts of the radiative/convective thermal cycle/balance of climate are non linear.
(iv) There are good historical reasons to suppose that the overall feedback of the climate system is negative, not positive as the IPCC assumes.
(v) given the number of feedback paths and the lags associated with them, there is more than enough scope in the climate for self generated chaotic quasi-periodic fluctuations to be generated even without any external inputs beyond a steady sun.
(vi) Given the likely shape of the overall real climate equation, there is no hope of anything like a realistic forecast ever being obtained with the current generation of computer systems and mathematical techniques. Chaos style equations are amongst the hardest and most intractable problems we have, and indeed there may well be no final answer to climate change beyond a butterfly flapping its wings in Brazil and tipping the climate into a new ice age, or a warm period, depending 😉
(vii) A point I didn’t make: a chaotic system is never ‘in balance’, and even its average value has little meaning, because its simply a mathematical oddity – a single point on a range where the system never rests – it merely represents a point between the upper and lower bounds; Worse, is system with multiple attractors, it may not even be anywhere near where the systems orbits fr any length of time.
In short my current thinking says :
– there is no such thing as a normal climate, nor does it have a balance that man has disturbed , or could disturb. Its constantly changing and may go anywhere from ice age to seriously warm over extremely long periods of time. It does this all by itself. There need be no external drivers to move it from one attractor to another or cause it to orbit any given attractor. That climate changes is unarguable, that anything beyond climate itself is causing it, is deeply doubtful. That CO2 has a major effect is, on the data, as absurd as claiming that CO2 has no effect at all.
What we are looking at here is very clever misdirection cooked up for economic and political motives: It suited many peoples books to paint CO2 emissions as a scary pollutant, and a chance temporary correlation of rising temperatures and CO2 was combined in a linear way that any third rate scientist could understand to present a plausible formula for scary AGW. I have pointed out that other interpretations of the data make a non scary scenario, and indeed, post the Pause,. actually fit the data better.
Occam’s razor has nothing to say in defence of either.
Poppers falsifiability is no help because the one model – the IPCC – has been falsified. The other can make no predictions beyond ‘change happens all by itself in ways we cannot hope to predict’. So that cannot be falsified. If you want to test Newton’s laws the last experiment you would use is throwing an egg at a spike to predict where the bits of eggshell are going to land….
Net result is climate science isn’t worth spending a plugged nickel on, and we should spend the money on being reasonably ready for moderate climate change in either direction. Some years ago my business partner – ten years my junior wanted to get key man insurance in case I died or fell under a bus. ‘How much for how much’ ‘well you are a smoker, and old, so its a lot’ It was enough in fact to wipe out the annual profits, and the business, twice over. Curiously he is now dead from prostate cancer, and I have survived testicular cancer, and with luck, a blocked coronary artery. Sometimes you just take te risk because insuring against it costs more … if we had been really serious about climate change we would be 100% nuclear by now. It was proven safe technology and dollar for dollar has ten times the carbon reduction impact than renewables. But of course carbon reduction was not the actual game plan. Political control of energy was. Its so much easier and cheaper to bribe governments than compete in a free market…
.
IF – and this is something that should be demonstrable – the dominant feedback terms in the real climate equations are non linear, and multiple and subject to time delay, THEN we have a complex chaotic system that will be in constant more or less unpredictable flux.
And we are pissing in the wind trying to model it with simple linear differential equations and parametrised nonsense.
The whole sleight of hand of the AGW movement has been to convince scientists who do NOT understand non linear control theory, that they didn’t NEED to understand it to model climate, and that any fluctuations MUST be ’caused’ by an externality, and to pick on the most politically and commercially convenient one – CO2 – that resonated with a vastly anti-science and non-commercial sentiment left over from the Cold War ideological battles . AGW is AgitProp, not science. AGW flatters all the worst people into thinking they are more important than they are. To a man every ground roots green movement has taken a government coin, as have the universities, and they are all dancing to the piper who is paid by the unholy aggregation of commercial interest, political power broking and political marketing.
They bought them all. They couldn’t however buy the climate. Mother Nature is not a whore.
Whether AGW is a deliberate fraud, an honest mistake, or mere sloppy ignorant science is moot. At any given level it is one or the other or any combination.
What it really is, is an emotional narrative, geared to flatter the stupid and pander to their bigotry, in order to make them allies in a process that if they knew its intentions, they would utterly oppose,.
Enormous damage to the environment is justified by environmentalists because the Greater Cause says that windmills and solar panels will Save the Planet. Even when its possible to demonstrate that they have almost no effect on emissions at all, and it is deeply doubtful if those emissions are in any way significant anyway.
Green is utterly anti-nuclear. Yet which- even on their own claims – is less harmful, a few hundred tonnes of long lived radionuclides encased in glass and dumped a mile underground, or a billion tonnes of CO2?
Apparently the radiation which hasn’t injured or killed a single person at Fukushima, is far far more dangerous than the CO2, because Germany would rather burn stinking lignite having utterly polluted its rivers in strip mining it, than allow a nuclear power plant to operate inside its borders .
Years ago Roy Harper sang
“You can lead a horse to water, but you cannot make him drink
You can lead a man to slaughter, but you’ll never make him think”
I had a discussion with a gloomy friend today. We agreed the world is a mess because people don’t think, they follow leaders, trends, emotional narratives, received wisdom.. Never once do they step back and ask, ‘what really is going on here?’. Another acquaintance doing management training in the financial arena chalked up on the whiteboard “Anyone who presages a statement with the words ‘I think’ and then proceeds to regurgitate someone else’s opinions, analysis or received wisdom, will fail this course and be summarily ejected’
And finally Anthony, I am not sure I wanted that post to become an article. I dont want to be someone else’s received wisdom. I want the buggers to start thinking for themselves.
If that means studying control theory systems analysis and chaos mathematics then do it. And form your own opinions.
“Don’t follow leaders, watch your parking meters”
I say people don’t think. Prove me wrong. Don’t believe what I say, do your own analysis. Stop trusting and start thinking.
I’ll leave you with a final chilling thought. Consider the following statement:
“100% of all media ‘news’ and 90% of what is called ‘science’ and an alarming amount of blog material is not what is the case, or even what people think is the case, but what people for reasons of their own, want you to think is the case”
Finally, if I ever get around to finishing it, for those who ask ‘how can it be possible that so many people are caught up in what you claim to be a grand conspiracy or something of that nature?’ I am on the business of writing a philosophical, psychological and social explanation. It entitled ‘convenient lies’ And it shows that bigotry prejudice stupidity and venality are in fact useful techniques for species survival most of the time.
Of course the interesting facet is the ‘Black Swan’ times, when it’s the most dangerous thing in the world.
Following the herd is safer than straying off alone. Unless the herd is approaching the cliff edge and the leaders are more concerned with who is following them than where they are going…
AGW is one of the great dangers facing mankind, not because its true, but because it is widely believed, and demonstrably false.
My analysis of convenient lies shows that they are most dangerous in times of deep social and economic change in society, when the old orthodoxies are simply no good.
I feel more scared these days than at any time in the cold war. Then one felt that no one would be stupid enough to start world war three. Today, I no longer have that conviction. Two generations of social engineering aimed at removing all risk and all need to actually think from society has led to a generation which is stupid enough and smug enough and feels safe enough to utterly destroy western civilisation simply because they take it totally for granted. To them the promotion of the AGW meme is a success story in terms of political and commercial marketing. The fact that where they are taking us over a cliff edge into a new dark age, is something they simply haven’t considered at all.
They have socially engineered risk and dissent out of society. For profit. Leaving behind a population that cannot think for itself, and has no need to. Its told to blindly follow the rules.
Control system theory says that that, unlike the climate, is a deeply unstable situation.
Wake up, smell the coffee. AGW is simply another element in a tendency towards political control of everything, and the subjugation of the individual into the mass of society at large. No decision is to be taken by the individual, all is to be taken by centralised bureaucratic structures – such as the IPCC. The question is, is that a functional and effective way to structure society?
My contention is that its deeply dangerous. It introduces massive and laggy overall centralised feedback, Worse, it introduces a single point of failure. If central government breaks down or falters, people simply do not know what to do any more. No one has the skill or practice in making localised decisions anymore.
The point is to see AGW and the whole greenspin machine as just an aspect of a particular stage in political and societal evolution, and understand it in those terms. Prior to the age of the telegraph and instantaneous communications, government had to be devolved – the lag was too great to pass the decisions back to central authority. Today we think we can, but there is another lag – bureaucratic lag. As well as bureaucratic incompetence.
System theory applied to political systems, gives a really scary prediction. We are on the point of almost total collapse, and we do not have the localised systems in place to replace centralised structures that are utterly dysfunctional. Sooner or later an externality is going to come along that will overwhelm the ability of centralized bureaucracy to deal with it, and it will fail. And nothing else will succeed, because people can no longer think for themselves.
Because they were lazy and let other people do the thinking for them. And paid them huge sums to do it, and accepted the results unquestioningly.
Happy new year