Guest Post by Bob Tisdale
UPDATE: Corrected the percentage of ocean heat loss though evaporation. Update 2: Added a link to a post by Willis Eschenbach at the end, and corrected a typo.
# # #
Ocean heat content and vertically averaged temperature data for the oceans have been the subjects of a couple of recent blog posts. As one might expect, the discussions on those threads tend to shift to the subject of whether or not the infrared (longwave) radiation from manmade greenhouse gases can cause any measureable ocean warming at the surface or at depth. According to the hypothesis of human-induced global warming, the warming of the global oceans to depth and the related ocean heat uptake are a function of the radiative imbalance caused by manmade greenhouse gases. There are a number of arguments for and against the hypothetical anthropogenic warming of the oceans.
So the topic of this post is ocean warming. I’ll present different opinions/arguments on anthropogenic ocean warming.
For a detailed overview of ocean heat content data, please see the post Is Ocean Heat Content Data All It’s Stacked Up to Be? And see the post AMAZING: The IPCC May Have Provided Realistic Presentations of Ocean Heat Content Source Data for another discussion by the IPCC.
INFRARED RADIATION CAN ONLY PENETRATE THE TOP FEW MILLIMETERS OF THE OCEAN SURFACE AND THAT’S WHERE EVAPORATION TAKES PLACE
It is often argued that infrared radiation from manmade greenhouse gases can only penetrate the top few millimeters of the ocean surface and that’s where evaporation occurs. That argument then continues that additional infrared radiation from anthropogenic greenhouse gases can only add to surface evaporation, and cannot heat the oceans. On the other hand, sunlight reaches into the oceans to depths of 100 meters or so, though most of it is absorbed in the top 10 meters. Even so, sunlight’s ability to warm the oceans is many orders of magnitude greater than infrared radiation. One of my earliest memories of this argument came from Robert E. Stevenson’s (Oceanographer Scripps) 2000 article Yes, the Ocean Has Warmed; No, It’s Not ‘Global Warming’. In April of this year, looking for solid answers on this topic, Roy Spencer presented the same arguments and a few counter arguments in his post, Can Infrared Radiation Warm a Water Body?
Field tests reported in the 2006 post Why greenhouse gases warm the oceans at RealClimate are often cited by those who believe infrared radiation is responsible for ocean warming. That guest post by Peter Minnett of the University of Miami includes:
However, some have insisted that there is a paradox here – how can a forcing driven by longwave absorption and emission impact the ocean below since the infrared radiation does not penetrate more than a few micrometers into the ocean?
So this argument was considered by climate scientists. The post then goes on to describe why it’s not an inconsistency and then to present the results of field tests. My Figure 1 is Figure 2 from that RealClimate post.

Figure 1 – The change in the skin temperature to bulk temperature difference as a function of the net longwave [infrared] radiation.
The summary text for the illustration at RealClimate reads:
There is an associated reduction in the difference between the 5 cm and the skin temperatures. The slope of the relationship is 0.002ºK (W/m2)-1. Of course the range of net infrared forcing caused by changing cloud conditions (~100W/m2) is much greater than that caused by increasing levels of greenhouse gases (e.g. doubling pre-industrial CO2 levels will increase the net forcing by ~4W/m2), but the objective of this exercise was to demonstrate a relationship.
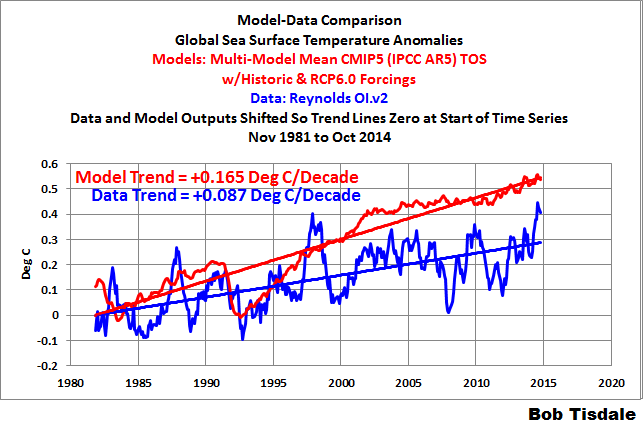
That, however, creates a counter argument that has been discussed by others. See the HockeySchtick post RealClimate admits doubling CO2 could only heat the oceans 0.002ºC at most. Let me put this into more recent terms. According to the NOAA Annual Greenhouse Gas Index, infrared radiation has only increased about 1.2 watts/meter^2 from 1979 to 2013. Based on the findings at RealClimate, that rise in infrared radiation could only warm the sea surfaces by a little more than 0.002 deg C since 1979. Yet, looking at the global sea surface temperature data, Figure 2, the surfaces of the global oceans warmed more than 0.3 deg C from 1979 to 2013, leaving about 93% 99.3% of the ocean surface warming unexplained.

Figure 2
A continuation of the Minnett-field-test argument is that manmade greenhouse gases and ocean mixing will cause the warming of the mixed layer of the oceans. The HockeySchtick counter could be applicable here as well. The mixed layer ranges in depth from about 20 to 200 meters. Unfortunately, temperature data specifically for the mixed layer are not available in an easy-to-use format, so let’s assume that the NODC’s vertically averaged temperature data for the depths of 0-100 meters captures the vast majority of the mixed layer. As shown in Figure 2, the warming rate of the top 100 meters of the ocean is slightly less than the surface. In other words, the warming rate based on the field tests presented by RealClimate can’t explain the vast majority of the warming of the top 100 meters.
Further to the RealClimate post by Peter Minnett, see the very recent ClimateConversation post HotWhopper wrong on ocean heat. It includes links to a three part discussion titled “Anthropogenic Ocean Warming?” by Richard Cummings, which covers the Minnett findings and other proposed mechanisms of anthropogenic warming of the oceans:
- Part 1: Skeptical Science Offside
- Part 2: The Improbable IPCC Mechanism
- Part 3: Rahmstorf, Schmittner and Nuccitelli
“AIR-SEA FLUXES ARE THE PRIMARY MECHANISM BY WHICH THE OCEANS ARE EXPECTED TO RESPOND TO EXTERNALLY FORCED ANTHROPOGENIC AND NATURAL VOLCANIC INFLUENCES”
The quote in the heading is from Chapter 10 (WG1) of the IPCC’s 5th Assessment Report.
Richard Cummings comments from Part 2 of his series begins:
That’s it. 25 years and five assessment reports after its 1988 formation, the IPCC has not been able to firm up an anthropogenic ocean heating and thermal sea level rise mechanism. The one they have come up with is only “expected”, indicating that they are unable to cite studies of the real-world phenomenon of non-solar air => sea energy fluxes actually occurring on a scale that would explain 20th century ocean heat accumulation in the order of 18×10^22 J and subjugate a solar-only mechanism.
“…HEAT PENETRATES THE OCEANS FASTER IN A WARMER CLIMATE”
The heading is a quote from the concluding remarks by Stefan Rahmstorf in the RealClimate post Sea-level rise: Where we stand at the start of 2013 (my boldface).
My bottom line: The rate of sea-level rise was very low in the centuries preceding the 20th, very likely well below 1 mm/yr in the longer run. In the 20th Century the rate increased, but not linearly due to the non-linear time evolution of global temperature. The diagnosis is complicated by spurious variability due to undersampling, but in all 20th C time series that attempt to properly area-average, the most recent rates of rise are the highest on record. At the end of the 20th and beginning of the 21st Century the rate had reached 3 mm/year, a rather reliable rate measured by satellites. This increase in the rate of sea-level rise is a logical consequence of global warming, since ice melts faster and heat penetrates faster into the oceans in a warmer climate.
Is this a very simplified rewording of the argument that, although the atmosphere is cooler than the ocean surfaces, greenhouse gases will reduce the rate at which oceans can release heat to the atmosphere?
See Richard Cummings response in Part 3 of his series.
MECHANISMS FOR THE WARMING OF THE OCEANS
Donald Rapp presented a simple model to explain how manmade greenhouse gases could warm the oceans in his guest post at Judith Curry’s blog ClimateEtc, back in May 2014. See his post Mechanisms for the Warming of the Oceans. That post drew more than 400 comments. If you’re going to cut and paste one of your or someone else’s comments from that thread, please leave a hyperlink to it.
INFRARED RADIATION FROM MANMADE GREENHOUSE GASES HAS INCREASED SINCE 1979, WHILE TOTAL SOLAR IRRADIANCE HAS DECREASED. THEREFORE, INFRARED RADIATION CAUSED THE OCEAN WARMING.
This is one of the favorite arguments for anthropogenic warming of the oceans: Infrared radiation has increased since 1979 but total solar irradiance at the top of the atmosphere has decreased. Therefore, according to that ill-conceived argument, the sun can’t explain the warming.
Why is it ill-conceived? We’re interested in the amount of sunlight reaching the ocean surfaces and entering into them, not the amount of sunlight reaching the top of the atmosphere.
There is evidence the amount of sunlight reaching Earth’s surface increased from 1979 to 2013. It comes from a specialized climate model called a reanalysis, and the reanalysis being discussed is the NCEP-DOE R-2. Unlike the climate models used to hindcast and predict global warming, a reanalysis uses data (sea surface temperature data, cloud cover data, aerosol data, total solar irradiance data, and the like) as inputs and calculates variables that aren’t measured directly. It’s a climate model, so we still have to look at it with a skeptical eye, but even so, the sunlight reaching the surface of the Earth increased from 1979 to 2013, according to the NCEP-DOE R-2 reanalysis. See Figure 3.

Figure 3
I’ve added a note to the graph:
Above what value do the oceans accumulate heat?
That was to counter another ill-conceived argument. Someone might look at the graph and see that sunlight at the surface peaked around the year 2002 and has since dropped, expecting the oceans to lose heat during the decline. But that argument would fail to consider many things, including the one noted.
This also brings to mind something written by Carl-Gustaf Rossby in 1959. It is part of the opening chapter of the book The Atmosphere and Sea in Motion edited by Bert Bolin. That chapter is titled “Current problems in meteorology”. In it, Rossby made two suggestions while discussing ocean processes (my boldface):
a) The assumption that our planet as a whole stands in firm radiation balance with outer space cannot be accepted without reservations, even if periods of several decades are taken into account.
b) Anomalies in heat probably can be stored and temporarily isolated in the sea and after periods of the order of a few decades to a few centuries again influence the heat and water-vapour exchange with the atmosphere.
So, assuming the NCEP-DOE R2 reanalysis is correct, how long would the recent increase in the amount of sunlight entering the oceans impact climate? According to Rossby, it could be decades or centuries.
Something else to consider: according to the NODC’s vertically averaged temperature data to depths of 2000 meters, the North Atlantic and the Pacific Ocean show little to no warming since 2005. The other two ocean basins, the South Atlantic and Indian Oceans are showing warming, but they only cover about 1/3 of the ocean surface. See Figure 4.

Figure 4
That lack of warming to depths of 2000 meters for two ocean basins that cover 2/3 of the ocean surface (North Atlantic and Pacific) is hard to reconcile in a world where greenhouse gases are said to be well mixed, meaning they’re pretty well evenly distributed around the globe.
THE OCEANS HAVE THEIR OWN GREENHOUSE-LIKE EFFECT
In his post, The Deep Blue Sea, John L. Daly presented something that must be considered in every discussion of ocean warming: the oceans have their own greenhouse like effect (I’ve added a hyperlink to John Daly’s Figure 1):
A greenhouse effect, by definition, means that the medium through which radiation passes is more transparent at visible wavelengths, but more opaque at infra-red wavelengths, thus letting in visible energy but obstructing the escape of sufficient infra-red energy to maintain thermal equilibrium without a rise in temperature.
The oceans also behave this way.
Reference to fig. 1 shows that the oceans let in visible solar radiation right down to 100 metres depth. However, the oceans cannot radiate from such depths, as infra-red radiation can only take place from the top few millimetres of ocean. Thus, the oceans are also behaving in a greenhouse-like manner, taking in heat and then trapping some of it to cause a temperature rise.
Phrased differently, sunlight can warm the oceans to depths of 100 meters, but the oceans can only release heat at the surface. Now consider that the oceans release heat primarily through evaporation (if memory serves, somewhere in the neighborhood of 90% of the heat loss from the oceans is through evaporation). UPDATE: Sorry, in this instance my memory was off. Of the approximately 180+ watts/m^2 downward shortwave radiation reaching the ocean surface, about half (about 100 watts/m^2) is released through evaporation.
THERE ARE NATURALLY OCCURRING PROCESSES THAT CAN CAUSE THE LONG-TERM WARMING OF THE OCEANS TO DEPTH
The naturally occurring processes that can warm the oceans, of course, are not considered in the climate models used by the IPCC. Climate modelers’ force the warming of the oceans based on their assumptions of how the infrared radiation from manmade greenhouse gases warm the oceans.
We’re going to break the oceans down into ocean-basin subsets, because, for two of the subsets, climate scientists addressed those portions of the oceans in the studies linked to this post.
I’ve presented these discussions in previous posts using ocean heat content data. For a change of pace, I’m presenting the NODC depth-averaged temperature data for the depths of 0-700 meters.
THE WARMING OF THE NORTH ATLANTIC TO DEPTH
As a preface to our first discussion, Figure 5 presents the depth-averaged temperature anomalies (0-700 meters) for the North Atlantic and for the rest of the global oceans. To determine the depth-averaged temperature anomalies for the rest of the global oceans, I area-weighted the North Atlantic data (11.5%, see the NOAA webpage here) and subtracted it from the global data. The units are deg C.

Figure 5
It very obvious that the North Atlantic to depths of 700 meters warmed at a much faster rate than the rest of the oceans, about 3.3 times faster from 1955 to present. That ocean basin only covers 11.5% of the surface of the global oceans, yet it represents about 35% of the ocean warming to depths of 700 meters.
NOTE: It is unfortunate that the outputs of the climate model simulations of depth averaged temperature (or ocean heat content) are not available in an easy-to-use form so that the models can be compared to observations. We know climate models do not properly simulate the warming of ocean surfaces. They double the warming rate of the ocean surfaces over the past 33 years. See the model-data comparison graph here. Also see the posts here and here for additional discussions. It would be interesting to see how poorly the models simulate ocean warming to depth. [End note.]
Now consider what I wrote in that introductory portion from my upcoming book: It’s very obvious why the change in the ocean heat content is very important to the hypothesis of human-induced global warming. If the oceans could be shown to have warmed naturally, then the impacts of manmade greenhouse gases are much smaller than claimed by climate scientists.
And that’s exactly what a group of scientists did back in 2008. They determined the warming of the North Atlantic to 700 meters since 1955 was caused by naturally occurring processes, not by manmade greenhouse gases. We’ve discussed this paper a few times in recent years—in blog posts and in books. Here’s a portion of my ebook Who Turned on the Heat?
[START OF REPRINT FROM WHO TURNED ON THE HEAT?]
There is a study that provides an explanation for that additional warming. See Lozier et al (2008) The Spatial Pattern and Mechanisms of Heat-Content Change in the North Atlantic.
First, a quick introduction to one of the terms used in the following quotes: The North Atlantic Oscillation is an atmospheric climate phenomenon in the North Atlantic. Like the Southern Oscillation Index described in Chapter 4.3 ENSO Indices, the North Atlantic Oscillation is expressed as the sea level pressure difference between two points. The sea level pressures in Iceland, at the weather stations in Stykkisholmur or Reykjavik, can be used to calculate North Atlantic Oscillation Indices. Which Iceland location they elect to use as the high-latitude sea level pressure reference depends on the dataset supplier. The other point captures the sea level pressure at the mid-latitudes of the North Atlantic, and there are a number of locations that have been used for it: Lisbon, Portugal; Ponta Delgada, Azores; and Gibraltar. The North Atlantic Oscillation Index is primarily used for weather prediction. The direction and strength of the westerly winds in the North Atlantic are impacted by the sea level pressures in Iceland and the mid-latitudes of the North Atlantic, which, in turn, impact weather patterns in Europe and the East Coast of North America. If you live in those locations, you’ll often hear your weather person referring to the North Atlantic Oscillation. As will be discussed, winds in the North Atlantic can also impact Ocean Heat Content.
I’ll present two quotes from the Lozier et al (2008) paper. I’ll follow them with quotes from the press release that describes in layman terms how the North Atlantic Oscillation impacts the Ocean Heat Content of the North Atlantic. Back to Lozier et al (2008):
The abstract reads:
The total heat gained by the North Atlantic Ocean over the past 50 years is equivalent to a basinwide increase in the flux of heat across the ocean surface of 0.4 ± 0.05 watts per square meter. We show, however, that this basin has not warmed uniformly: Although the tropics and subtropics have warmed, the subpolar ocean has cooled. These regional differences require local surface heat flux changes (±4 watts per square meter) much larger than the basinwide average. Model investigations show that these regional differences can be explained by large-scale, decadal variability in wind and buoyancy forcing as measured by the North Atlantic Oscillation index. Whether the overall heat gain is due to anthropogenic warming is difficult to confirm because strong natural variability in this ocean basin is potentially masking such input at the present time.
In the paper, Lozier et al (2008) note, using NAO for North Atlantic Oscillation:
A comparison of the zonally integrated heat-content changes as a function of latitude (Fig. 4B) confirms that the NAO difference can largely account for the observed gyre specific heat-content changes over the past 50 years, although there are some notable differences in the latitudinal band from 35° to 45°N. Thus, we suggest that the large-scale, decadal changes in wind and buoyancy forcing associated with the NAO is primarily responsible for the ocean heat-content changes in the North Atlantic over the past 50 years.
Based on the wording of the two quotes, the paper appears to indicate that Lozier et al (2008) are describing the entire warming of ocean heat content in the North Atlantic. In other words, it seems that Lozier et al (2008) are not stating that the North Atlantic Oscillation is primarily responsible for the additional ocean heat-content changes in the North Atlantic, above and beyond the rest of the world, over the past 50 years; they’re saying it’s primarily responsible for all of the variability. The press release for the paper, on the other hand, leads you to believe the North Atlantic Oscillation is responsible for the North Atlantic warming above and beyond the global warming.
The Duke University press release for the paper is titled North Atlantic Warming Tied to Natural Variability. Though the other ocean basins weren’t studied by Lozier et al, the subtitle of the press release includes the obligatory reference to an assumed manmade warming in other basins: “But global warming may be at play elsewhere in the world’s oceans, scientists surmise”. To contradict that, we’ve found no evidence of an anthropogenic component in the warming of the other ocean basins.
The press release reads with respect to the North Atlantic Oscillation (NAO):
Winds that power the NAO are driven by atmospheric pressure differences between areas around Iceland and the Azores. “The winds have a tremendous impact on the underlying ocean,” said Susan Lozier, a professor of physical oceanography at Duke’s Nicholas School of the Environment and Earth Sciences who is the study’s first author.
Further to this, they write:
Her group’s analysis showed that water in the sub-polar ocean—roughly between 45 degrees North latitude and the Arctic Circle—became cooler as the water directly exchanged heat with the air above it.
By contrast, NAO-driven winds served to “pile up” sun-warmed waters in parts of the subtropical and tropical North Atlantic south of 45 degrees, Lozier said. That retained and distributed heat at the surface while pushing underlying cooler water further down.
The group’s computer model predicted warmer sea surfaces in the tropics and subtropics and colder readings within the sub-polar zone whenever the NAO is in an elevated state of activity. Such a high NAO has been the case during the years 1980 to 2000, the scientists reported.
“We suggest that the large-scale, decadal changes…associated with the NAO are primarily responsible for the ocean heat content changes in the North Atlantic over the past 50 years,” the authors concluded.
[END OF REPRINT FROM WHO TURNED ON THE HEAT?]
WHAT CAUSES THE WATER TO “PILE UP”, INCREASING OCEAN HEAT CONTENT?
Let’s discuss in more detail that “pile up” from the press release of Lozier et al. (2008). First, a few basics: The trade winds are a function of the temperature difference between the equator and higher latitudes. The warmer water near the equator causes warm air to rise there (convection). At the surface, winds blow from the mid latitudes toward the equator to make up for the deficit caused by the rising air, but the rotation of the Earth deflects that inrushing air to the west. Thus the trade winds blow from the northeast to the southwest in the Northern Hemisphere and from the southeast to the northwest in the Southern Hemisphere.
In the ocean basins, ocean circulation is driven primarily from the trade winds in the tropics blowing from east to west. That is, the trade winds push the surface waters from east to west in the tropics. Those westward-traveling waters warm under the tropical sun. They encounter a continental land mass and are directed toward the poles. In the North Atlantic, the poleward-flowing western boundary current is known as the Gulf Stream. It carries the warm tropical waters to the cooler high latitudes, where that water can release heat to the atmosphere more efficiently. At the mid-latitudes, those waters encounter the west to east winds known as westerlies and are blown eastward toward Europe and Africa. The eastern boundary current along Africa returns those cooler waters back toward the tropics, where they can be warmed again, completing the cycle. That ocean circulation loop is called a gyre.
Now for the “piling up”: Suppose the westerlies in the mid-latitudes slowed or reversed, while, at the same time, the trade winds were pushing the same amount of tropical water to the west and poleward. At mid-latitudes, the change in the strength or direction of the westerlies would resist the poleward transport of warm water from the tropics. That warm water would accumulate as a result. Here’s that quote from the press release again:
By contrast, NAO-driven winds served to “pile up” sun-warmed waters in parts of the subtropical and tropical North Atlantic south of 45 degrees, Lozier said. That retained and distributed heat at the surface while pushing underlying cooler water further down.
Presto. A naturally caused accumulation of heat in the North Atlantic.
Curiously, under the heading of “Beam Me Up, Scotty”, Stefan Rahmstorf of RealClimate presented a similar discussion in his post What ocean heating reveals about global warming. I, of course, commented on that in my post Comments on Stefan Rahmstorf’s Post at RealClimate “What ocean heating reveals about global warming”
Now suppose, at the same time, there were a series of strong El Niño events over a multidecadal period (1976 to the turn of the century for example), so that the tropical waters in the North Atlantic were naturally warmer than normal. Trenberth and Fasullo (2011) explain why some portions of the oceans remote to the tropical Pacific warm in response to an El Niño (my boldface):
But a major challenge is to be able to track the energy associated with such variations more thoroughly: Where did the heat for the 2009–2010 El Niño actually come from? Where did the heat suddenly disappear to during the La Niña? Past experience (Trenberth et al. 2002) suggests that global surface temperature rises at the end of and lagging El Niño, as heat comes out of the Pacific Ocean mainly in the form of moisture that is evaporated and which subsequently rains out, releasing the latent energy. Meanwhile, maximum warming of the Indian and Atlantic Oceans occurs about 5 months after the El Niño owing to sunny skies and lighter winds (less evaporative cooling), while the convective action is in the Pacific.
That additional sunlight during a period when El Niños dominated (1976 to the turn of the century) would add to the amount of accumulating warm water in the North Atlantic…and elsewhere.
And Trenberth now understands that the heat didn’t suddenly “disappear to during the La Niña”. It shows up as the “big jumps” in surface temperature in response to strong El Niño events. See the posts:
- Open Letter to the Royal Meteorological Society Regarding Dr. Trenberth’s Article “Has Global Warming Stalled?”
- The 2014/15 El Niño – Part 9 – Kevin Trenberth is Looking Forward to Another “Big Jump”
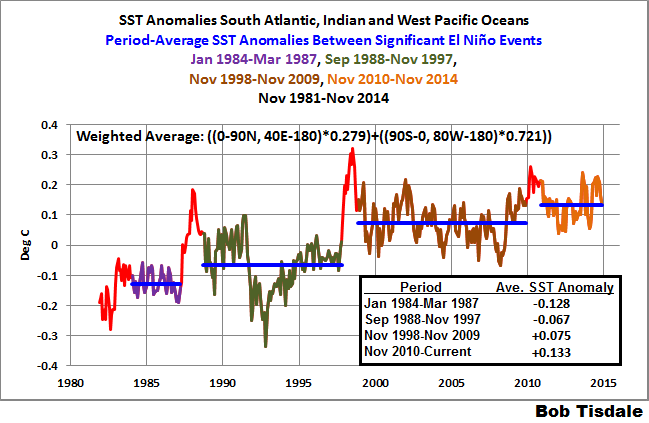
I also present those “big jumps” in the monthly sea surface temperature updates (November 2014 update is here). They stand out quite plainly in the sea surface temperature data for the South Atlantic, Indian and West Pacific Oceans. For a further discussion see the illustrated essay “The Manmade Global Warming Challenge” (42mb).
EXTRATROPICAL NORTH PACIFIC
The next paper to be discussed is Trenberth and Hurrell (1994): Decadal Atmosphere-Ocean Variations in the Pacific. In it, Trenberth and Hurrell were using an index derived from the sea level pressures of the extratropical North Pacific (30N-65N, 160E-140W), called the North Pacific Index, to explain shifts in the sea surface temperatures of the North Pacific. Again, a sea level pressure index reflects changes in the wind patterns. My Figure 6 is Figure 6 from Trenberth and Hurrell (1994).

Figure 6
That same shift appears in the depth-averaged temperature data for the extratropical North Pacific (24N-65N, 120E-80W) for the depths of 0-700 meters. But the shifts are delayed a year in the subsurface temperature data. See Figure 7.

Figure 7
I’ve color-coded 4 periods on the graph. The first period from 1955 to 1988 (dark blue) includes the downward shift in 1978. As a result of that shift in 1978 (that should be related to the shift in the sea level pressures and wind patterns), the depth-averaged temperature data shows a cooling trend from 1955 to 1988. That is, the extratropical North Pacific to depths of 700 meters cooled (not warmed) for more than 3 decades. The second period (red) captures the upward shift in 1988 and 1989 that, once again, should be related to the shift in the sea level pressures and wind patterns. From 1991 to 2002 (light blue), the extratropical North Pacific cooled once again to depths of 700 meters. And since the ARGO floats were deployed (black), the extratropical Pacific shows a slight warming to depth.
It’s blatantly obvious the extratropical North Pacific to depths of 700 meters would show no warming from 1955 to present if it wasn’t for that upward shift in 1988 and 1989. It’s also obvious that the downward shift in 1978 that extends to 1988 also impacts the long-term trend. That is, without the naturally caused downward shift in the late-1970s the long-term warming rate would be less. Obviously, natural variability, not manmade greenhouse gases, dominates the variability and long-term warming of the extratropical Pacific to the depths of 700 meters.
TROPICAL PACIFIC
We isolate the vertically averaged temperature data to depths of 700 meters for the tropical Pacific because the tropical Pacific is where El Niño and La Niña events take place, and El Niño and La Niña events, collectively, are the dominant forms of natural variability on Earth. A further clarification: while El Niño and La Niña events are focused on the equatorial Pacific, they directly impact the entire tropical Pacific. See the animation here for an extreme example of the effects of an El Niño on the sea level residuals of the tropical Pacific.
Let’s start with two quotes from (again) Kevin Trenberth. According to Trenberth, El Niño events are fueled by sunlight, not manmade greenhouse gases. In the much-cited Trenberth et al. (2002) The evolution of ENSO and global atmospheric surface temperatures, they stated (my boldface and brackets):
The negative feedback between SST and surface fluxes can be interpreted as showing the importance of the discharge of heat during El Niño events and of the recharge of heat during La Niña events. Relatively clear skies in the central and eastern tropical Pacific [during a La Niña] allow solar radiation to enter the ocean, apparently offsetting the below normal SSTs, but the heat is carried away by Ekman drift, ocean currents, and adjustments through ocean Rossby and Kelvin waves, and the heat is stored in the western Pacific tropics. This is not simply a rearrangement of the ocean heat, but also a restoration of heat in the ocean. Similarly, during El Niño the loss of heat into the atmosphere, especially through evaporation, is a discharge of the heat content, and both contribute to the life cycle of ENSO.
NOTE: That’s the source of my standard description of ENSO as a chaotic, naturally occurring, sunlight-fueled, recharge-discharge oscillator…with El Niños acting as the discharge phase and La Niñas acting as the recharge phase. But La Niñas also help to redistribute the leftover warm waters from the El Niños. [End note.]
Also see Trenberth and Fasullo (2011). They confirm that ENSO is sunlight-fueled during La Niña events:
Typically prior to an El Niño, in La Niña conditions, the cold sea waters in the central and eastern tropical Pacific create high atmospheric pressure and clear skies, with plentiful sunshine heating the ocean waters. The ocean currents redistribute the ocean heat which builds up in the tropical western Pacific Warm Pool until an El Niño provides relief (Trenberth et al. 2002).
Figure 8 presents the vertically averaged temperature anomalies (0-700 meters) for the tropical Pacific. El Niño and La Niña events directly impact the top 300 meters, so this depth captures their direct impacts. I’ve highlighted in maroon the three 3-year La Niña events of 1954 to 1957, 1973 to 1976, and 1998 to 2001. After those 3-year La Niña events, the tropical Pacific shows cooling, not warming. That indicates that the shorter La Niñas that follow El Niños only recharge part of the warm water released from the tropical Pacific by the El Niños. Also, I’ve highlighted in red the 7-month period associated with the 1995/96 La Niña. (See the old version of the NOAA ONI index.) The 1995/96 La Niña created the warm water that fueled the 1997/98 El Niño, which is responsible for the sharp drop in temperature following the heat uptake of the 1995/96 La Niña. The “overcharge” from the 1995/96 La Niña and the recharge during the 1998-01 La Niña obviously caused an upward shift in the subsurface temperatures of the tropical Pacific.

Figure 8
What is also blatantly obvious is the warming of the tropical Pacific to depth is dependent on 4 La Niña events. And according to Trenberth et al. (2002) and Trenberth and Fasullo (2011), sunlight warms the tropical Pacific during La Niñas, not infrared radiation from manmade greenhouse gases. (In the real world, downwelling longwave radiation decreases during La Niña events.)
BOTTOM LINE ON OCEAN TEMPERATURE DATA FOR THE DEPTHS OF 0-700 METERS
Subsurface temperature data (and ocean heat content data) for the North Atlantic, the Extratropical North Pacific and the Tropical Pacific all indicate that naturally occurring coupled ocean-atmosphere processes are the primary causes of ocean warming to depth, not manmade greenhouse gases. In fact, the data for the tropical Pacific and extratropical North Pacific show those oceans can cool for decadal and multidecadal periods between short-term naturally caused warming episodes. Those decadal and multidecadal cooling periods further suggest that manmade greenhouse gases have no measureable impact on ocean warming to depth.
NOTE: Someone is bound to note that I’ve only presented subsurface ocean temperature data for the top 700 meters and only for the oceans of the Northern Hemisphere and the tropical Pacific. If I receive a comment to that effect on the thread, I will refer that blogger to the 2 posts linked in the introduction. Here they are again:
- Is Ocean Heat Content Data All It’s Stacked Up to Be?
- AMAZING: The IPCC May Have Provided Realistic Presentations of Ocean Heat Content Source Data
CLOSING
I’m sure I’ve missed a few arguments for and against the anthropogenic ocean warming. If you introduce others, please provide links where possible.
UPDATE 2: While preparing this post, I overlooked an excellent post by Willis Eschenbach Radiating The Ocean.
I gotta admit, I don’t understand this concern about the skin layer. A certain amount of the incident infrared energy is mixed downwards because the skin layer is not stable. This is because it is constantly cooling, which makes it denser than the underlying layers. A certain amount is mixed downwards by both waves and wind.


However, the majority of the downwelling infrared is simply re-radiated. Here’s a graphic showing the process:
The solar radiation plus some amount of the IR ends up in the mixed layer. From there, the energy returns to the surface where it is lost through the three processes (radiation, latent and sensible heat loss). It is important to notice that the amount of energy entering the mixed layer is equal to the amount leaving it.
Note that this downwelling IR keeps the entire mixed layer warmer than it would be without the IR. Suppose we could shut off the IR for an hour (or alternately that the DWIR is not absorbed by the ocean for an hour). Since the radiation and the latent and sensible heat loss would continue, the energy that is no longer supplied by the DWIR would be extracted from the mixed layer, which would leave it cooler than it is with the DWIR. Here is that situation:
Now, here’s the problem. The mixed layer is getting 186 W/m2 … but it’s losing 530 W/m2. Which is why I keep asking, if the DWIR is not absorbed by the ocean, why isn’t the ocean frozen?
As Phil points out above, this same process is true for dew … or for Crater Lake. Obviously in dew or in Crater Lake the amount of DWIR mixed downwards would be smaller than in the open ocean. But in both cases, the incoming IR is immediately lost in the form of radiation, evaporation, and conduction.
And in both cases, this DWIR leaves the underlying water warmer, despite the fact that the IR is absorbed in the skin layer.
w.
Agreed Willis, we must have been typing at the same time, I would have drawn basically the same flow diag as you. One aspect we both left out was the contribution of salinity to the convection term, important in the arctic.
–Now, here’s the problem. The mixed layer is getting 186 W/m2 … but it’s losing 530 W/m2. Which is why I keep asking, if the DWIR is not absorbed by the ocean, why isn’t the ocean frozen?–
So why isn’t the tropical ocean not frozen?
In this same regard, what is the difference between a cloud and a ocean.
Or what is the difference between the question, “why isn’t the ocean frozen?”
and the question “why isn’t the clouds frozen?”
One could answer by saying that there is a lot frozen water in clouds.
But cloud are at higher elevation and per 1000 meter elevation
it’s at least 5 C colder than the sea level surface, so first need the clouds
to freeze before lower elevation water freezes.
Or if at say 5 pm the sky is covered with clouds and it’s more than 5 C [45 F]
I would predict that it isn’t going to snow at nite. And/or bodies of water are not
going to freeze during the night. Whereas if instead it’s clear skies, I tend to think
it will freeze during the night. Of course it’s different if already freezing temperature
at 5 pm. Though if it’s windy and/or I know cold front sweeping down from northeast
then ir’s going to snow. Or if raining and around 40 F, the rain will become snow
during the night. One begins to get partial snow at about 38 F. Or at 40 F raining
at sea level, it’s starting to snow at 1000 ft elevation. Or in LA if 40 F and raining, in Big
Bear or Snow Summit it’s snowing or you will have snow if you go up the Grapevine
on I-5. So when raining in LA and it’s 40 F in clouds less than 1000 meters higher
the air is at freezing. And these cloud have been frozen- or must be a significant portion
of the cloud with ice.
So before ocean could have any chance of freeze any cloud 1000 feet higher above it must already be at least partially frozen. And though it does rain in LA when temperature are around 40 F [4 C] and ski mountains and grapevine gets snow. It very rare to have snow- even on the Hollywood Hills. And it would need to get even colder to freeze the Silverlake reservoir.
So rather than ocean freezing the first question could why aren’t the clouds frozen?
Or first clouds must freeze, if clouds aren’t frozen there is no way ocean can freeze-
unless there are no clouds in tropics.
Or if wondering about freezing at surface, first look freezing at cloud.
And:
“At an altitude of roughly 5-6 kilometers, the concentration of greenhouse gases in the overlying atmosphere is so small that heat can radiate freely to space.”
http://earthobservatory.nasa.gov/Features/EnergyBalance/page6.php
And clouds can be higher than 5-6 kilometers.
So say have region which is 1000 km by 1000 km square [on flat and uniform ocean area] and in this region one has various elevations of clouds which include a cloud 5 km high and clouds at 4 km, 3, 2, and 1 km elevation.
In order to get freezing temperature in this region, first the 5 km high cloud must freeze, then followed with 4, 3, 2, 1 km level clouds.
Then one can wonder about the zero elevation water freezing.
And what about clouds stop them from freezing. Why don’t clouds at same elevation as water
freeze long before water freezes. They have a vast amount surface area. It seems if you were to design water so freezes the quickest, you would make a cloud.
Well, Willis, such pretty pictures you have. They are wrong but Ill never convince you of that, Ugly fellow that I am.
My method is to study the physics of the sea surface. Nature instructs us.
In other words, you have no scientific arguments so you wave your hands.
Cute.
w.
Turn the crank on your DWIR zapper as fast as you may, you cannot overturn the physics of the IR absorbancy of water (water being opaque to IR).
Willis,
I must say, your energy budget diagrams are pretty freaky-looking. I mean, you appear to have no clue about how real-world objects warm and attain their temperature. If you do have a clue, you certainly don’t seem to put that knowledge to use. You seem to promote the idea that it’s all about fluxes. It’s not. Rather, it’s all about the total amount of stored energy, internal energy [U], up to the point of dynamic equilibrium (heat OUT [Q_out] finally balancing heat IN [Q_in]) and system ‘heat capacity’. The energy fluxes to and from an object in a steady state (dynamic equilibrium) are just there to balance Q_in with Q_out, to maintain the temperature already achieved. They are just the dynamic throughput. If they balance across a cycle, they don’t add to or subtract from the internal energy of the object (system) across that same cycle. And hence don’t affect mean temps in the least.
Only for a thermally isolated ‘pure emitter’ (an object/a surface in a purely radiative setting, all heat gain and heat loss through radiation only, radiating into surroundings at 0 K or at least very much colder than itself) will the final (steady-state) temperature correspond to the magnitude of the instantaneous radiative input flux [Q_in] and thus to the final magnitude of the instantaneous radiative output flux [Q_out]. In all other settings, this relationship is broken. With a massive atmosphere in place, all bets are off.
I’ll reiterate my money analogy from upthread:
“If I get 100$ from my bank and then hand them all to my friend, upon which he hands 90 of them straight back, then I end up with 90 dollars.
The rGHE “back radiation” argument then goes as follows: I get 190$ IN, but give away 100$, so end up with 90$. The 190 dollars IN are counted like this: 100$ from the bank + 90$ back from my friend; the 100 dollars OUT are simply the 100$ I hand over to my friend.
In this world view it would thus seem that there is 190$ in circulation. But we all know that there is only the 100$ originally from the bank available.”
This is directly equivalent to the warped rGHE “back radiation” argument for the surface of the Earth:
“You can just ADD the DWLWIR ‘flux’ as an extra INPUT of energy to the surface, as an addition to the original solar heat flux, thus directly creating extra warming (as if they were two of a kind, as if they were both heat fluxes); 165 W/m^2, 232K >> [165+345-112=] 398 W/m^2, 289K.”
– – –
There is only the 165 W/m^2 available (in from the bank, the Sun) as energy throughput for the surface system in a steady state at any one time. There is no ‘extra’ energy from the atmosphere! For the Earth system as a whole, the energy available increases to 240 W/m^2:
http://i1172.photobucket.com/albums/r565/Keyell/Varmesyklusen_zpsd9293c3e.png
Kristian 4:44am: Your diagram is faulty because you continue to become confused about basic physics invoking heat transfer when only energy transfers in nature. Your diagram indicates humans shouldn’t be able to see the atmosphere as your atm. white block doesn’t have an arrow for radiative energy transfer toward surface. Yet humans can see the sky and clouds thru natural radiative energy transfer. Back to the drawing board Kristian. Study Willis’ diagram 1:22pm to find faults in your diagram and physics of how humans can see clouds.
Also your banking analogy is faulty; banks can create money thru their lending practices; money supply is not conserved, energy is conserved.
In short, Willis, you appear to believe that the surface of the Earth needs to absorb a total energy flux of [165+345-112=] 398 W/m^2 (which is NOT a heat flux – it’s … something else, a mathematical construct) in order to be able to maintain its temperature of 289K. But the FLUXES are not the ones that generate the temperature. The temperature corresponds to and is ‘maintained’ by the INTERNAL ENERGY [U] (+ system ‘heat capacity’), the energy statically held within the system in question. The fluxes [Q_in and Q_out] (energy dynamically moving between (to and from) systems) are only there to balance the energy throughput (IN – OUT = 0). These are some of the most fundamental principles in Thermodynamics. And yet they’re summarily ignored.
Trick, it is thoroughly warped world views like the one you’re promoting here that make it possible for utterly absurd and backward hypotheses like the rGHE/AGW one to flourish in this modern age.
So with 165 watts going into the ocean, it’s like solar water heater getting 3960 watts hours per day.
So solar water heater can operate at about 60% efficiency. If solar water heater received 7200 watts hours per day of solar flux at .6 that is 4320 watts of storable heat. And there are places on earth where one can get 7.2 Kw per day. ‘
BUT ocean can more efficient than the human made solar water heater, because it has a “different” requirement. Because man made solar heater requires hot water, and ocean just need “air around temperature”.
So if just wanted slightly warmer water than tap water you could make a more efficient solar water heater [but other heating a pool, no one wants this].
And if the tropics were cooler than we have at moment, the Ocean could be even more efficient and/or get more watts of solar flux because there are less clouds.
And of opposite, if warmer than we have now, it would less efficient and less solar flux.
Or terms of efficiency solar ponds are consider to be cheap and very efficient. Oceans cost nothing and I would say are even more efficient [for Mother Earth’s purposes] than solar ponds.
And wind, evaporation, and waves [for Mother Earth’s purposes] make the ocean more efficient- in terms of warming earth].
So rather thinking mother nature can’t get 60% efficiency by accident [as not being as clever as humans] the ocean could be somewhere around +90 efficient [or 110 % efficient- because we too stupid to figure it out- like the bumble bee doing the impossible of flying].
Kristian 6:37am – I just looked outside. I can see the clouds today which is impossible in your faulty diagram.
Willis’ diagram explains per basic physics; your diagram is too confused to offer even a basic physical explanation. I suggest start with Planck’s original paper to find why you are incorrectly stating “With a massive atmosphere in place, all bets are off.” This situation is exactly addressed in that original paper and still offers the best explanation for why humans can see cooler clouds.
According to you Kristian: “The two ‘hemifluxes’ are both merely mathematical constructs, conceptual, potential heat fluxes”, so why do you treat the fluxes at the ToA differently than the fluxes at the surface? Are they not mere mathematical constructs? You also state that: “In the real world, not in the conceptual world, the HEAT FLUX is indivisible. All there is. It is ONE flow, one transfer of energy. There is no way you can physically split it into two separate, oppositely flowing streams of energy.” Surely that also applies to the sun/earth system? In that system they’re not even “oppositely flowing”.
Phil., December 19, 2014 at 7:39 am:
“According to you Kristian: “The two ‘hemifluxes’ are both merely mathematical constructs, conceptual, potential heat fluxes”, so why do you treat the fluxes at the ToA differently than the fluxes at the surface? Are they not mere mathematical constructs?”
Because Earth’s final radiative flux through the ToA to space is an actual, detectable flux/transfer of energy, that is, a HEAT FLUX, Phil. You need to start grasping the distinction.
The 240 W/m^2 mean radiative flux emitted by Earth to space is equivalent to the 240 W/m^2 mean radiative flux absorbed by the Earth system from the Sun. They are both thermodynamically working fluxes of energy between systems, i.e., HEAT FLUXES. Q_in and Q_out. They can do stuff. For the surface, the 240 W/m^2 fluxes are equivalent (directly comparable) to the incoming 165 W/m^2 solar radiative HEAT FLUX absorbed, AND to the outgoing 53 W/m^2 terrestrial radiative HEAT FLUX emitted. Those purely calculated 398 W/m^2 UWLWIR and 345 DWLWIR ‘fluxes’ of yours are nothing of the kind. Neither of them. THEY ARE NOT HEAT FLUXES, Phil. THEY ARE NOT ACTUAL, DETECTABLE FLUXES/TRANSFERS OF ENERGY AT ALL! They don’t do anything. Only the heat (what you call the ‘net’ of the two) is able to do thermodynamic work.
Yet you insist that we TREAT them as if they were heat fluxes. You expect everyone to agree that your calculated DWLWIR ‘fux’ will directly raise the temperature of the surface upon absorption. Then you effectively expect us to accept that a HEAT FLUX is transferred from the cool atmosphere to the warm surface. It doesn’t happen, Phil!
“You also state that: “In the real world, not in the conceptual world, the HEAT FLUX is indivisible. All there is. It is ONE flow, one transfer of energy. There is no way you can physically split it into two separate, oppositely flowing streams of energy.” Surely that also applies to the sun/earth system? In that system they’re not even “oppositely flowing”.”
Yes, of course. Hot Sun naturally heats cool Earth. Earth doesn’t heat the Sun. Just like the warm surface heats the cool atmosphere, NOT the other way around. There are TWO separate heat transfers going on here, if you’ve noticed …
Kristian 11:43am: “Those purely calculated 398 W/m^2 UWLWIR and 345 DWLWIR ‘fluxes’..”
More confusion shown by Kristian in using the word heat. The 345 DWLWIR flux is not “purely calculated”; humans can see part of the DWLWIR (clouds!) which can increase the thermometry measured temperature of ocean surface water night and day as shown in top post data. The DWLWIR flux is very physical Kristian; fix your confusion – drop heat from your confusing vocabulary and invoke use of energy transfer per Dr. Max Planck’s paper. Enter into modern times.
Suppose one had PV panels floating under the surface of the ocean.
So 1 meter under water and they were a meter square and they neutral buoyant so always had the 1 meter panel 1 meter under the surface and they were able to float at an angle so they were roughly facing the sun. Or point at the sun better than solar panel on someone’s roof.
And have them crowded into a 1 square km area ocean so that 1/2 of the total area was used and not shading each other. Or as efficient use of 1 km square area because one does need access them with needing space for roads. So 2 1 square km gives a 1 km square of area which receives solar energy.
So these things are going move with a wave just as boat or log moves with the waves.
So the upshot is these solar panel could get as much electrical power as solar panel on land.
Or the small amount solar flux blocked by the water isn’t a wavelength that solar panel get energy from, and keeping the solar panel cool increases it’s efficiency. So it’s even possible they work better at getting solar energy than solar panels on land.
Now let’s make big enough so one could imagine it could have some global affect on temperature. So a 1 by 2 km area has 1 million square meter of panels receiving sunlight. And 1000 by 2000 km has 1 trillion square meters.
Now where a solar map of ocean?
http://oceanworld.tamu.edu/resources/ocng_textbook/chapter05/chapter05_06.htm
http://oceanworld.tamu.edu/resources/ocng_textbook/chapter05/Images/Fig5-8A.htm
Apparent west Africa can get about 250 W/m2
So get 20% of 250 it’s 50 watts per square meter of electrical power. Though this is averaged
over a day and over a year.
Or at 250 W/m2 in 24 hours get 6000 watts. Or 6 Kw hours. And with 20 efficiency, 1.2 kw hour of electrical power per square meter per day. Or 1 trillion square meters get 1.2 trillion kw hour per day and 438 trillion kw hour per 365 days.
Now what is done with to electrical power depends on whether it’s warming or cooling earth- if used for lasers that sends a friendly message to the rest of galaxy or for lasers to burn a hole in the moon, then doing the most to cool Earth. If simply used to power the electrical grid, then probably having little effect in terms of net warming or cooling. If the electrical power it used to warm the bottom of the ocean [say pumping warm water to the bottom] then it’s basically storing heat at the bottom of the ocean- that be about most effective way to warm earth. Though human would see no significant amount of heating, and such heating would trivial to compared a underwater volcanic eruption or dead things decaying, hurricanes, whatever- or lost in the noise.
The other part of it, is what effect to regional environment would be caused drawing that energy from the region?
So before the solar panel are put in, one measures the surface of the water and 100 meter below the surface of the water, and do this for a couple years and make very precise measurements.
So 1 billion dollars spent doing the best job that could be done to measure the area and surrounding area. It’s going to the Moon type project to precisely measure it.
So after you got the solar installed and operating for a year, you go back and measure it again.
What would be the difference in average surface temperature and temperature at 100 meters.
So would the 100 meter be colder or warmer and how much. Would the surface be warmer or colder and how much?
It appears that you are playing some game instead of doing a proper energy balance. Since you claim to have read my post and seen the surface temperature profile it should be clear. You can’t just consider some of the processes and ignore other major ones as you and verney do, that’s nonsense.
Try again, for an ocean at 300K SST, consider a control volume 1m square and 3 micron thick, fluxes through the top surface are DWIR (+ve), IR thermal emission (-ve, ~450 W/m^2), conduction (-ve), evaporation (-ve) and convection (-ve); fluxes through the bottom surface are conduction (+ve), convection (+ve), DWIR (-ve, ~0). Most of the cooling at the surface is due to the thermal emission, both during the day and night. During the day the insolation penetrates and heats the layers below this thin surface layer, it has very little direct contribution to this control volume, flux in and out being virtually the same. Remove the DWIR absorbed in this volume and the surface temperature will drop significantly.
Kristian December 18, 2014 at 3:29 pm
Phil., December 18, 2014 at 6:25 am:
Me: “The issue here is that you imply that we know that the ocean surface emits a BB flux intensity of a full 395 W/m^2 according to its temperature because that’s how the ‘satellites measure the SST’. You don’t come out and say it, but that’s what you’re insinuating.”
Phil: “No I explicitly state that, it’s been measured many times, here’s an example:
The measurement shows the radiance from the surface with absorption from atmospheric trace gases such CO2, H2O, O3 and CH4. Satellite measurements of the radiance are made in the region indicated as ‘Window’ to avoid interference by these species.”
For crying out loud, are you pulling my leg!? Why are you posting a ToA spectrum when arguing about surface emissions!? And how are these spectra actually generated? Any idea? Read up on it?
More clowning around by Kristian, the subject under discussion was ‘satellite measurement of SST’, you had challenged my statement of how such measurements are made. So I presented a spectrum measured from a satellite, and then you protest that it’s made from space! Where do you think satellites make their measurements from?
“As stated they do it by measuring the radiance in the ‘Window’ region so by your own admission I’m correct.”
*Sigh* Avoiding the issue ………..
No, answering your question, you just don’t want to hear the answer.
“No it hasn’t [been shown] that’s just your repeating the same mantra.”
In the link provided it is shown, yes. It says so right in the text of the article discussed. Surface emission is NOT ‘measured’. It is CALCULATED using a specific S-B formula. It’s right there, Phil. You can deny it all you want. Read the bloody paper!!!
I did, it quite clearly says that the surface emission is measured using a Kipp-Zonen net radiometer and the results are presented in figure 7, where they describe it as “observed longwave radiation emitted by the ocean surface”. In their conclusions they state: “During 9 days, 5 min averaged measurements of (1) solar radiation fluxes (incoming and outgoing) and longwave radiation fluxes (atmospheric and surface emission), at 6 m above the sea level;………….were gathered continuously.”
So I’m not the one who’s denying anything.
You’re looking more and more silly, Phil.
No, that would be you.
“No that’s your pet theory which no text on radiation heat transfer endorses (…)”
Heh, I’m sorry, Phil, but the physical discipline concerning itself with system/object temperature change from energy transfer is called … THERMODYNAMICS.
And the discipline that concerns itself with how those transfers occur is HEAT TRANSFER. As Bejan says in his book on the subject: “Heat transfer has become not only a self-standing discipline, but an indispensable discipline at the interface with other pivotal and older disciplines. ………… Thermodynamics today is able to teach modeling, simulation and optimization of ‘realistic’ energy systems because of the great progress made in heat transfer.”
It is quite obvious that you have never opened even an introductory textbook on this particular subject.
Well it’s long been clear that what is obvious to you doesn’t relate to reality, this is another example since I’ve taught the subject at both the graduate and undergraduate level as well as written research papers which required its application.
I’ll repeat what I told you upthread: “Out here in the real world, radiative transfers and their resulting effects must comply with the Laws of Thermodynamics before anything else, just like conductive transfers and their resulting effects have to. In the real world, in nature, it is not allowed for an energy transfer from a cool place to a warm place to make the temperature of that warm place rise. It simply doesn’t happen. If you observe something where it might LOOK like it does, it is your interpretation of what happens that’s wrong.”
That depends on your having a correct view of the Laws of Thermodynamics which you do not. I’ll repeat the observation I made before: a thermocouple measuring 1000K in a open Bunsen burner flame is exchanging radiation with the surrounding surface at 300K, measurements of the energy flux in each direction can be made. Replace the surrounding surface by one at 600K and the measured temperature will go up, as will the measured energy flux in each direction, there is no violation of the Laws of Thermodynamics, net flow is still from hot to cold.
Phil., December 19, 2014 at 7:15 am:
“More clowning around by Kristian, the subject under discussion was ‘satellite measurement of SST’, you had challenged my statement of how such measurements are made. So I presented a spectrum measured from a satellite, and then you protest that it’s made from space! Where do you think satellites make their measurements from?”
Gee, who’s the clown here? Phil insists on ‘misunderstanding’ what I say so that he has something to argue against. I very clearly did not say that the spectrum was ‘made from space’. I said the spectrum presented was a ToA spectrum, not a sea surface spectrum. You cannot read SST from a ToA spectrum, Phil. And satellites cannot measure surface IR flux intensities. There’s an atmosphere in the way. This is well-known by everyone.
BTW, you continue to avoid the issue. Do you believe the satellites somehow do in fact estimate SSTs from surface IR flux intensity, or do you know they don’t? If you do know, why not just come out and admit it? In plain words. Why the constant evasion. Why the smoke and mirrors? What are you afraid of?
“I did [read the paper].”
You obviously didn’t. If you did, you would follow what I was saying in that previous comment I linked to. Take a look at Eq. (4). There’s how the sea surface ‘LW flux’ is ‘measured’, Phil. Not in any other way. All you basically need to measure is the surface temperature. Then you simply put this into the S-B equation. And voilà! This is how it’s always done. It’s no secret at all. You are simply apparently somehow prevented from getting it. It is based on an assumption of the sea surface as a ‘pure emitter’. (We all know it isn’t.)
The Kipp-Zonen net radiometer detect the NET RADIATION (that is, the HEAT FLUX), Phil, and then it has it built in to CALCULATE the DWLWIR ‘flux’ from this and the surface temperature. Simply subtract the computed UWLWIR from the measured heat flux (see Eq. (2)). And voilà! This is invariably how it’s done, Phil. It’s no secret at all. You’re just refusing to realise it, to take it in. Because then, apparently, your world view would crumble.
“(…) it’s long been clear that what is obvious to you doesn’t relate to reality, this is another example since I’ve taught the subject at both the graduate and undergraduate level as well as written research papers which required its application.”
You’re funny, Phil. I’m sure you have. It is still me who refer to reality and you who refer to a specific model of reality. What I discuss is what we actually observe out there in the real world, what physical phenomena we actually detect. What you do is assuming that your interpretation of real-world effects is fact. It’s not, Phil. It’s an assumption, a conceptual model attempt at explaining reality. The old masters inventing and refining this conceptual model knew this perfectly well. They pointed it out all the time. Today this knowledge seems to be lost. People take it for granted as fact. It’s not. It’s tradition.
When I say that what we actually physically detect in any heat transfer situation is the unidirectional HEAT FLUX from hot to cold only, the actual spontaneous transfer of energy between the objects/systems involved due to the difference in their temperatures, I’m telling the truth, Phil. I refer specifically to reality. The real situation. This IS the reality of things.
When you, however, say that in a heat transfer situation, there are in fact TWO opposite fluxes/transfers of energy, one from hot to cold and one from cold to hot, and that the unidirectional heat flux only somehow comes as a netted out end result of these two doing their work at each end, you are not referring to observed reality, Phil. You have to understand this. You are distinctly referring to your model, your interpretation of reality, the principle of bidirectional energy exchange in a heat transfer. This principle arose from the ideas of the archaic (and very much outdated) ‘caloric theory’ in the 18th and early 19th centuries, normally attributed to Pierre Prevost. It has indeed stuck. But even more than 200 years down the line, there is still no experimental evidence that such separate, opposite ‘hemifluxes’ inside a heat transfer really exist. It is still all a theory, an assumption, a conjecture. There are other models out there describing and interpreting the very same reality that DON’T end up violating the Laws of Thermodynamics. Just saying.
There’s a very simple reason why the postulated ‘hemifluxes’ inside a heat transfer have never been detected. They CAN’T be detected. Even if they did exist, they could never be physically isolated from one another to be separately observed. Inside the integrated radiation field through which the heat transfer moves. No matter what you do, the thing you end up with is ALWAYS the heat flux. It is the only thing that could ever possibly be physically detected within a radiative heat transfer. Everybody knows this, Phil. This is specifically WHY we apply the radiative formulas that we do to ‘extract’ our assumed ‘hemifluxes’. If we could simply go out and detect them just like that, we wouldn’t need to compute them. We know we can’t. It’s physically impossible. We DETECT only the heat and we measure the temps and from these we CALCULATE our ‘hemifluxes’. That’s all we can ever do. But you seem to be in total denial of this simple fact, Phil. Even though it was never a secret this is how it’s done. Always. Without exception. I’m sorry if this is too much reality for you to handle in one go. But I feel you ought to know …
“That depends on your having a correct view of the Laws of Thermodynamics which you do not.”
I’m afraid I do, Phil.
“I’ll repeat the observation I made before: a thermocouple measuring 1000K in a open Bunsen burner flame is exchanging radiation with the surrounding surface at 300K, measurements of the energy flux in each direction can be made.”
No. CALCULATIONS of the energy fluxes in each direction can be made, Phil. Major difference. The ‘is exchanging radiation’ part is YOUR assumption. That’s the Prevost bidirectional principle (his ‘Theory of exchanges’) dating from the times of the caloric theory right there.
“Replace the surrounding surface by one at 600K and the measured temperature will go up, as will the measured energy flux in each direction, there is no violation of the Laws of Thermodynamics, net flow is still from hot to cold.”
See, this is what you refuse to get, Phil. Yes, if you raise the surrounding temp from 300 to 600K, of course the measured temperature will go up. Because the TOTAL HEAT to the thermocouple will go up, for crying out loud! It’s not ‘evidence’ of bidirectional flow! No one has ever claimed that such an EFFECT would violate the Laws of Thermodynamics. For the nth time, Phil, it is your interpretation, your attempt at explaining how this effect comes about that violates the Laws of Thermodynamics. Not the effect itself.
There are no ‘measured’ energy fluxes in each direction. There are only CALCULATED energy fluxes in each direction, based on temperatures and the flux that is the one that’s ACTUALLY at all times being measured (as in detected): the HEAT FLUX.
Here is where and how your “back radiation” explanation violates the 2nd Law of Thermodynamics: You say that the energy flux from the cool atmosphere to the already warmer surface will directly make the surface even warmer, while maintaining that since the ‘net flow’ is still from hot to cold, then this is no problem, no violation of the Laws of Thermodynamics.
Er, it most certainly is! To see why, you need to understand what a HEAT FLUX is and what it does, plus what the 2nd Law says about the transfer of heat. You clearly don’t, Phil. If you transfer energy from one system to another and this transfer directly raises the temperature of this other system in absolute terms, then you have by definition transferred HEAT [Q] to it (disregarding ‘work’ [W]) to increase its internal energy [U]. That’s what heat does. It HEATS. And you have transferred heat from a cooler to a warmer system. Heat does not spontaneously transfer from cold to hot, Phil.
You seem utterly incapable of comprehending what I’m telling you. Or maybe just pigheadedly unwilling to. I’ve restated this so many times now:
You expect each of your two ‘hemifluxes’ to accomplish direct heating at each end of the heat transfer, as if they were both HEAT FLUXES in their own right. I’m sorry, but this is at odds with … reality, Phil. In any heat transfer, you can only ever have heating at ONE end. At the other end there will be cooling. The heat flux goes from hot to cold only, transferring energy from the hot object to the cold object, reducing the internal energy of hot and increasing the internal energy of cold. That’s how a heat transfer works. It doesn’t matter if the heat transfer is a radiative one. If the universe worked like you want it to, heating in all directions, there would be no universe for us to live in, complete anarchy. The laws of physics don’t allow it to happen. And thank goodness for that.
You confuse reduced cooling with increased heating. Insulation reduces cooling (less energy output per unit of time). An additional heat source increases heating (more energy input per unit of time). You imagine the atmosphere to be an additional, separate heat source to the surface. It’s not. How could it be!? The atmosphere is the recipient. It cannot be a source to its source. It cannot provide extra input of energy. To heat its own source.
Kristian 7:15am shows substantial confusion having not read & understood Planck’s original paper: “It is based on an assumption of the sea surface as a ‘pure emitter’.”
There is no such assumption in Dr. Max Planck’s original paper on the subject.
“What I discuss is what we actually observe..”
Not according to Dr. Max Planck’s original paper. Kristian discussion diagram 4:44am does not allow humans to observe clouds yet we do as Planck shows we should.
“When I say that what we actually physically detect in any heat transfer situation is the unidirectional HEAT FLUX…”
Not according to Dr. Max Planck’s paper on the subject where he uses the word “heat” correctly.
Heat does not exist in any object, heat has never been detected, only energy has physical existence in nature, our eyes detect what exists, visible energy flux. Energy flux was detected in the top post experiment 1st chart, heat flux has never been detected separate from energy flux.
“I’m telling the truth, Phil..”
Not according to Dr. Max Planck’s original paper.
“..there are in fact TWO opposite fluxes/transfers of energy, one from hot to cold and one from cold to hot, and that the unidirectional heat flux only somehow comes as a netted out end result.”
Correct according to Dr. Max Planck’s original paper quote verbatim below. And 2LOT. Except there is no physical heat flux detected separate from energy flux.
“There’s a very simple reason why the postulated ‘hemifluxes’ inside a heat transfer have never been detected. They CAN’T be detected.”
Correct, only energy flux exists to be detected, no separate heat flux has ever been detected.
“We DETECT only the heat…”
Not according to Dr. Max Planck’s original paper. Heat has never been detected separate from energy.
“There are no ‘measured’ energy fluxes in each direction.”
Not according to Dr. Max Planck’s original paper. His years of experiments are laid out with measured energy fluxes in both directions confirmed by much lab work of other experimenters:
“..body A at 100C emits toward a body B at 0C exactly the same amount of radiation as toward an equally large and similarly situated body B0 at 1000C. The fact that the body A is cooled by B and heated by B0 is due entirely to the fact that B is a weaker, B0 a stronger emitter than A.”
Read, study & understand Dr. Max Planck’s original paper Kristian, come into the modern world of energy transfer leave all the heat existing separately from energy confusion behind you:
http://www.gutenberg.org/ebooks/40030?msg=welcome_stranger
Trick, we’ve had this discussion many times before, so I’m surprised (or not) how you still manage to consistenly misrepresent what I’m saying. You say for instance: “Heat does not exist in any object”. Exactly right. That’s what I’m saying. As per the thermodynamic definition of ‘heat’. Heat is not something that is contained within a system. That notion is merely a remnant from the ‘caloric theory’. It is not a static quantity. It is a dynamic quantity. Energy i transit between systems or regions at different temperatures. This is the Q in the First Law of Thermodynamics: ΔU = Q – W. Ever heard of it? It would appear from the above that you haven’t. U is the system’s static fund of energy, its so-called ‘internal energy’, corresponding to its temperature, T. Q and W are the energy transfers to or from that system, changing its U (and thereby its T). Q is the ‘heat flux’ to/from. W is the ‘work done’ on/by. What about this basic thermodynamic setup is it that you don’t get? You state repeatedly: “heat flux has never been detected separate from energy flux”. And you show your confusion about the thermodynamic concept of heat. You simply don’t know what it is. And therefore you fail to see its worth.
A heat flux IS an energy flux, Trick? It is THE energy flux actually detected in a heat transfer. It IS simply the energy transferred from the hot to the cold system. What we observe. That’s why it’s called a ‘heat transfer’.
Also, I’m fully aware of the fact that both Planck and Maxwell and more of the good old fellas worked by the Prevost bidirectional principle, his theory of exchanges. That’s exactly what I told Phil above, wasn’t it? The point is, all these people were always fully aware (never trying to hide it, like you people do today) that it was and is just that: a principle, a theory, an assumption, an interpretation, a model of reality. It’s become tradition, convention. Part of the reason why is because of its simplicity and its usefulness in most situations. It works perfectly well as long as you deal with regular heat transfers where both (or all) objects involved actually COOL to various degrees. But as soon as you bring in a constant external heat source for ONE object and then try to analyse what happens when you radiatively insulate that heated object, THAT’S when cracks start to appear. Because then it all of a sudden creates a situation where the cooler insulating object or surface in fact ends up directly HEATING the warmer (heated) object. And such an analysis would evidently violate the 2nd Law of Thermodynamics. Because it would turn a cooler object into a HEAT source of a warmer one. The insulating layer would force the heated object to become warmer. The EFFECT is indeed real. But it would force it only indirectly. Not by directly heating it some more, by acting as a second heat source to its own heat source. Rather by itself warming from the absorbed heat flux from the warmer object, thus setting up a higher temperature ‘potential’ facing the heated object, consequently reducing the energy transferred per unit of time from the warmer heated object to the cooler insulating surface.
Kristian 8:09am: Still confused I see. No reading, study, comprehending of the Planck paper yet huh?
“Heat is not something that is contained within a system.”
Yes of course according to Planck paper p.72 verbatim for 1LOT: “the sum of the energy of radiation and the energy of the material bodies remains constant, we have dU + p dV – Q = 0.”
Planck invoking 1LOT eqn. precisely writes energy of radiation Q, not heat of radiation Q. Energy is conserved in 1LOT.
No heat in an object means heat cannot transfer from that object; since only energy is contained in an object only energy can transfer from/to that object – invoking 1LOT correctly as shown in Willis’ 1:22pm 1st chart.
“Q is the ‘heat flux’ to/from.”
Not according to Planck paper. In Planck’s precise 1LOT eqn., Q is the energy of radiation. When doing energy balance 1LOT, always invoke conserved energy transfer.
In fairness to Kristian, Planck and many authors do define & use the word “heat” interchangeably with “energy” correctly when they are not doing 1LOT. A problem arises when Kristian uses “heat” in a way that is not interchangeable with conserved “energy” the result is Kristian’s 4:44am faulty chart indicates humans cannot see clouds so 1LOT not invoked correctly. My advice continues to Kristian to end his 1LOT confusion and faulty charts, simply drop the word “heat” when invoking 1LOT as Planck does, as it adds nothing in modern times. Heat is a relic of ancient practices that can easily cause confusion as shown in Kristian’s faulty 4:44am chart.
Gee, who’s the clown here? Phil insists on ‘misunderstanding’ what I say so that he has something to argue against. I very clearly did not say that the spectrum was ‘made from space’. I said the spectrum presented was a ToA spectrum, not a sea surface spectrum. You cannot read SST from a ToA spectrum, Phil. And satellites cannot measure surface IR flux intensities. There’s an atmosphere in the way. This is well-known by everyone.
How do you think a ToA spectrum is made if not from space? Of course satellites can measure surface IR fluxes, they do so through the transparent ‘window’ region of the atmosphere which was clearly marked on the spectrum I presented, the AVHRR and MODIS both measure SST utilizing the 11 and 12 micron channels.
BTW, you continue to avoid the issue. Do you believe the satellites somehow do in fact estimate SSTs from surface IR flux intensity, or do you know they don’t? If you do know, why not just come out and admit it? In plain words. Why the constant evasion. Why the smoke and mirrors? What are you afraid of?
You seem to be delusional, I have repeatedly said that satellites measure SST by measuring the surface radiance, I’ve repeated it above.
“I did [read the paper].”
You obviously didn’t.
I did very carefully, you should do so too because your description of what they did is totally wrong!
Take a look at Eq. (4). There’s how the sea surface ‘LW flux’ is ‘measured’, Phil.
That is not how they measured the ‘LW flux’, as they state in the paper they used a radiometer, the data from which are plotted in fig 6: “observed longwave radiation emitted by the ocean surface without correction (grey solid circles)”, they also plot the data “with correction based on Pe ́rez and Alados-Arboledas (1999) (open black squares)”, this was necessary because the radiation sensor experienced some solar heating effects. I should point out that if as you assert they didn’t actually measure the flux but just calculated it such a correction wouldn’t be necessary! The measured upward longwave was consistently about 450 W/m^2, which agreed very well with the “estimated values of LWUP” which they made using Eq. (4).
Not in any other way. All you basically need to measure is the surface temperature. Then you simply put this into the S-B equation. And voilà! This is how it’s always done. It’s no secret at all. You are simply apparently somehow prevented from getting it. It is based on an assumption of the sea surface as a ‘pure emitter’. (We all know it isn’t.)
Clearly the paper which you cited refutes your argument, it clearly states that the upward flux was measured, describes exactly how it was done, and shows that the value estimated using the surface temperature (Eq. 4) agrees very well with those measurements.
The Kipp-Zonen net radiometer detect the NET RADIATION (that is, the HEAT FLUX), Phil, and then it has it built in to CALCULATE the DWLWIR ‘flux’ from this and the surface temperature. Simply subtract the computed UWLWIR from the measured heat flux (see Eq. (2)). And voilà! This is invariably how it’s done, Phil. It’s no secret at all. You’re just refusing to realise it, to take it in. Because then, apparently, your world view would crumble.
You have this completely backwards, the K-Z radiometer has both an upward and downward pointing sensor which independently measure the LWup and LWdown. This is how it is done not by the computational method which you have invented. It is you who is ‘refusing to realize it, to take it in’.
Your premise was that the fluxes couldn’t be independently measured and you cited this paper as supporting this view. Reading the paper shows that you have completely misunderstood it and in fact it shows that your premise is completely false. Hoist on your own petard!
Phil., December 20, 2014 at 9:00 pm:
“You have this completely backwards, the K-Z radiometer has both an upward and downward pointing sensor which independently measure the LWup and LWdown. This is how it is done not by the computational method which you have invented. It is you who is ‘refusing to realize it, to take it in’.”
Hahaha, so Phil here doesn’t even know how pyrgeometers work. That’s priceless. And still so cocksure. Like a true, clueless warmist. OF COURSE he believes, then, that a net radiometer would directly detect his imaginary UWLWIR and DWLWIR ‘fluxes’. No wonder. Newsflash, Phil. That’s exactly what they DON’T do. They COMPUTE them. From the ‘net radiation’ (the HEAT FLUX) to/from the sensor generating a voltage output, which is then put into the following equation:
U_emf/S + σT^4 = LW_dw
U_emf : thermopile output voltage [μV]; S : instrument sensitivity/calibration factor [μV/(W/m^2)]; T : sensor temperature [K]
The U_emf/S term gives the actual flux to/from the sensor surface, the HEAT FLUX (or ‘net radiation’). Normally it would be negative (heat flowing OUT OF the sensor to the cooler air above). The σT^4 term is the calculated emission ‘flux’ from the sensor, assumed to be a black body and a pure emitter. So if the sensor detects a heat flux going out/up of say 50 W/m^2 and we calculate the BB (UWLWIR) ‘flux’ from the sensor according to its temperature to be say 350 W/m^2, then we can derive a DWLWIR ‘flux’ from the atmosphere using the equation above and get 300 W/m^2.
This procedure is neatly explained here:
http://en.wikipedia.org/wiki/Pyrgeometer#Measurement_of_long_wave_downward_radiation
You could just go to Kipp & Zonen’s own website to check it out for yourself, Phil. This is invariably how it’s done. You’ll just have to live with it:
file:///C:/Users/Kristian/Downloads/KippZonen_InstructionSheet_Pyrgeometer_CGR4_V1001.pdf
http://www.kippzonen.com/Product/85/CNR-4-Net-Radiometer#.VJaeBV4AA
Do you want me to quote from these sources …? Or should we just put this topic to rest?
“..body A at 100C emits toward a body B at 0C exactly the same amount of radiation as toward an equally large and similarly situated body B0 at 1000C. The fact that the body A is cooled by B and heated by B0 is due entirely to the fact that B is a weaker, B0 a stronger emitter than A.”
I think what could be ignored is “stronger emitter” and “equally large [body]”
And atmosphere doesn’t seem to be an example of a body. One can call it a body of air, but body
in the above case is more like a chunk of metal or a brick. Or a larger or smaller body does not make much sense if one talking about gases [what could it mean larger atoms, volume, etc].
So body A could a brick and body B could be another brick [or chunk of steel] of the equal size.
As compared to difference size bricks. Or a brick [A} and some air [B] [somehow equally large].
And then we got “and similarly situated body B0 at 1000C”.
Or same distance and/or angle from A.
So with in regards to “DWLWIR flux ” all of the above is utterly ignored. It’s not a body. It’s not in any particular location, and no mention or clue as to how strong the emitter body is.
Let me state what seems to me very obvious, which is that sunlight has a stronger emitter than does the DWLWIR.
Or more precisely the Sun is vastly strong emitter [though at quite distant] as compared to the Earth sky.
And I go further and say the solar flux at Mars distance is much stronger emitter than Earth’s DWLWIR. And go even further and ask does the solar flux at Pluto distance have stronger emitter than Earth’s sky?
So can it be the solar flux at Pluto distance is a stronger emitter as compared to Earth
sky?
And I will leave it to any believer of back radiations to make their case why the Earth sky is a stronger emitter than the Sun at Pluto distance.
And if follow that with comparing it to our sunlight, that would be truly enlightening and wondrous.
According to Space Mission Analysis and Design [third edition] and on page 454, at Pluto
distance the solar flux is .9 watts per square meter.
The .9 watts per square meter solar flux should be mostly visible and Near IR light.
Less 1/2 visible light, so .3-.4 watts per square meter. Comparable [or more] visible light that we on Earth get from moonlight. So this sunlight is lighting millions of square mile of surface of Pluto at light level that roughly bright enough to read by.
Say 4 million square km of Pluto has this sunlight shining on it.
Which is 4 trillion square meter and is say it’s .3 watts, and so times 4 trillion, which totals 1.2 trillion watts of visible light.
Or in an hour that is 1.2 trillion watt hours of visible light.
Three Gorges Dam which is largest power plant in the world has 22,000 MW, though actual amount electrical power which is made: “generating 98.1 TWh in 2012”
And to generate 1.2 trillion watt hours of visible light in a year requires [at least- or assuming one had 100% efficient light bulbs] 10,512 TWh.
Or the Gorges Dam lacks enough energy generation capability to light such a large area.
Though entire world makes more than enough electrical power: “The production of electricity in 2009 was 20,053TWh. ”
http://en.wikipedia.org/wiki/Electricity_generation
Also with simple but perhaps quite large magnify glass, the sunlight Pluto could burn your finger.
The sun is strong emitter because it’s very hot and very large, but it’s also far away.
And the huge distance makes it a small apparent size.
As compared to CO2 molecule which has a weak and dim light, and is tiny [and a smaller apparent size 100 feet away from it]. And scattered in large volume of sky
One thing to add here. If steel greenhouse was source energy, rather medium the energy is conducted thru, it seems to me it would make a difference.
Or the body referred to above seems to assume, that the body has heat that it can radiate.
So the bodies A and B were heated up or it’s constantly having energy added to to the body it to keep it warm [whether 100 or 1000 C].
Phil., December 20, 2014 at 9:00 pm:
“How do you think a ToA spectrum is made if not from space?”
Yes. No one ever claimed otherwise. But a ToA spectrum is not the same as a surface spectrum. You do know that, right?
“Of course satellites can measure surface IR fluxes, they do so through the transparent ‘window’ region of the atmosphere which was clearly marked on the spectrum I presented, the AVHRR and MODIS both measure SST utilizing the 11 and 12 micron channels.”
You still don’t get it, do you? Yes, they have to use that IR emitted from the surface which goes straight through the atmosphere and out to space to be able to assess the SST. But this IR does not reach the satellite sensors with a flux intensity anywhere near your postulated pure surface BB emission of ~395 W/m^2. So there is no way you could ever use ‘flux’ in this way to estimate the surface temperature. Think it through, Phil. You understand this too. So what do you use? You assess the frequency/wavelength distribution of the surface IR you receive. This specific distribution corresponds directly to the surface temperature. And therefrom you can estimate SST.
To reiterate, the issue is whether or not DWIR contributes to SST and OHC.
The data we have regarding the IR absorbency of water and the temperature profile of the upper most sea surface resolves this issue conclusively:
IR can make no measurable contribution to SST or OHC.
Willis and I have shown energy analyses which show in some detail how it works, you have just handwaving assertions with no explanation which doesn’t carry any weight. Verney on the other hand just runs away and hides so I guess you have slightly more credibility than he does, however slightly more than nothing isn’t much.
If anyone is interested in the analysis of the physics of the sea surface which I presented in regard to IR, please see my comment 12/18 8:54am.
That’s hardly an analysis, it doesn’t even mention the absorption and emission of IR, it’s nonsense, do it right or stop wasting everyone’s time.
mpainter 8:55am: Your 12/18 8:54am is incorrect writing: “no one has shown that IR has any effect on SST”, disproven by the 1st chart in the top post. Chart shows measured SST effects by LWIR modulation day & night in real nature with real surface overturning. Shows LWIR can make precision instrument measurable contribution to SST.
Waste your time?
Then don’t read this. It is really simple.
Go read somewhere else.
Like, for example, a primer on radiative physics.
Trick December 19, 2014 at 7:09 am
Kristian 6:37am – I just looked outside. I can see the clouds today which is impossible in your faulty diagram.
That’s a good illustration. By the theory that photons from cold sources can’t do work on warmer surfaces we wouldn’t be able to see ice!
A photon from the ice at 0ºC hits a photoreceptor on the retina (at 37ºC) where it’s absorbed by a rhodopsin molecule causing a change in structure which ultimately leads to a cascade of electrons stimulating a signal in the brain.
That is correct for emitted photons, but most of the photons you “see” from ice are actually reflected. You don’t “see” the ice glowing on dark nights without a secondary source of photons.
Good, so what property of a photon is it that tells the absorbing entity what temperature source it originally came from?
None, but when you tell someone to “we wouldn’t be able to see ice” you are not talking about emission.
..
Just saying that most people’s eyes cannot “see” IR
David 9:40am – If we humans could see in the IR band, water snow would be black as opaque ice only reflects about 2-3% over the spectrum so we see water ice in daylight mostly by its emission in the visible, not very much by its reflection. Our eyesight is severely limited, sure, we cannot see ice glowing in IR. Nor the atm. glow in IR at night. Precision instrumentation is required to see ice et. al. glow at night. We need the moon, flashlights and such at night.
“Phil.
December 19, 2014 at 9:34 am
Good, so what property of a photon is it that tells the absorbing entity what temperature source it originally came from?”
Hot things emit more and higher energy photons. So ice always emits low amount longwave IR.
Hot water will emit more of same amount of longwave as ice, plus it emits shorter longwave IR than ice.
But ice can reflect or re-radiate or diffuse or transmit all kinds of wavelength. So expose ice to X-rays and it do all kinds of things and remain being ice. But when talking emitting one talking about the heat energy of a substance creating protons.
Or the kinetic energy of CO2 doesn’t create protons, rather it absorbs and re-emit a photons, or it’s re-radiating,
And could say the main difference between reflecting and re-radiating, is re-radiating sends the re-sends the photon in a random direction.
Reflection requires a surface [molecular structure as one has in all solids and liquids {not gases] and reflection can re-direct, direct light. Or reflecting light sends the light in a direction- and can reflect full spectrum of light as compared to just bits of it.
How ignorant can one get!? We don’t see ice because our eyes are bombarded by the IR photons emitted by the ice! Do you seriously believe this, Phil?
I know, but since we’ve established that photons don’t have a property which identifies their source temperature I was just trying to determine how the perverted second law theory was supposed to work.
Wiki:
Dissipation:
“Dissipation is the result of an irreversible process that takes place in inhomogeneous thermodynamic systems. A dissipative process is a process in which energy (internal, bulk flow kinetic, or system potential) is transformed from some initial form to some final form; the capacity of the final form to do mechanical work is less than that of the initial form.”
Second law of thermodynamics:
“The second law indicates increases in entropy due to dissipation of energy and to dispersal of matter and energy. It envisages a compound thermodynamic system that initially has interior walls that constrain transfers within it.”
http://en.wikipedia.org/wiki/Second_law_of_thermodynamics
That perverted second law?
No the one that Kristian expounds which says that light emitted from a colder body can’t be absorbed by a warmer body. Even though the light is the same frequency as light emitted from a hotter body which he maintains can be absorbed by the same body at the same temperature.
—No the one that Kristian expounds which says that light emitted from a colder body can’t be absorbed by a warmer body. Even though the light is the same frequency as light emitted from a hotter body which he maintains can be absorbed by the same body at the same temperature.—
Ok so take the lunar surface, it heats to around 120 C and hours of sunlight at 1360 watt per square meter does warm the surface to a higher temperature. There is a slight amount of heat
going below the surface but it’s dust act like very good insulation. So it amounts to a few watts per second per square meter. Or we shall ignore it as significant compare to the 1360 watts per second of sunlight.
Or one can say the temperature of the sun at lunar distance from it is around 120 C- at least in regard of material of lunar surface [other material can become hotter].
So lunar surface would not absorbing any more energy from the sunlight [other than a trickle of heat down further underground.
So it not a question that lunar surface does not warm up more, but rather it’s about the explanation of why it does not warm up more.
So 1360 watts of sunlight hit surface and +1300 watts is radiated from the surface.
So take some metal and put it on lunar surface and have sunlight shine on it for a couple days
and the temperature is same as lunar material- about 120 C.
Now have a lot of this metal and put it 1 meter above the ground and have cover football field area.
I would say in daylight the metal and the ground underneath it is 120 C.
So is that approx right or it somehow different.
And continuing, if put 1 meter cubes filled with water and these cubic can withstand 200 psi
and put them under the the metal. Then after days of daylight the top of the metal sheets could could less than 120 C and the water cube could less than 120 C and ground underneath it could less than 120 C. Or it may not reach 120 C and be absorbing a lot of sunlight energy. And then the sun goes down for 2 weeks, this things is not going to cool rapidly and would stay warmer
throughout the night than the ground normally is. And next day it’s going to absorb thousands times more energy than the ground. Or if replace those water cubes with solid blocks of copper it will be similar.
Kristian December 21, 2014 at 6:13 am
Phil., December 20, 2014 at 9:00 pm:
“How do you think a ToA spectrum is made if not from space?”
Yes. No one ever claimed otherwise. But a ToA spectrum is not the same as a surface spectrum. You do know that, right?
Yes, it’s the SST spectrum minus the portions absorbed by the atmosphere, in the ‘window’ region there is no absorption by the atmosphere, so in that region the ToA is the same as the surface.
“Of course satellites can measure surface IR fluxes, they do so through the transparent ‘window’ region of the atmosphere which was clearly marked on the spectrum I presented, the AVHRR and MODIS both measure SST utilizing the 11 and 12 micron channels.”
You still don’t get it, do you? Yes, they have to use that IR emitted from the surface which goes straight through the atmosphere and out to space to be able to assess the SST. But this IR does not reach the satellite sensors with a flux intensity anywhere near your postulated pure surface BB emission of ~395 W/m^2.
It certainly does, in the spectrum I showed at 900cm-1 the measured radiance is ~0.150W/m^2/sr/cm-1 which equals the radiance from a BB at 320K; for a surface at 300K it would be ~0.120W/m^2/sr/cm-1.
That’s the way it’s done, measure the radiance in the window region and compare it with the radiance from a grey body at the appropriate coefficient (~0.98) and the temperature at which they match is the surface temperature.
So there is no way you could ever use ‘flux’ in this way to estimate the surface temperature. Think it through, Phil. You understand this too. So what do you use?
See above.
Phil,
Read this carefully: The radiative flux from the surface straight to the satellite-borne instruments is as near a pure HEAT FLUX as you can get. This flux is NOT 395 W/m^2. You still manage studiously to avoid this fact. Why? The LWIR ‘atm window’ (heat) flux is (according to those infamous Earth energy budgets) anywhere from 20 to 40 W/m^2. Do you deny this?
You’re looking at a specific wavelength-radiance. Through this you get a picture of the wavelength/frequency distribution of the radiation actually escaping directly from surface to space. You do NOT get a picture of total surface BB flux intensity. So I wonder, why are you so hellbent at fighting this straw man? As if Verney is somehow denying the existence of any IR from the surface. If anything, Verney is questioning your 395 W/m^2 worth of IR from the surface. I say it can’t and doesn’t exist.
The only relevant thing here is the imaginary 395 W/m^2 surface ‘flux’ (and its supposedly opposing, but just as imaginary, 340 W/m^2 cousin down from the atmosphere). Not the fact that there is IR emitted by the surface and that some of it surely reaches directly into space. You come off as a clown still fighting this non-issue.
BTW, you already come off as a clown, Phil, denying and fighting the FACT that pyrgeometers (and hence net radiometers) do indeed always detect only the HEAT FLUX (‘net radiation’) to/from their sensor, from which they COMPUTE (using also their measured temp), using specified equations, the assumed UWLWIR and DWLWIR ‘flux’. (See my Kipp & Zonen-comment above.)
Read this carefully: The radiative flux from the surface straight to the satellite-borne instruments is as near a pure HEAT FLUX as you can get. This flux is NOT 395 W/m^2.
It leaves the earth’s surface as 395W/m^2 if the surface is at 289K, as I pointed out before some of it is absorbed by gases such as CO2, O3, CH4 etc.
You still manage studiously to avoid this fact. Why? The LWIR ‘atm window’ (heat) flux is (according to those infamous Earth energy budgets) anywhere from 20 to 40 W/m^2. Do you deny this?
I don’t know what you’ve been reading because I’ve been quite clear about this. If you measure the radiance over a particular wavelength range it will obviously be less than the total emitted. For the 8-12 micron band at 289K it will be ~32 W/m^2/sr, I have never denied this but it isn’t relevant to temperature measurement. You can determine the temperature of a BB emitter by measuring the radiance at any given wavelength, e.g. for a BB at 289K the radiance at 12microns will be 0.110 W/m^2/sr/cm^-1, so if you measure the radiance of a BB at 12 microns to be 0.110545 W/m^2/sr/cm^-1 then its temperature is 289K. If it’s a grey body like the earth’s surface you have to take into account 𝜺, (0.98 for earth).
When making measurements of the surface from space the radiance in the ‘window’ region is the same as was emitted from the surface (that’s why it’s called the ‘window’), so by measuring the radiance at 12 microns you can determine the temperature from the grey-body radiance.
You’re looking at a specific wavelength-radiance. Through this you get a picture of the wavelength/frequency distribution of the radiation actually escaping directly from surface to space. You do NOT get a picture of total surface BB flux intensity.
As explained above you’re wrong, that’s exactly what you do get.
So I wonder, why are you so hellbent at fighting this straw man?
Because it’s the truth, by the way you should check up what a straw man is.
As if Verney is somehow denying the existence of any IR from the surface.
By attempting an energy balance without including IR in either direction he is.
If anything, Verney is questioning your 395 W/m^2 worth of IR from the surface. I say it can’t and doesn’t exist.
You can say it as often as you like but you’re wrong, even the paper you cited gave measurements of it ~450 W/m^2 in that case (T ~299K).
BTW, you already come off as a clown, Phil, denying and fighting the FACT that pyrgeometers (and hence net radiometers) do indeed always detect only the HEAT FLUX (‘net radiation’) to/from their sensor, from which they COMPUTE (using also their measured temp), using specified equations, the assumed UWLWIR and DWLWIR ‘flux’.
As shown in the previous post you’ve been proved to be so wrong in multiple ways on pyrgeometers that I’d have thought that you’d be too embarrassed to bring it up. As stated before pyrgeometers measure the LW radiation incident on them, offset by the sensor temperature, by measuring the sensor temperature and calibration the incident LW is measured. The fluxes are real not assumed, if there were no incident flux the instrument would read zero!
Phil., December 22, 2014 at 11:42 am:
You don’t give up, do you, Phil?
You spout a constant stream of nonsense just to keep me busy it seems. Can’t possibly concede a single point, like a true dogma-driven warmist. Anyone would have realised long ago already that you simply don’t have a clue.
“It [the pure surface BB ‘flux’] leaves the earth’s surface as 395W/m^2 if the surface is at 289K, as I pointed out before some of it is absorbed by gases such as CO2, O3, CH4 etc.”
What you continue to ignore is that a ToA spectrum shows Earth’s final and total radiative heat flux to space, which is … 239 W/m^2. So your presented spectrum could NEVER add up to a 395 W/m^2 flux intensity. You seem not to comprehend at all what we’re discussing here. That doesn’t prevent you from babbling on and on as if you did, does it?
“I don’t know what you’ve been reading because I’ve been quite clear about this. If you measure the radiance over a particular wavelength range it will obviously be less than the total emitted. For the 8-12 micron band at 289K it will be ~32 W/m^2/sr, I have never denied this but it isn’t relevant to temperature measurement. You can determine the temperature of a BB emitter by measuring the radiance at any given wavelength, e.g. for a BB at 289K the radiance at 12microns will be 0.110 W/m^2/sr/cm^-1, so if you measure the radiance of a BB at 12 microns to be 0.110545 W/m^2/sr/cm^-1 then its temperature is 289K. If it’s a grey body like the earth’s surface you have to take into account 𝜺, (0.98 for earth).
When making measurements of the surface from space the radiance in the ‘window’ region is the same as was emitted from the surface (that’s why it’s called the ‘window’), so by measuring the radiance at 12 microns you can determine the temperature from the grey-body radiance.”
We have no quarrel on this, Phil. So why do you spend sooo much time on it? This is after all just you expanding on your straw man. No one has a problem with this. Neither does Verney, I’m sure. The point is, this whole thing is irrelevant to the discussion at hand: whether or not there IS actually an IR flux at 395 W/m^2 being emitted by a surface at 289K under a massive atmosphere like ours.
The real question is: Do you seriously believe, Phil, that if you add up the partial fluxes from all wavelengths within the atm window, then you end up with 395 W/m^2? From a temp of 289K? Even though we KNOW that the total from the ToA is 239 W/m^2.
“”You’re looking at a specific wavelength-radiance. Through this you get a picture of the wavelength/frequency distribution of the radiation actually escaping directly from surface to space. You do NOT get a picture of total surface BB flux intensity.”
As explained above you’re wrong, that’s exactly what you do get.”
As explained above you’re wrong. That’s exactly what you DON’T get. You get the ToA flux, Earth’s radiative heat flux to space of 239 W/m^2. The satellites CANNOT measure surface heat flux (not to mention your imaginary pure BB emission ‘flux’ of 395 W/m^2). Your continued obstinate denial of this simple point does not make you look particularly clever, I’m afraid. It is such a basic point, Phil.
“by the way you should check up what a straw man is.”
I know what a straw man is. That’s why I’m telling you you’ve constructed one. You claim that Verney deny the fact that there is IR coming off the sea surface. I’m pretty sure he doesn’t. But your convenient construction lets you go off on a tangent to divert from the real discussion.
“”As if Verney is somehow denying the existence of any IR from the surface.”
By attempting an energy balance without including IR in either direction he is.”
Shouldn’t you rather just ask him if this is what he believes? Rather than just assume that he does?
“As shown in the previous post you’ve been proved to be so wrong in multiple ways on pyrgeometers that I’d have thought that you’d be too embarrassed to bring it up. As stated before pyrgeometers measure the LW radiation incident on them, offset by the sensor temperature, by measuring the sensor temperature and calibration the incident LW is measured. The fluxes are real not assumed, if there were no incident flux the instrument would read zero!”
Are you being serious!? Instead of digging your hole ever deeper, you should really just read up on the subject. The incident LW to the sensor is specifically the ‘net radiation’ (equal to the HEAT FLUX). This is no secret. You can just go on with your lalalala tactic, Phil, but I’m afraid it won’t change this fact.
http://wattsupwiththat.com/2014/12/09/arguments-for-and-against-human-induced-ocean-warming/#comment-1818663
Just read what it says in the links provided. (Well, the pdf file you can find on the Kipp&Zonen website.)
I will quote from the Kipp & Zonen website. See if you manage to understand what is said:
“A pyrgeometer provides a voltage that is proportional to the radiation exchange between the instrument and the sky (or ground) in its field of view. The detector signal output can be positive or negative.
For example, if the sky is colder than the pyrgeometer, the instrument radiates energy to the sky and the output is negative.
In order to calculate the incoming or outgoing FIR it is necessary to know the temperature of the instrument housing close to the detector and the data must be recorded simultaneously with the detector signal.”
(You can find this quote in the CGR pyrgeometer brochure (PDF download) here: http://www.kippzonen.com/Product/17/CGR-4-Pyrgeometer#.VJiCNF4AA )
The equations to calculate the assumed ‘hemifluxes’ are freely provided in the pyrgeometer instruction manuals on the site.
And what is stated above (by the producer itself) agrees perfectly well with what is stated on the wikipedia page on pyrgeometers (to much to quote here and now):
http://en.wikipedia.org/wiki/Pyrgeometer#Measurement_of_long_wave_downward_radiation
Please read and report back, Phil. What does it say? Does the sensor DETECT either of the two ‘hemifluxes’? Or does it DETECT what is called the ‘net radiation’ (the IR ‘exchange’), but which really is simply the LW HEAT FLUX? And COMPUTES the assumed ‘hemifluxes’ from this and the sensor temperature? Based solely on the assumption of ‘energy exchange’/’bidirectional flow’.
Kristian December 21, 2014 at 2:37 am
Wow Kristian it’s really difficult keeping up with your changing stories!
First in reference to the paper you cited you said the following:
“Take a look at Eq. (4). There’s how the sea surface ‘LW flux’ is ‘measured’, Phil.Not in any other way. All you basically need to measure is the surface temperature. Then you simply put this into the S-B equation. And voilà! This is how it’s always done.
When I pointed out to you that that was not what they had done in the paper, they had in fact measured it using a radiometer you changed your tune. Then you said:
“The Kipp-Zonen net radiometer detect the NET RADIATION (that is, the HEAT FLUX), Phil, and then it has it built in to CALCULATE the DWLWIR ‘flux’ from this and the surface temperature. Simply subtract the computed UWLWIR from the measured heat flux (see Eq. (2)). And voilà! This is invariably how it’s done,
This of course is not how it’s done and Eq. (2) was in fact a means of estimating the LW emitted by the atmosphere and had nothing to do with the measurements made using the radiometer at all!
I then pointed out that you still had not gotten it right:
Phil., December 20, 2014 at 9:00 pm:
“You have this completely backwards, the K-Z radiometer has both an upward and downward pointing sensor which independently measure the LWup and LWdown. This is how it is done not by the computational method which you have invented. It is you who is ‘refusing to realize it, to take it in’.”
To which you replied:
Hahaha, so Phil here doesn’t even know how pyrgeometers work.
So you went from categorically asserting that it was always done by measuring the surface temperature and pyrometers weren’t used to incorrectly describing describing how pyrometers work!
Then this nonsense:
That’s priceless. And still so cocksure. Like a true, clueless warmist. OF COURSE he believes, then, that a net radiometer would directly detect his imaginary UWLWIR and DWLWIR ‘fluxes’. No wonder. Newsflash, Phil. That’s exactly what they DON’T do. They COMPUTE them.
Which is of course incorrect, pyrometers measure the incoming heat flux with an offset due to the temperature of the sensor which is also measured, in the case of this instrument there are as I said two pyrometers, one pointing up and one pointing down. Thus the LWup and LWdown are independently measured and calibrated. It’s no more a computation than the altimeter in a plane needing to be offset by the local surface pressure is a computation, they’re both measurements.
Then we get your usual :
“This is invariably how it’s done. You’ll just have to live with it:”
Third time’s a charm I guess, after being wrong the first two times and being forced by me to actually learn how the measurements you initially denied were being made. So yes you’ll have to live with the fact that the measurements of the LW fluxes are measured as opposed to your assertion last week that:
“It’s been shown that the postulated BB emission flux from the surface is NOT measured in the sense of being ‘detected’. It is ONLY calculated by directly applying the Stefan-Boltzmann equation to the assumption that the surface is a thermally isolated, pure emitter (that is, in a purely radiative setting), which it is NOT”
Which has now been confirmed to have been incorrect.
Fascinating.
And pyrometers are used in regard to measuring the surface of the ocean?
Again, Phil, you’re obviously completely clueless on how pyrgeometers work, how they ‘measure’ UWLWIR and DWLWIR.
Kipp & Zonen provided the net radiometer used by the research team. And if you then go their website and read HOW the net radiometer works – by way of pyranometers (for SW) pyrgeometers (for LW) – and then move on to read about how the pyrgeometers actually function, you will find exactly what I’ve stated all along: They DETECT the ‘net radiation’ (the radiative heat flux to or from the sensor) and measure the sensor temperature and from this they COMPUTE the ‘hemifluxes’ from equations like the ones provided in Eq. (2) and (4) (they are however slightly different, because they include reflected flux). Yes, the instruments do the calculations before presenting the results. So you THINK you get ‘real’ detected values. You don’t.
Yes, Phil, I know exactly what is stated in the paper. It makes no difference. It doesn’t make the pyrgeometers detect any UWLWIR or DWLWIR ‘fluxes’. They always detect the HEAT FLUX only. This is a trivial point, Phil. Which I can no longer be bothered to make. Read up. And have a happy holiday!
Hmm, well I typed ‘pyrgeometers’ so I guess the spell checker didn’t like it, well spotted! (It just did it again!)
So in the above post all references to ‘pyrometers’ should be ‘pyrgeometers’.
No such infernal nuisance as a spell checker.
Kristian December 22, 2014 at 1:03 pm
Phil., December 22, 2014 at 11:42 am:
You don’t give up, do you, Phil?
You spout a constant stream of nonsense just to keep me busy it seems. Can’t possibly concede a single point, like a true dogma-driven warmest.
I’d concede a point if you got one right and I was wrong, so far that hasn’t happened. You however were wrong about how the LWup was measured in the paper you cited, claiming it was always calculated from the surface temperature, you were proven wrong on that but refuse to concede the point, instead made one incorrect statement after another.
Anyone would have realised long ago already that you simply don’t have a clue.
“It [the pure surface BB ‘flux’] leaves the earth’s surface as 395W/m^2 if the surface is at 289K, as I pointed out before some of it is absorbed by gases such as CO2, O3, CH4 etc.”
What you continue to ignore is that a ToA spectrum shows Earth’s final and total radiative heat flux to space, which is … 239 W/m^2. So your presented spectrum could NEVER add up to a 395 W/m^2 flux intensity.
Why ever not? Do you have any facts to back that up or is it another of your ridiculous assertions.
Here’s an example for you:
MODTRAN run with tropical atmosphere, no clouds or rain, surface temperature 299.7K
with 400ppm CO2, 1.7ppm CH4, 28ppb O3, and a water scale of 1.0.
Upward IR heat flux to space – 287.84 W/m^2
0 CO2 318.4 W/m^2
0 H2O 386.53 W/m^2
0 CH4 389.99 W/m^2
0 O3 397.52 W/m^2
And there’s still some N2O left.
You seem not to comprehend at all what we’re discussing here. That doesn’t prevent you from babbling on and on as if you did, does it?
The one who doesn’t comprehend and keeps babbling on regardless is you.
Sorry, that last post should rather look like this:
Phil., December 22, 2014 at 5:58 pm:
“I’d concede a point if you got one right and I was wrong, so far that hasn’t happened.”
It has happened. You’re simply not willing to realise it, Phil. I can’t help you there. I’m afraid you will have to grapple with your obviously severe case of cognitive dissonance yourself.
Point 1: Satellites in space and their instruments could and do not in any way detect a pure BB 289K surface IR emission flux of 395 W/m^2. (This remains a mere mathematical construct.) If anything, they detect Earth’s total radiative heat flux of 239 W/m^2 through the ToA to space.
Point 2: Net radiometers (pyrgeometers) detect the HEAT FLUX and sensor TEMPERATURE and from these COMPUTE the assumed UWLWIR and DWLWIR ‘fluxes’. This is a trivial point that can easily be verified by anyone who cares to read through the instructions on the operational setup of these instruments provided by the people who actually make them (like Kipp & Zonen).
“You however were wrong about how the LWup was measured in the paper you cited, claiming it was always calculated from the surface temperature, you were proven wrong on that but refuse to concede the point, instead made one incorrect statement after another.”
What specifically in this description (straight from Kipp & Zonen themselves) is it that you don’t get, Phil?
“A pyrgeometer provides a voltage that is proportional to the radiation exchange between the instrument and the sky (or ground) in its field of view. The detector signal output can be positive or negative.
For example, if the sky is colder than the pyrgeometer, the instrument radiates energy to the sky and the output is negative.
In order to calculate the incoming or outgoing FIR it is necessary to know the temperature of the instrument housing close to the detector and the data must be recorded simultaneously with the detector signal.”
Or in this, from wikipedia:
“The pyrgeometer’s thermopile detects the net radiation balance between the incoming and outgoing long wave radiation flux and converts it to a voltage according to the equation below:
E_net = U_emf / S
[E_net = radiative heat flux to/from sensor] (…)
To derive the absolute downward long wave flux, the temperature of the pyrgeometer has to be taken into account. It is measured using a temperature sensor inside the instrument, near the cold junctions of the thermopile. The pyrgeometer is considered to approximate a black body. Due to this it emits long wave radiation according to:
E_out = σT^4
[E_out = ‘UWLWIR’ from sensor] (…)
From the calculations above the incoming long wave radiation can be derived. This is usually done by rearranging the equations above to yield the so-called pyrgeometer equation by Albrecht and Cox:
E_in = U_emf / S + σT^4
[E_in = ‘DWLWIR’ to sensor] (…)
As a result, the detected voltage and instrument temperature yield the total global long wave downward radiation.”
“”What you continue to ignore is that a ToA spectrum shows Earth’s final and total radiative heat flux to space, which is … 239 W/m^2. So your presented spectrum could NEVER add up to a 395 W/m^2 flux intensity.”
Why ever not? Do you have any facts to back that up or is it another of your ridiculous assertions.”
Why ever not!? Just read the quote, Phil. Read what it says. Don’t act as though you don’t understand. Like a recalcitrant child. Why are you playing obtuse? A ToA spectrum is the flux through the top of the atmosphere. You do know that Earth’s final radiative flux to space through the ToA is at 239 W/m^2, don’t you? How could a sensor in space ever detect a surface IR ‘flux’ of 395 W/m^2 that as per the rGHE hypothesis is never even meant to reach space?
Are you just trolling, Phil? I have to ask.
“Here’s an example for you:”
MODTRAN is a purely radiative model, Phil. Based on the same flawed, purely radiative assumptions about how the atmosphere works as the rGHE hypothesis. You cannot measure a 395 W/m^2 IR flux from space, Phil. No matter how you twist and turn. You can only ever at best measure Earth’s 239 W/m^2 final flux. Ask any warmist about this and you’ll get the same answer!
“The one who doesn’t comprehend and keeps babbling on regardless is you.”
I don’t know what more to say, Phil. There is no talking to a person who so completely refuses to acknowledge even the most unequivocal evidence presented to him, documented right there in front of him, who refuses to read, refuses to listen, who just go lalalalalala, meticulously blotting any inconvenient fact out from his view and thought, simply because his dogmatic beliefs tell him that’s what he needs to do to keep his cognitive dissonance at bay. You’re a hopeless case, Phil.