![480px-Antarctica_6400px_from_Blue_Marble[1]](http://wattsupwiththat.files.wordpress.com/2014/05/480px-antarctica_6400px_from_blue_marble1.jpg?quality=83) From Geophysical Research Letters and the University of Leeds:
From Geophysical Research Letters and the University of Leeds:
Three years of observations show that the Antarctic ice sheet is now losing 159 billion tonnes of ice each year — twice as much as when it was last surveyed. See below for some sanity check calculations on why 159 billion tonnes really isn’t much more than a flyspeck in the scheme of things.
===========================================
Antarctica’s ice losses on the rise
Three years of observations show that the Antarctic ice sheet is now losing 159 billion tonnes of ice each year – twice as much as when it was last surveyed.
A team of scientists from the UK Centre for Polar Observation and Modelling, led by researchers at the University of Leeds, have produced the first complete assessment of Antarctic ice sheet elevation change.
They used measurements collected by the European Space Agency’s CryoSat-2 satellite mission, which carries an altimeter specially designed for this task.
In sharp contrast to past altimeter missions, CryoSat-2 surveys virtually all the Antarctic continent, reaching to within 215 kilometres of the South Pole and leading to a fivefold increase in the sampling of coastal regions where today’s ice losses are concentrated.
Overall, the pattern of imbalance continues to be dominated by glaciers thinning in the Amundsen Sea sector of West Antarctica.
However, thanks to the improved capabilities of CryoSat-2, problem areas such as the rugged terrain of the Antarctic Peninsula can now also be surveyed.
On average West Antarctica lost 134 gigatonnes of ice, East Antarctica three gigatonnes, and the Antarctic Peninsula 23 gigatonnes in each year between 2010 and 2013 – a total loss of 159 gigatonnes each year.
The polar ice sheets are a major contributor to global sea level rise and, when combined, the Antarctic losses detected by CryoSat-2 are enough to raise global sea levels by 0.45 millimetres each year alone.
In West Antarctica, ice thinning has been detected in areas that were poorly surveyed by past satellite altimeter missions.
These newly-mapped areas contribute additional losses that bring altimeter observations closer to estimates based on other approaches.
But the average rate of ice thinning in West Antarctica has also increased, and this sector is now losing almost one third (31%) as much ice each year than it did during the five year period (2005-2010) prior to CryoSat-2’s launch.
Lead author Dr Malcolm McMillan from the University of Leeds said: “We find that ice losses continue to be most pronounced along the fast-flowing ice streams of the Amundsen Sea sector, with thinning rates of between 4 and 8 metres per year near to the grounding lines of the Pine Island, Thwaites and Smith Glaciers.”
This sector of Antarctica has long been identified as the most vulnerable to changes in climate and, according to recent assessments, its glaciers may have passed a point of irreversible retreat.
Launched in 2010, CryoSat carries a radar altimeter that can ‘see’ through clouds and in the dark, providing continuous measurements over areas like Antarctica that are prone to bad weather and long periods of darkness.
The radar can measure the surface height variation of ice in fine detail, allowing scientists to record changes in its volume with unprecedented accuracy.
Professor Andrew Shepherd, also of the University of Leeds, who led the study, said: “Thanks to its novel instrument design and to its near-polar orbit, CryoSat allows us to survey coastal and high-latitude regions of Antarctica that were beyond the capability of past altimeter missions, and it seems that these regions are crucial for determining the overall imbalance.”
“Although we are fortunate to now have, in CryoSat-2, a routine capability to monitor the polar ice sheets, the increased thinning we have detected in West Antarctica is a worrying development. It adds concrete evidence that dramatic changes are underway in this part of our planet, which has enough ice to raise global sea levels by more than a metre. The challenge is to use this evidence to test and improve the predictive skill of climate models.”
Professor David Vaughan of the British Antarctic Survey said: “The increasing contribution of Antarctica to sea-level rise is a global issue, and we need to use every technique available to understand where and how much ice is being lost. Through some very clever technical improvements, McMillan and his colleagues have produced the best maps of Antarctic ice-loss we have ever had. Prediction of the rate of future global sea-level rise must be begin with a thorough understanding of current changes in the ice sheets – this study puts us exactly where we need to be.”
Dr Ian Joughin at the University of Washington, author of a recent study simulating future Antarctic ice sheet losses added: “This study does a nice job of revealing the strong thinning along the Amundsen Coast, which is consistent with theory and models indicating this region is in the early stages of collapse.”
The findings from a team of UK researchers at the NERC Centre for Polar Observation and Modelling, are published in the journal Geophysical Research Letters. Professor Vaughan and Dr Joughin were not involved in the study.
Sanity Check:
From Climatesanity: Conversion factors for ice and water mass and volume
If one cubic kilometer of water (i.e., one gigatonne of water) is spread evenly over the entire 361 million square kilomters, the thickness of the new layer of water will be given by:
1 km³ / 361 x 106 km² = 2.78 x 10⁻⁶ meters = 2.78 microns.
Or, in terms of gigatonnes:
1 Gt x (1 km³/Gt) / 361 x 106 km² = 2.78 x 10⁻⁶ meters = 2.78 microns / Gt
That is, one cubic kilometer of water (i.e., one gigatonne of water) will add less than 3 millionths of a meter to the oceans!
From the press release, we are seeing about 159 billion tons/year of ice converted to meltwater (unless it sublimates), so the effect on sea level would be 159/1000 or 0.159 159 x 3 millionths of a meter, or 477 millionths of meter of sea level rise per year from this. (or in other words 0.47 mm which works out to 47mm/century or ~1.85 inches/century)
For another perspective, a gigatonne of water is approximately one cubic kilometer. Frozen as ice, it would be expanded slightly, but for the purposes of perspective lets just say that is negligible. So, the ice loss per year would be 0.159 cubic kilometers.
According to the British Antarctic Survey BEDMAP2 project:
The derived statistics for Bedmap2 show that the volume of ice contained in the Antarctic ice sheet [is] 27 million km3…
Source: http://www.antarctica.ac.uk/bas_research/our_research/az/bedmap2/index.php
And thanks to those helpful kidz at “Skeptical Science”, we have this graphic depicting a cubic kilometer of ice. John Cook writes in 2010:
A visual depiction of how much ice Greenland is losing
One gigatonne is one billion tonnes. To get a picture of how large this is, imagine a block of ice one kilometre high by one kilometer wide by one kilometre deep (okay, the edges are actually 1055 metres long as ice is slightly less dense than water but you get the idea). Borrowing from alien invasion movies, the scale is well illustrated by comparing a gigatonne block of ice to a famous, historical landmark like the Empire State Building:
![empire_state1[1]](http://wattsupwiththat.files.wordpress.com/2014/05/empire_state11.jpg?quality=83)
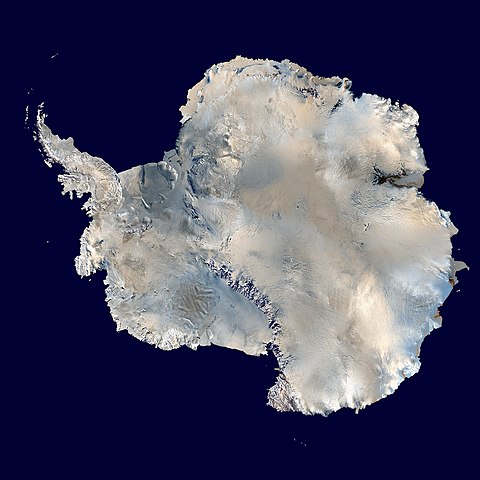
OK there are 14 million square kilometers of ice surface in Antarctica, not counting sea-ice. See if you can spot the tops of the 159 of these square kilometer ice blocks from this satellite view
Now imagine just 0.159 159 of those 1 cubic kilometer ice blocks missing each year. Scary, huh? Damian Carrington at the Guardian thinks so:

And so, the loss of 0.159 159 cubic kilometers of ice per year is apparently headline worthy, because at that rate of loss, it would take 169,811 years to lose all the 27 million cubic kilometers of Antarctic ice.
I’m pretty sure we’ll have gone through a few ice ages by then.
(Update: I made an error in the initial post with units, where I conflated kiloton/gigaton in one step, fixed)
The massive East Antarctic Ice Sheet stopped retreating about 3000 years ago. Whether it has gained mass since then or not, it may well have quit rebounding from its losses after the end of the Last Glacial Maximum, c. 18,000 years ago.
West Antarctica might still be rebounding, however:
http://phys.org/news/2013-09-antarctic-ice-sheet.html
An alternate view: while we hear considerably about isostatic rebound, there is also isotatic adjustment to loading. The Antarctic has been seeing steady increases in sea-ice for several years. If those were matched by increasing accumulations on the in the interior ice sheets, how rapidly would isostatic adjustment to increasing ice load result in lowering altitudes? Also, even without considering isostatic changes in the underlying rock, what effects would increasing load have on the crystalline structure of ice itself. I do know that increasing ice flow is likely to be due to loading because ice melting is correlated to retreats. Since the ice around Antarctica is advancing, if we accept increasing sea ice, then alternate hypotheses might be in order, to explain the altimeter data square kilometers, or (since 1 square kilometer has
  square meters)
  square meters. A loss of
  cubic meters — the assertion of the top article — is thus roughly 1 cm/year if removed from the entire continental ice sheet.
It really needs to be a mix of altimeter and gravitational data, because ice/snow mixes can compactify, shrink in height, and not lose a whit of mass. Note that the surface area of Antarctica is
Of course, it is very unlikely that the satellite is going to be accurate to 1 cm. Very, very unlikely. Simply locating the satellite in 3 dimensions relative to the center of mass of the Earth is very likely not this accurate, and the effects of tidal forces and orbital paths over gravitational anomalies is very likely sufficient to make its absolute location in its orbit uncertain to order of meters. Bouncing radio signals through an atmosphere of variable and unknown index of refraction can introduce a further error of order meters. Even if they use extraordinary means to control these errors — both present in the usual estimates of uncertainty in position for/from e.g. GPS satellites — doesn’t seem likely to reduce the errors to less than order of tens of centimeters. And unless the measurements are correlated with same-location same-time GRACE measurements, reflection measurements of surface height (averaged over an enormous range, with rather large sources of measurement error as in hitting a hilltop on one pass and a valley on another) won’t tell you if you are measuring actual melt or sublimation or compactification. And even that won’t tell you if the actual ice is melting or sublimating (or where the water is going if it is melting) or if the subsidence is due to subsidence of the underlying land, which is surely proceeding at some rate given the enormous loading of Antarctica with kilometer-thick ice.
That is, I mostly agree with you. SLR and isostatic changes in the Earth’s rather plastic “surface” relative to some imaginary surface of perfect rotational-gravitational equilibrium is one of the most difficult chores we attempt, requiring a truly precise knowledge of gravitation, local coriolis force, and a fair bit of the dynamics of the underlying crust and mantel. It is also slow, constantly responding to stresses laid down thousands of years ago. Much of the planetary surface is still reacting to the ice melt at the start of the Holocene and the resulting substantial rearrangment of the “isostatic” mass distribution that had prevailed over the previous 90,000 years. Other parts are responding to more local changes in internal magma flow, movement of the tectonic plates. It isn’t all that implausible that part of Antarctica is melting/compressing/subsiding at some rate (with a largely unknown split). It isn’t implausible that it is mass is growing at other places, even if the surface is not changing by enough to be detectable. To put it another way, even if a comparatively small part of the continent is losing mass at 160 Gt/year and all of that mass is going into the ocean, the rest of the continent could be gaining mass at that rate and it would probably not be detectable, the rate of growth of order a centimeter a year that could be entirely eaten by compactification and subsidence of the continent to keep the surface itself nearly unchanging in some sort of “imaginary” height above the imaginary isostatic surface.
rgb
rgbatduke says:
May 21, 2014 at 10:55 am
Excellent summary of problems with altimetry, but consider also what the admittedly not highly accurate satellite did find:
“On average West Antarctica lost 134 gigatonnes of ice, East Antarctica three gigatonnes, and the Antarctic Peninsula 23 gigatonnes in each year between 2010 and 2013 – a total loss of 159 gigatonnes each year.”
That is, of the alleged 159 GT per year, West Antarctica & the Peninsula lost 157 (rounding errors presumably account for the total of 160 rather than 159 GT). So even in the worst case, catastrophic sea level rise is ruled out, ie hundreds or tens of meters rather than meters over the next thousands of years.
Sorry but you f[****]d it up with not being able to handle magnitudes.
[Watch your language. .mod]
Has anyone answered how this claim squares with satellite reports of increasing sea ice extent?
There was a study in 2012 based on 67 ice cores. The study found an increase in Surface Mass Balance (SMB) over the last 50 years or so. This is accumulated snow and ice. Given the glaciers appear to have been grounded up until the last decade, that would indicate Antarctica should have an overall positive surplus of water sequestered. Hence, the current loss may simply return the situation to average.
Also, the recently discovered Hudson volcano is almost assuredly one of the reasons for the melting of the underwater portions of these glaciers. Based on its location the water melted near the volcano would flow right past the area with the most ice loss. Coincidence? I think not.
There is a difference in the measurement techniques of GRACE and CryoSat-2 that might be significant. GRACE tries to measure changes in the mass, CryoSat-2 actual changes in thickness, down to half an inch or 13mm. Where there are fast movements, like glaciers, these will easily be detected. Where there are small movements, like the small deposits new snow formation annually that form the ice-core samples, this would not be noticed. A single millimetre of ice spread of East Antarctica would be 10 gigatonnes. Where there is slow gain in the middle with lumps calving off at the edges this measurement bias can be significant.
A previous Sheppard paper published in Dec 2012 – A Reconciled Estimate of Ice-Sheet Mass Balance with about 50 others – corroborates this potential bias. Using the GRACE satellite data, estimated the ice melt estimated for the period 2005-2010 rates of change in gigatonnes of -36, +58, -102 respectively for the Peninsula, East and West Antarctica. Total ice loss of -81 was insignificantly different from the -71 for the period 1992-2011.
Also remember that 159 gigatonnes is tiny compared to the total ice cap. At that rate the entire ice cap will be gone in 150,000 to 200,000 years.
For these reasons, I would expect the next estimate in two or three years time to show a smaller ice loss, or even a net gain, assuming the actual reality does not change.
To gofigure560:
Two different things. The sea ice is floating ice around the Antarctic, which started
life on land. The tremendous weight of the ice sheet pushes it outward from the
continent and into the sea. What’s being talked about in this paper is the land-bound
ice. That’s supposedly decreasing, according to this paper, by a tiny percentage
per year. The two trends are broadly consistent–a slight warming might cause the
ice to move downward from the continental interior to the sea, and out to sea, a little
faster, thus causing the growth of the are that the sea ice covers.
My real problem is the size of the various effects that they have to subtract out
to get their final, relatively tiny, number.
@rgbatduke
May 21, 2014 at 5:49 am
The near surface warm bursts through the Arctic polar night are typically Humidity Events.
http://ocean.dmi.dk/arctic/plots/meanTarchive/meanT_2012.png
RE: rgbatduke says:
May 21, 2014 at 5:49 am
Splendid insights. Thanks.
A previous Sheppard paper published in Dec 2012 – A Reconciled Estimate of Ice-Sheet Mass Balance with about 50 others – corroborates this potential bias. Using the GRACE satellite data, estimated the ice melt estimated for the period 2005-2010 rates of change in gigatonnes of -36, +58, -102 respectively for the Peninsula, East and West Antarctica. Total ice loss of -81 was insignificantly different from the -71 for the period 1992-2011.
Thanks, that’s the reason I addressed GRACE, but I couldn’t remember the reference. The information on the satellite resolution is also useful, although I’m rather skeptical about any claimed ability to be able measure snow/ice height (and by inference, thickness) over a broad area to within 13 mm. Given the published resolution of absolute positioning systems — e.g. GPS — this small an error estimate seems as though it would have to rely on an assumption of systematic/consistent errors per orbital pass (the absolute error of the measuring satellite’s position is order of meters IIRC) and while the assumption might be true for short times, I don’t see how they could possibly rule out systematic drift over multiple orbits. Obviously they cannot make the measuring satellite geostationary in a polar position, and orbits pass over multiple gravitational gradients and are highly subject to all sorts of cumulative errors from “random” forces like solar wind and orbital/tidal resonances. This is the same sort of problem that I have with assertions of precision of hundredths of a degree or less in measurements of “deep ocean warming” from the merest handful of highly sparse samples given the enormous volume being measure, with instrumentation that itself tends to drift and experience electronic and thermal errors that may or may not be independently biased.
My guess is that the satellite altimetry data is not, in fact anywhere close to “accurate to a centimeter”. GRACE however, I’m a bit more willing to believe although God knows that’s an amazingly difficult measurement too. At least there they can calibrate over known/expected mass variations, though, and they are trying to measure an absolute quantity, not a delta, across the same range.
I might be convinced otherwise, but in the meantime I remain skeptical.
rgb
The water will lubricate the collapse of the East Antarctica Ice Cap into the ocean, which will exacerbate the excess reflection of solar heat into space, which will result in Snowball Earth. Sometime between 2020 and 5020 is a best guess.
edit: exacerbate the current sea ice’s excess reflection …