FIRST CLIMATE MODELS HAVE TO BE ABLE TO SIMULATE EL NIÑO AND LA NIÑA PROCESSES—CAPABILITIES THEY CONTINUE TO LACK AFTER DECADES OF MODELING EFFORTS (PERSONALLY, I DON’T THINK THE MODELERS ARE REALLY TRYING)
BBCNews published an article yesterday by Matt McGrath “Global warming will increase intensity of El Nino, scientists say.” The article includes the usual phraseology:
Now, in this new paper, published in the journal Nature, researchers give their most “robust” projections yet.
And there’s the obligatory quote from an “uninvolved” third party, who just happens to work for the same organization as the authors:
According to Dr Wenju Cai, a scientist at the Commonwealth Scientific and Industrial Research Organisation (CSIRO), who was not involved with the study, the paper is “significant”.
Does significant mean the study will make a loud noise when we throw it into the dustbin?
You’ll likely choose to immediately dismiss the paper based on the following sentence in the BBCNews article:
Using the latest generation of climate models, they found a consistent projection for the future of ENSO.
Climate models can’t simulate the vast majority of the fundamental coupled ocean-atmosphere processes that drive El Niño and La Niña events. That is, the past (CMIP3) and current (CMIP5) generations of climate models create virtual El Niños and La Niñas that bear little resemblance to those that occur in the real Pacific Ocean.
The paper being discussed is Power et al. (2013) Robust twenty-first-century projections of El Niño and related precipitation variability. The abstract reads:
The El Niño–Southern Oscillation (ENSO) drives substantial variability in rainfall, severe weather, agricultural production, ecosystems and diseasein many parts of the world. Given that further human-forced changes in the Earth’s climate system seem inevitable, the possibility exists that the character of ENSO and its impacts might change over the coming century. Although this issue has been investigated many times during the past 20 years, there is very little consensus on future changes in ENSO, apart from an expectation that ENSO will continue to be a dominant source of year-to-year variability. Here we show that there are in fact robust projected changes in the spatial patterns of year-to-year ENSO-driven variability in both surface temperature and precipitation. These changes are evident in the two most recent generations of climate models, using four different scenarios for CO2 and other radiatively active gases. By the mid- to late twenty-first century, the projections include an intensification of both El-Niño-driven drying in the western Pacific Ocean and rainfall increases in the central and eastern equatorial Pacific. Experiments with an Atmospheric General Circulation Model reveal that robust projected changes in precipitation anomalies during El Niño years are primarily determined by a nonlinear response to surface global warming. Uncertain projected changes in the amplitude of ENSO-driven surface temperature variability have only a secondary role. Projected changes in key characteristics of ENSO are consequently much clearer than previously realized.
So the key finding is:
By the mid- to late twenty-first century, the projections include an intensification of both El-Niño-driven drying in the western Pacific Ocean and rainfall increases in the central and eastern equatorial Pacific.
According to Power et al (2013), the climate models simulate at least one portion of El Niño-Southern Oscillation (ENSO) processes properly. In order for you to understand why, during an El Niño, precipitation increases in the central and eastern tropical Pacific and decreases in the west, we need to discuss a few fundamentals. Don’t worry. There’s nothing difficult about it. Precipitation just tags along with the warm water.
ENSO BASICS 101:
Under normal conditions in the tropical Pacific, there is a trade wind-created pool of warm water in the western tropical Pacific (called the West Pacific Warm Pool). That sunlight-fueled pool of warm water can extend to depths of 300 meters and cover an area the size of Russia or twice the size of the U.S. In other words, there can be a monumental amount of sunlight-created warm water in the western tropical Pacific from time to time. Because the water there is naturally so much warmer than other locations, a lot of evaporation and precipitation takes place at the West Pacific Warm Pool.
During an El Niño, the warm water from the surface and below the surface of the western tropical Pacific floods into the central and eastern tropical Pacific and spreads across its surface. The warm water is focused primarily along the equator (brought there by a prolonged surge in the flow of the equatorial countercurrent, which travels from west to east).
Because the warm water has traveled into the central and eastern tropical Pacific during the El Niño, that causes that the evaporation, cloud cover and precipitation that is normally in the western tropical Pacific to accompany the warm water eastward.
Logically, precipitation increases in the eastern tropical Pacific and decreases in the western tropical Pacific during an El Niño. So the models, according to Power et al. (2013) appear to simulate that basic relationship.
DATA CONTRADICT MODELS
In order for there to be “an intensification of both El-Niño-driven drying in the western Pacific Ocean and rainfall increases in the central and eastern equatorial Pacific” in the future, as claimed by Power et al. (2013), El Niño events have to become stronger, or last longer, or occur more often, or a combination of the three, in their number-crunched, CO2-driven, climate model-based virtual worlds. The other possibility: there has to be a global warming-caused change in the background state of the tropical Pacific in the models.
However, Ray & Giese (2012) Historical changes in El Niño and La Niña characteristics in an ocean reanalysis found that El Niño events had not become stronger, or lasted longer, or occurred more often (among other things) since 1871. And manmade greenhouse gases are said to have caused global warming during that time period. The Ray & Giese (2012) abstract ends:
Overall, there is no evidence that there are changes in the strength, frequency, duration, location or direction of propagation of El Niño and La Niña anomalies caused by global warming during the period from 1871 to 2008.
So one wonders how climate models could simulate a future change in ENSO when there have been no changes in almost 140 years.
With respect to the background state of tropical Pacific, let’s look at the modeled and observed warming (and cooling) rates of the sea surface temperatures of the Pacific Ocean during the satellite era (basically 1982 to present). The following two illustrations are from my book Climate Models Fail. I’ve thrown a few notes on them for this blog post, simply to point out the locations of the tropical Pacific and the equator for the climate modelers. The data are NOAA’s satellite-enhanced optimum interpolation sea surface temperature dataset, Reynolds OI.v2. The models are represented by the average of all of the simulations (model runs) from the climate models stored in the CMIP5 archive–those that provided simulations of sea surface temperatures. (The CMIP5 archive was prepared for and used by the IPCC for their 5th Assessment Report.) We use the multi-model mean because it best represents how climate models indicate the sea surface temperatures should have (would have, could have) warmed in response to human-induced global warming. (For further information, see the blog post On the Use of the Multi-Model Mean.) The forcings that drive the models are a mix of historic though 2005 and RCP6.0 afterwards.
Figure 7-29 is a graph that presents the sea surface temperature trends for the Pacific Ocean on a zonal-means basis. (Zonal means is another way of saying latitude average.) The vertical axis (y-axis) is scaled in deg C/decade. In other words, the positive numbers indicate rates at which the sea surface temperatures warmed and the negative numbers indicate cooling rates. The horizontal axis (x-axis) is latitude, with 90S (-90) the South Pole, “zero” (0) the equator, and 90N (90) the North Pole. El Niño and La Niña events occur in the tropical Pacific but are focused along the equator. So let’s look at the trends at the equator. The climate models indicate that if (big if) the sea surface temperatures of the equatorial Pacific were warmed by manmade greenhouse gases, the sea surface temperatures there should have warmed at a rate of about 0.2 deg C/decade…or more than 0.6 deg C over the past 3+ decades. But, the data indicate the sea surface temperatures of the equatorial Pacific actually COOLED over the past 31 years. Overall, there are few to no similarities between how data indicate the Pacific actually warmed over the past 30 years and how the models indicate they shoulda’, woulda’, coulda’ warmed in response to the increased emissions of manmade carbon dioxide.

Figure 7-30 presents maps of the modeled and observed rates of warming and cooling in the Pacific for the same basic period (1982 to 2012), using the same dataset and model mean as in Figure 7-29. There are no similarities between how the sea surface temperatures of the Pacific Ocean actually warmed over the past 3+ decades and how the models indicate they should have warmed, if they were warmed by manmade greenhouse gases.

Note: The observed “C-shaped” warming pattern in the Pacific (right-hand cell of Figure 7-30) is one associated with a period when strong, naturally occurring, El Niño events released vast amounts of naturally created warm water from below the surface of the tropical Pacific, which was then subsequently redistributed after the El Niños into the western Pacific Ocean (and East Indian Ocean, not illustrated) by ocean currents. The warm water “collects” in the region east of Japan referred to as the Kuroshio-Oyashio Extension (KOE) and in the region east of Australia and New Zealand called the South Pacific Convergence Zone (SPCZ). The modelers obviously missed the naturally occurring spatial pattern of warming that takes place in the Pacific Ocean. That’s an important climate model failing for a simple reason: how, when, and where the oceans warm and cool dictate in part how, when and where land surface air temperatures warm and cool.
PEER-REVIEWED PAPERS ABOUT HOW POORLY CLIMATE MODELS SIMULATE EL NIÑO- AND LA NIÑA-RELATED PROCESSES
Power et al. (2013) cited Guilyardi et al. (2009), which is a paper I have referred to numerous times in blog posts (example here). Did Power et al. (2013) overlook one of the critical findings of Guilyardi et al. (2009)?:
Because ENSO is the dominant mode of climate variability at interannual time scales, the lack of consistency in the model predictions of the response of ENSO to global warming currently limits our confidence in using these predictions to address adaptive societal concerns, such as regional impacts or extremes.
In other words, because climate models cannot accurately simulate El Niño and La Niña processes, the authors of Guilyardi et al. (2009) have little confidence in climate model projections of regional climate or of extreme events.
Bellenger, et al. (2013) “ENSO Representation in Climate Models: From CMIP3 to CMIP5,” is a more recent confirmation of how poorly climate models simulate El Niños and La Niñas. (Preprint copy is here.) The section titled “Discussion and Perspectives” begins:
Much development work for modeling group is still needed in order to correctly represent ENSO, its basic characteristics (amplitude, evolution, timescale, seasonal phaselock…) and fundamental processes such as the Bjerknes and surface fluxes feedbacks.
- “Amplitude” refers to the strengths of ENSO events.
- “Evolution” refers to the formation of El Niños and La Niñas and the processes that take place as the events are forming.
- “Timescale” can refer to both the how long ENSO events last and how often they occur.
- “Phaselock” refers to the fact that El Niño and La Niña events are tied to the seasonal cycle. They peak in the boreal winter.
- “Bjerknes feedback,” very basically, means how the tropical Pacific and the atmosphere above it are coupled; i.e., they are interdependent, a change in one causes a change in the other and they provide positive feedback to one another. The existence of this positive “Bjerknes feedback” suggests that El Niño and La Niña events will remain in one mode until something interrupts the positive feedback.
In short, according to Bellenger, et al. (2013), the current generation of climate models (CMIP5: used by the IPCC for their 5th Assessment Report and by Power et al (2013)) still cannot simulate basic coupled ocean-atmosphere processes associated with El Niño and La Niña events–basic processes.
Power et al (2013) must have really had to search through the climate model simulations to find some ENSO-related response that appeared to mimic reality.
THE TAIL WAGGING THE DOG
I was alerted to the BBCNews article and the paper by blogger mwhite in a comment this morning. (Thanks, mwhite.) mwhite’s note “The tail wags the dog???” refers to the fact that satellite-era sea surface temperature records indicate strong El Niño events are responsible for the warming of global sea surface temperatures over the past 3 decades, not manmade greenhouse gases. And ocean heat content records indicate the warm waters that fuel El Niño events were created during La Niña events—a process that is driven by sunlight, not greenhouse gases. So mwhite was asking rhetorically whether Power et al. (2013) had confused cause and effect.
If the subject of the natural warming of the global oceans is new to you, refer to my illustrated essay “The Manmade Global Warming Challenge”(42MB). The way data portrays how the oceans warmed may come as a surprise to you, especially with all we’ve been told about human-induced global warming. If you like audio-video presentations, see my two-part YouTube video series “The Natural Warming of the Global Oceans”. Part 1 is here and Part 2 is here.
WANT TO LEARN MORE ABOUT CLIMATE MODEL FAILINGS AND ABOUT EL NIÑO AND LA NIÑA EVENTS AND HOW THEY PROVIDE LONG-TERM GLOBAL WARMING?
Last year I published the ebook Who Turned on the Heat? It explained in minute detail (and in easy-to-understand ways for those without technical or scientific backgrounds) the processes that drive El Niño and La Niña events and how they contributed to the long-term warming of the global oceans. (Who Turned on the Heat? continues to sell quite well.)
However, before you click on the following links to Who Turned on the Heat? I also addressed the subject of the natural warming of the global oceans in Section 9 of my new book Climate Models Fail, but not in as much detail as in Who Turned on the Heat?
I have been publishing comparisons of data with climate models outputs for about two years. The climate models used by the IPCC clearly cannot simulate Earth’s surface temperatures, precipitation or sea ice area. Additionally, there are numerous scientific research papers that are very critical of how climate models perform specific functions. The following lists the processes that CLIMATE MODELS STILL SIMULATE POORLY:
- The coupled ocean-atmosphere processes of El Niño and La Niña, the largest contributors to natural variations in global temperature and precipitation on annual, multiyear, and decadal timescales.
- Responses to volcanic eruptions, which can be so powerful that they can even counteract the effects of strong El Niño events.
- Precipitation — globally or regionally — including monsoons.
- Cloud cover.
- Sea surface temperatures.
- Global surface temperatures.
- Sea ice extent.
- Teleconnections, the mechanisms by which a change in a variable in one region of the globe causes a change in another region, even though those regions may be separated by thousands of kilometers.
- Blocking, which is associated with heat waves.
- The influence of El Niños on hurricanes.
- The coupled ocean-atmosphere processes associated with decadal and multidecadal variations in sea surface temperatures, which strongly impact land surface temperatures and precipitation on those same timescales.
Looking at those papers independently, the faults do not appear too bad, but collectively they indicate the models are fatally flawed.
In my book Climate Models Fail, I have collected my past findings about climate models, and illustrated others, and I’ve presented highlights from the research papers critical of climate models—and I “translated” those research findings for persons without scientific or technical backgrounds. And as noted earlier, there is also a discussion of the natural warming of the global oceans. The free preview of Climate Models Fail is available here. It includes the Introduction, Table of Contents and the Closing. Climate Models Fail is available in pdf and Kindle formats. Refer to my blog post New Book: “Climate Models Fail” for further information, the synopsis from the Kindle webpage and purchase/download links.
Back to Who Turned on the Heat?: It is only available in .pdf form. A preview is here. Who Turned on the Heat? is described further in, and is available for sale through, my blog post “Everything You Ever Wanted to Know About El Niño and La Niña”.
CLOSING
It seems as though Power et al. (2013) went in search of some small portion, any small portion, of ENSO that climate models appeared to simulate correctly and then published the typical climate science paper that generates alarmist nonsense in newspaper articles.
When data contradict models in most scientific and engineering endeavors, the modelers rework the models. Not in climate science. In climate science, the climate scientists/modelers simply proclaim the findings of the fatally flawed models more often and with greater certainty, without revealing the model flaws. (Thus, the IPCC’s 5th Assessment Report.)
I listened to the announcement of this yesterday here in Oz on the good old AB friggin’ C as we often refer to it , our climate change crazy national broadcaster and when it became clear that it was just another “modelling” exercise I switched off. On their performance to date if you tweak the model parameters enough and they will predict the end of the world if a dugong farts.
Nothing to see here folks, just some more scientists reporting on their research, sorry modelling game playing, funded by the previous climate crazy Australian “Government”
This paper from way back in 2004 shows ENSO associated with D-O cycles in the North Atlantic record. I’ll also link it in reference to my discussion with Dr. S. about the reality of D-O & Bond cycles. Don’t know if it’s acceptable to post the same reference under two different active blog topics:
http://www.nature.com/nature/journal/v428/n6980/abs/nature02386.html
The El Niño/Southern Oscillation (ENSO) phenomenon is believed to have operated continuously over the last glacial–interglacial cycle1. ENSO variability has been suggested to be linked to millennial-scale oscillations in North Atlantic climate during that time2, 3, but the proposals disagree on whether increased frequency of El Niño events, the warm phase of ENSO, was linked to North Atlantic warm or cold periods. Here we present a high-resolution record of surface moisture, based on the degree of peat humification and the ratio of sedges to grass, from northern Queensland, Australia, covering the past 45,000 yr. We observe millennial-scale dry periods, indicating periods of frequent El Niño events (summer precipitation declines in El Niño years in northeastern Australia). We find that these dry periods are correlated to the Dansgaard–Oeschger events—millennial-scale warm events in the North Atlantic climate record—although no direct atmospheric connection from the North Atlantic to our site can be invoked. Additionally, we find climatic cycles at a semiprecessional timescale (approx11,900 yr). We suggest that climate variations in the tropical Pacific Ocean on millennial as well as orbital timescales, which determined precipitation in northeastern Australia, also exerted an influence on North Atlantic climate through atmospheric and oceanic teleconnections.
When they stop doing “projections” and are confident enough to do “predictions” I’ll take some notice.
Without even looking at the paper you could take a good bet on two things , the word ‘may ‘ will appear a lot and they will have given themselves a get-out should their claims fail. Either via a long time line or by sticking in a ‘however’
Its an approach that makes for good politics and OK religion, but its poor science . So standard for climate ‘science’
The ENSO has no trend over time.
It is one of the few places in the oceans (or anywhere for that matter) which exhibits Zero trend and which has these wild, but still lasting for months at a time, swings.
So far in the last 159 years, increased CO2 has had absolutely Zero impact on this most important weather phenomenon on the planet. A person would have been truly committed to an unlikely theory to bet against that trend.
History of Nino 3.4 in four different datasets back to 1854.
http://s18.postimg.org/r0a6j7mi1/History_of_the_ENSO.png
Bill;
Very interesting graph; thx.
Pippen Kool says: “I see no evidence that Tisdale has read anything more than the abstract to the paper. Does he know what’s in it?”
And I see no evidence that the new troll Pippen Kool read my blog post. “Does he know what’s in it?” If Pippin Kool read it, does Pippin Kool understand it?
Power et al (2013) performed an EOF/PC analysis of precipitation using the multi-model means of different scenarios (CMIP5 models). Power et al (2013) happened to find that the modeled 1st EOF presentation of tropical Pacific precipitation was a reasonable facsimile of observations and assumed the model 21st Century projections of precipitation would then be relevant.
Unfortunately for Power et al (2013), Pippin Kool, ENSO is a coupled ocean-atmosphere process, meaning that sea surface temperatures, cloud cover, precipitation, trade wind strength and direction, etc., are all interdependent. If by happenstance the models get one portion right (as Power et al (2013) found) without getting other portions correct (and we know the models do not simulate them correctly), then the portion the models got correct has no basis in reality.
Is that clear enough or would you like me to expand on the explanation?
Have a nice day, Pippen Kool.
Bill Illis says: “The ENSO has no trend over time.”
At all times other than El Nino events, the eastern and central Pacific are supplied by cool (upwelled) subsurface waters. The fact that NINO3.4 sea surface temperatures show no long-term trend suggests that the temperature of the subsurface waters there have no long-term trend.
Regards
Thanks for another great post Bob.
The tali wagging the dog was my instant reaction to the paper. These researchers would do well to buy your ebooks.
That steady cold upwelled tongue comes from the circumpolar current, yes? It is one of the most dependable currents we have. The Humboldt current breaks away from the circumpolar prior to Drake’s Passage and travels up the coast of Peru, to emerge at the far eastern equatorial Pacific, providing a steady source of temperature as it mixes with surface water. No wonder there is no trend there.
It is totally unscientific to use the word “robust” when describing a guess into the future.
The phrase “….that further human-forced changes in the Earth’s climate system seem inevitable…..”
requires qualification. It might be a correct phrase if one includes common-sense tiny changes, but when considering significant, large changes, then a quantitative, accepted equation linking the effect of man to the change in climate is a minimal requirement. This is not new news. It is the same old assertion that man-made GHG cause a substantial temperature increase. This has NOT been shown.
ColdinOz says: “These researchers would do well to buy your ebooks.”
Thanks and thanks for reminding me, ColdinOz.
MANY THANKS TO ALL WHO PURCASED COPIES OF MY BOOKS AS A RESULT OF THIS POST AND TO THOSE WHO PURCHASED THEM FROM OTHERS!
Regards
Pamela Gray says: “That steady cold upwelled tongue comes from the circumpolar current, yes?”
Part of the surface waters could be traced back to the Antarctic Circumpolar Current (ACC), Pamela, as you noted, through the Humboldt Current (and the Peru‐Chile Undercurrent), but there are all sorts of subsurface currents at or near the equatorial Pacific.
http://www.imarpe.pe/imarpe/imagenes/portal/imarpe/CIMOBP/jgr-115-1-montes-2010.pdf
Regards
Thinking out loud: The Humboldt current makes a sharp equatorial turn left and heads towards Japan, mixing and warming along the way. When the wind blows and sends the surface waters west, it uncovers the deeper portion of the Humboldt current, causing us to call it by another name, La Nina. Maybe it should just be called the cold naked Humboldt current instead of La Nina, having had its coat blown off by the wind. On the flip side, when the wind stalls long enough, this cold tongue goes into hiding, not wanting to rise to the surface much at all. When it doesn’t, it also fails to gouge out nutrients that it brings to the surface under normal conditions. El Nino’s calm devastates coastal fisheries, sending marine life elsewhere for food.
http://www.scienceandthesea.org/index.php?option=com_content&task=view&id=265&Itemid=10
Pamela,
I suspect the topography of the ocean floor also contributes to the upwelling off the coast of Peru. Eddies from the conveyor belt could be bringing up all those minerals (and CO2) from the cold deep.
of course, GW will. And, GW will go on increasing with urbanization, deforestation and expanding deserts.
MattN says:
October 15, 2013 at 9:53 am
Gavin at RC has already gone on record several years ago that global warming is not only causing more El Ninos, but likely would prevent the PDO from ever shifting negative again. I wish I could find that post…
Please do. I’ve learned it is dangerous to trust my memory regarding what someone once posted somewhere.
—————-
Can’t find it. It was way back, maybe 2005ish. I imagine he made that entry disappear once it was obvious it was wrong.
Bob Tisdale says: “And I see no evidence that the new troll Pippen Kool read my blog post.”
Most unfortunately I did. Quite a waste of time. Actually, I did read the original paper. Quite good, actually.
Look, you cant sit a say a paper is trash without looking at the data. As far as I can see, you are trashing it based on your idea of your own idea first principles.
I still don’t think you have read or understood the paper; you have not addressed a single figure of the paper.
So, I think you need to up your game. Because the ‘you can trust me dialogue’ only works with people like richardscourtney who don’t know enuf to know better.
At least Richard Black’s articles at the BBC sometimes allowed comment, before he went off to save the oceans. Matt McGrath seems to have almost seamlessly fallen into the same groove. Curious.
Also, as Geoff Sherrington notes above, the word “robust” is often the inflammatory language that marks the fact that the inferences are likely anything but “robust”.
I am also allergic to language referring to “state-of-the-art” models.
Pippen Kool says:
October 15, 2013 at 5:51 pm
I’m pretty sure, Mr. Kool, that Mr. Courtney knows a lot more about relevant scientific subjects than you (whatever might be the gaps in his historical data base). Do you really want to go down the Yellow Brick credential comparison road, joining as Scarecrow the board’s own Tin Woodsman (fill in the blank) & Cowardly Lion Poptech?
Pippen Kool says: “Look, you cant sit a say a paper is trash without looking at the data.”

I have looked at the data and I’ve also examined the model outputs, Pippen Kool.
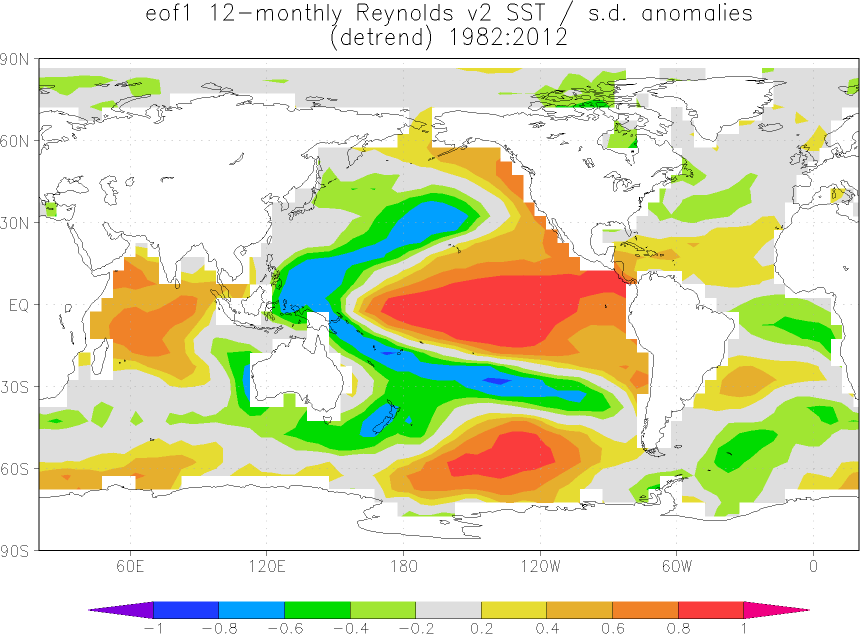
Do you see any similarity between the 1st EOF of sea surface temperatures in the tropical Pacific (1982-2012)…
…and the 1st EOF of the modeled sea surface temperatures of the tropical Pacific (1982-2012), or anywhere else for that matter :
Just because illustrations do not appear in one of my blog posts, Pippin Kool, it doesn’t mean I have not looked at the data or the model outputs.
Good-bye, troll.
Pippen Kool says:
Look, you cant sit a say a paper is trash without looking at the data. As far as I can see, you are trashing it based on your idea of your own idea first principles.
Take an aspirin and lie down. You’re babbling.
Cheers Tisdale:
So I am sorry, those aren’t figures from the paper. They actually aren’t even close. What is your point, really? Could you explain in English rathe than Tisdalize?
So I used to think to think you were clueless. Now I think different.
Climatologist@7:54 a.m.: That El Nino winter brought the Upper Great Lakes the warmest winter in history.
Pippen Kool says: “So I am sorry, those aren’t figures from the paper.”
Of course they aren’t. You continue to broadcast your lack of understanding of the subject matter. Go back and read my first reply to you. Then look at the maps I provided.
You’re wasting your time, and more important to me, you’re wasting mine. You have no wish to understand what’s being discussed. You’re simply arguing for argument sake. Not sure why. You’re not impressing anyone here with your compete lack of understanding of the topic at hand.
Good-bye
Pippen Kool says: “So I am sorry, those aren’t figures from the paper.”
Bob Tisdale says:”Of course they aren’t. You continue to broadcast your lack of understanding of the subject matter.”
Really? Really?
I am a skeptic. This is a site for skeptics I have heard.
So I am skeptical:
Have you actually read the paper and understood it? What figure is incorrect? Oh maybe, can you crit figure by figure…it should be easy because there are only two data figs.
Or are you a fake skeptic, just making noise.