I was aware of this story yesterday, but I didn’t like the original plot, (see at the end of this post) since use of straight line linear trends doesn’t accurately reflect the reality of the observation data. While it is often hard to find any reality in climate models, linear trend lines mask the underlying variance. Today, Dr. Spencer has produced a graph that I feel is representative and very well worth sharing, because it does in fact convey an EPIC FAIL speaking directly to the accuracy of an ensemble of climate models. – Anthony
Dr. Roy Spencer writes:
In response to those who complained in my recent post that linear trends are not a good way to compare the models to observations (even though the modelers have claimed that it’s the long-term behavior of the models we should focus on, not individual years), here are running 5-year averages for the tropical tropospheric temperature, models versus observations (click for full size):

In this case, the models and observations have been plotted so that their respective 1979-2012 trend lines all intersect in 1979, which we believe is the most meaningful way to simultaneously plot the models’ results for comparison to the observations.
In my opinion, the day of reckoning has arrived. The modellers and the IPCC have willingly ignored the evidence for low climate sensitivity for many years, despite the fact that some of us have shown that simply confusing cause and effect when examining cloud and temperature variations can totally mislead you on cloud feedbacks (e.g. Spencer & Braswell, 2010). The discrepancy between models and observations is not a new issue…just one that is becoming more glaring over time.
Read his essay here: http://www.drroyspencer.com/2013/06/still-epic-fail-73-climate-models-vs-measurements-running-5-year-means/
==============================================================
Here is the linear plot from Dr. Spencer’s post yesterday. He writes:
Courtesy of John Christy, a comparison between 73 CMIP5 models (archived at the KNMI Climate Explorer website) and observations for the tropical bulk tropospheric temperature (aka “MT”) since 1979 (click for large version):
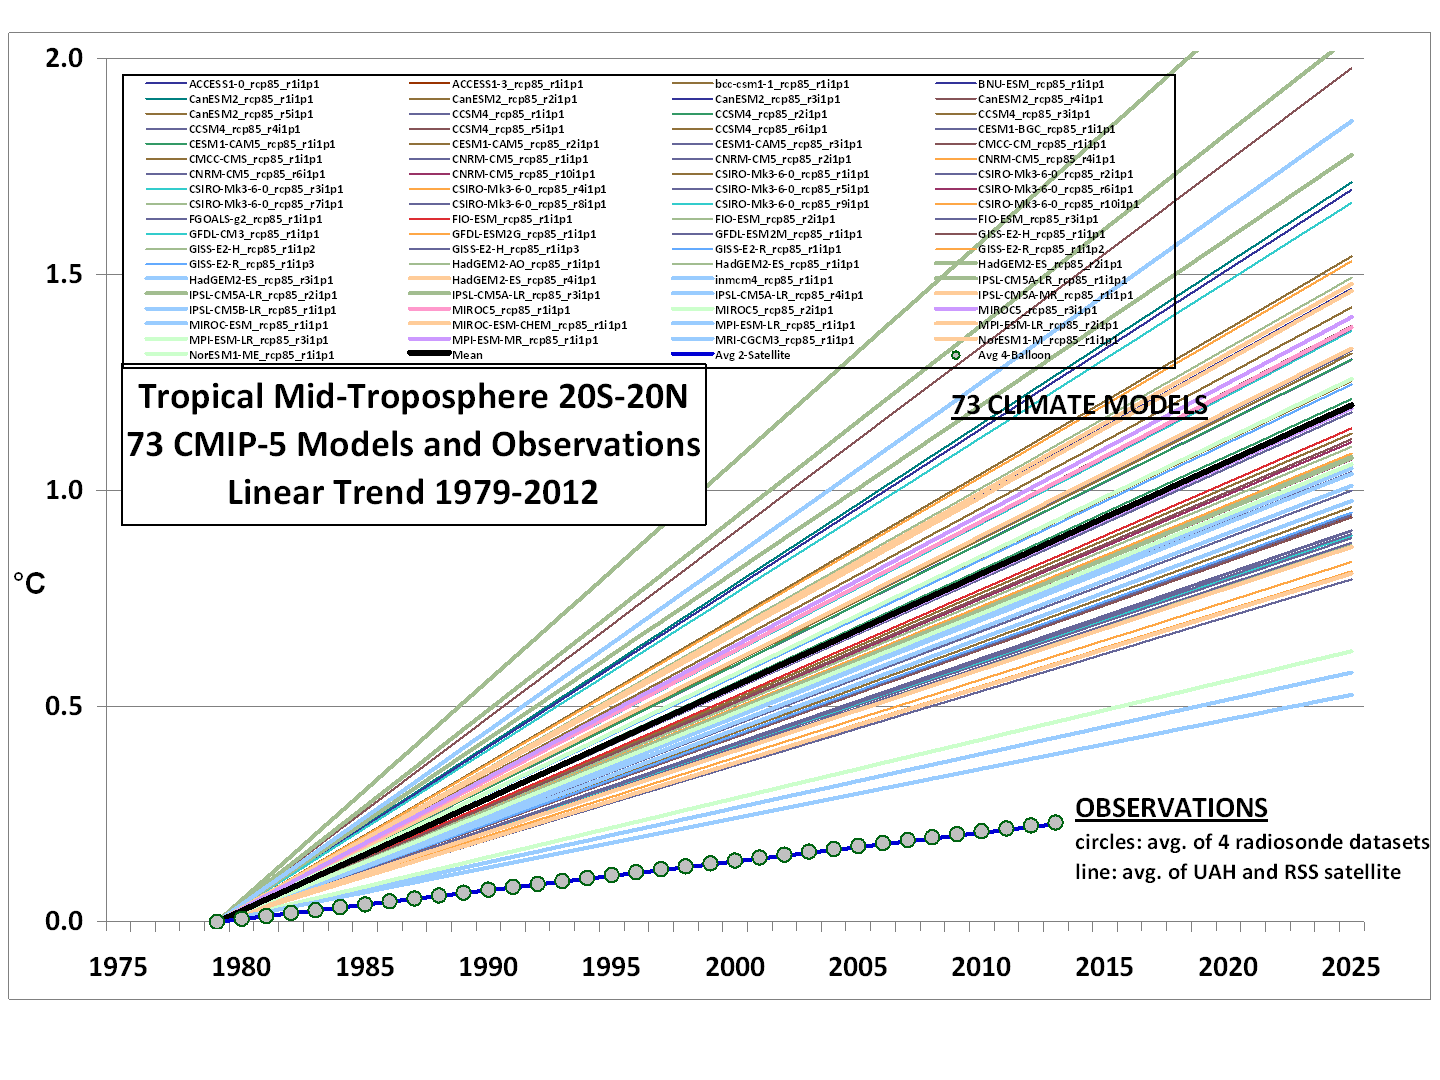
Rather than a spaghetti plot of the models’ individual years, we just plotted the linear temperature trend from each model and the observations for the period 1979-2012.
Note that the observations (which coincidentally give virtually identical trends) come from two very different observational systems: 4 radiosonde datasets, and 2 satellite datasets (UAH and RSS).
If we restrict the comparison to the 19 models produced by only U.S. research centers, the models are more tightly clustered:
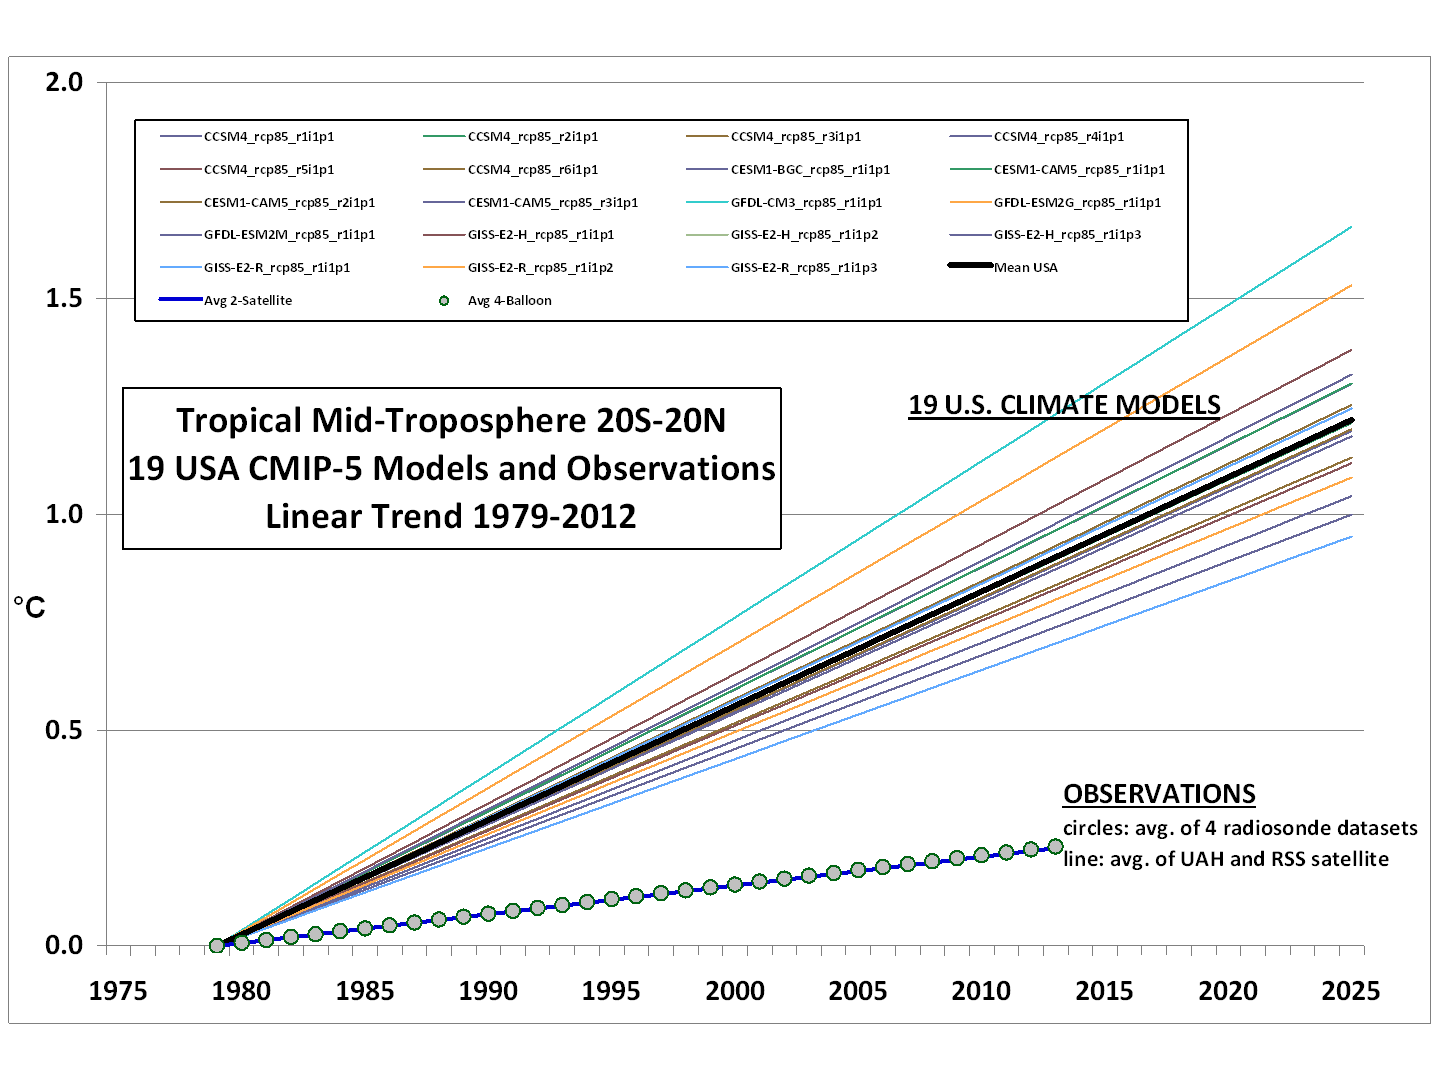
Now, in what universe do the above results not represent an epic failure for the models?
alex says:
June 6, 2013 at 12:29 pm
“It is known, the lower troposphere is warming, the higher troposphere is cooling.
This is what the models say and what observations show.”
You are too gullible.
The tropospheric hot spot has not been observed.
The models are wrong.
http://wattsupwiththat.com/2011/10/12/our-sustainable-mirth/#comment-765890
“when even Dr.Syukuro Manabe, the godfather of climate modeling, now agrees with Fred Singer that it’s not there (see Fu, 2011) and that climate models overstate the warming by 2 to 4 times. ”
Missing Hot Spot 2011
http://joannenova.com.au/2011/10/this-is-90-certainty-really-yet-another-paper-shows-the-hot-spot-is-missing/comment-page-1/#comment-561555
… _ … _ …_ (V)
“… it is now time to really get these [Enviro-n–az–ee-s]. … get a legal team together and take these guys to court.” [Elizabeth at 10AM today]
Yes!
“At some point in time, something must break. The world of science cannot go on interminably with this unresolved dilemma.” [ConTrari at 11:16 today]
D-DAY, June 6, 1944 — what a perfect day for this post showing the Allied Forces for Victory of Truth in Science have WON THE AGW BATTLE!!!
Press on, science giants! YOU WILL WIN THE WAR — “April, 1945” will come.
Truth will win.
GO, WUWT SCIENCE WARRIORS!
V V V V V V V V V V V V V V V V V V V V V V V V
Change to “willfully”
Not in the tropics.
I believe the reason most meteorologists don’t buy into the CAGW theory is because they use models every day. Their models work at certain things, and within some very strict limitations. These folks see how the model results and projections break down and become less reliable the longer out they project.
But GCM climate models, for some strange and bizarre reason, seem to be exempt from this type of absolutely certain uncertainty. The longer out in time they project, their defenders and apologists (Gavin and his ilk) claim there is less material with which to quarrel over their predictions and results. That assumption is all jacked up. It’s bass-ackwards. We should assume the error and uncertainty of models multiplies over time, till it becomes 100% useless at some finite, but ill-defined point in the not too distant future. It is the job of modelers to try to define that point, if possibl, and to stop claiming they’re on to some fundamental truth about the way our climate is responding to human CO2 emmissions.
alex says:
June 6, 2013 at 12:29 pm
‘“Tropical mid-troposphere”.
What the hell is this exactly?
It is known, the lower troposphere is warming, the higher troposphere is cooling.
This is what the models say and what observations show.
Apparently, one can find a position (“mid-troposphere” – whatever it is) where the trend is flat.’
So, you are saying that Spencer is presenting the wrong data? Spencer is using the same satellite data that he and everyone else has been using for decades.
Then the modelers are using some other data? If so, then why not present it?
Bob Tisdale says @ur momisugly June 6, 2013 at 9:52 am
When discussing climate models, is it okay to use the word poo?
===================================================
…or hockey poo
Mickey Reno says:
June 6, 2013 at 1:19 pm
I believe the reason most meteorologists don’t buy into the CAGW theory is because they use models every day. Their models work at certain things, and within some very strict limitations. These folks see how the model results and projections break down and become less reliable the longer out they project.
You are absolutely correct! I have been an operational meteorologist for several decades. The models are a mainstay of our business. But we get to know what they can and cannot do. Certainly anything beyond 3 days can be very suspect and can change dramatically from one model run to the next. We try to know the limitations and explain those to our clients.
And please do not confuse professional meteorologists with climatologists. Climate science has always seemed “fuzzy” to me. Unfortunately, some of the climate scientists/modelers I know do not even know some of the very fundamentals of meteorology. Sad, but true.
GlynnMhor says:
June 6, 2013 at 12:02 pm
Doormann, to what exactly does your link refer by “solar tides”?
http://www.volker-doormann.org/frequencies_of_climate.doc
The models actually are pretty linear, as is their aggregate, as is both the tropical tropospehere temp and the surface (back to 79) in which a first-order line fits better than any nonlinear transform within reason.
They all point in the same direction: The sensitivity is, in aggregate, about .4 of what is in the models.
I don’t see how this charade can continue much longer. The upcoming National Assessment and IPCC AR5 are going to be completely howled down as obsolete the day they are printed. Anyone who defends them is going to look increasingly foolish.
It’s champagne time, IMHO.
Thx Roy!
PS maybe we ought to send some to Santer, Wigley and Trenberth with a nice card welcoming them back to coach.
Your linear trend for the radiosonde/satellite is 66% higher than the values measured on the spaghetti graph. The scaled increase from 1979 to 2012 is 0.13 degrees. Your linear trend has an increase of .19 degrees Murray
MaxL says:
June 6, 2013 at 1:43 pm
“Unfortunately, some of the climate scientists/modelers I know do not even know some of the very fundamentals of meteorology. Sad, but true.”
Yes, that is very sad.
My personal view of modeling (I am a Ph.D. who has spent nearly his entire career doing computational fluid dynamics) is that, if properly constrained and validated, models can be very useful, even climate models. Unfortunately, many climate modelers have developed a herd mentality, and have decided that since their models agree with each other and with some contorted version of ” real world data”, they must be accurate and robust. And then I look at some of the source code of these models and am aghast at how bad it is (e.g. NASA/GISS). I have no objections to climate model research, but the government funding agencies need to get clue and start directing the research funds to people who will do the job right. Will that ever happen? Not as long as the millions and millions of research dollars keep flowing to climate “science”…
“The modellers and the IPCC have willingly ignored the evidence…”
I think “willfully ignored,,,” more accurately reflects the reality of the fraud.
While the War for Truth goes on above and, no doubt, below this post, a pause to reflect on the fact that Freedom Is Not Free.
Dr. Gray and all you fine fighters for truth, tired, but undaunted, attacked, but not overcome, denigrated, but not defeated, this is for you:
June 6, 1944
Thank you.
I’ll never forget when I was on a panel with Mike MacCracken in Texas around 1998 and in warmup chit-chat I asked him how he could explain the difference between the modelled lower trop temperature and those derived from the 1000-500mb thickness, and he looked at me and asked:
“What’s thickness?”
That’s when I got the memo that they knew nothing.
Janice
Pause to reflect on the fact that you gotta wonder if these brave men would have splashed themselves on Omaha Beach if they would have been told that, 65 years later, the government would spy on every citizen’s every telephone call.
No, freedom ain’t free, and we don’t have much of it any more.
Sorry o/t but I am really burned about this Verizon story.
Hal Javert says:
I prefer horse puckey … covers most occasions 🙂
And remember how scientists, supported by journal editors tried to obfuscate and shut down discussion of the obvious:
http://www.americanthinker.com/2009/12/a_climatology_conspiracy.html
http://rogerpielkejr.blogspot.co.nz/2009/12/treating-peer-review-like-partisan-blog.html
Where’s 2012?
Must be a Murphy’s law pertaining to climate research funding… money moves in the direction of the loudest sucking sounds?
But it isn’t just a case of wrong temperature modeling. The wrong data went into making the models. So… it’s a case of wrong attribution. Wrong diagnosis. Wrong prognosis. And the wrong prescription.
Witch doctors proclaiming that we have caused the tornadoes, rains, hurricanes and droughts, and even cold snaps, have found permanent acolytes. Give them a crooked demagogue willing to misuse the public trust, and we have the perfect triumvirate, a team guaranteed to wheedle the dollars out of people’s wallets. How many trillions (worldwide) have already gone to mitigate a disease that we don’t have, based on symptoms we never exhibited?
An interesting phenomenom if it continues….
http://ocean.dmi.dk/arctic/meant80n.uk.php
compare with previous years.Maybe solar effect is beginning to kick in. Of course in climate terms it means nothing but NH ice may in fact stay within normal limits this year.
This one is even more interesting
http://arctic-roos.org/observations/satellite-data/sea-ice/observation_images/ssmi1_ice_ext.png
a COMPLETE stall in melting well see how long that stays, untilthey are forced to remove it.Worth keeping a photo of that page
Janice Moore says:
June 6, 2013 at 2:42 pm
Thanks for that, Janice! Sometimes I get so wound up with the latest shenanigans from the self-absorbed, warmist community that I don’t stop to reflect upon the sacrifices our forefathers made on our behalf…
” Hal Javert says: …or hockey poo”
How about Poo … on a steeek. A Hockey Steeek …
http://cptpatches.files.wordpress.com/2009/12/josejalapeno_1.jpg