I was aware of this story yesterday, but I didn’t like the original plot, (see at the end of this post) since use of straight line linear trends doesn’t accurately reflect the reality of the observation data. While it is often hard to find any reality in climate models, linear trend lines mask the underlying variance. Today, Dr. Spencer has produced a graph that I feel is representative and very well worth sharing, because it does in fact convey an EPIC FAIL speaking directly to the accuracy of an ensemble of climate models. – Anthony
Dr. Roy Spencer writes:
In response to those who complained in my recent post that linear trends are not a good way to compare the models to observations (even though the modelers have claimed that it’s the long-term behavior of the models we should focus on, not individual years), here are running 5-year averages for the tropical tropospheric temperature, models versus observations (click for full size):

In this case, the models and observations have been plotted so that their respective 1979-2012 trend lines all intersect in 1979, which we believe is the most meaningful way to simultaneously plot the models’ results for comparison to the observations.
In my opinion, the day of reckoning has arrived. The modellers and the IPCC have willingly ignored the evidence for low climate sensitivity for many years, despite the fact that some of us have shown that simply confusing cause and effect when examining cloud and temperature variations can totally mislead you on cloud feedbacks (e.g. Spencer & Braswell, 2010). The discrepancy between models and observations is not a new issue…just one that is becoming more glaring over time.
Read his essay here: http://www.drroyspencer.com/2013/06/still-epic-fail-73-climate-models-vs-measurements-running-5-year-means/
==============================================================
Here is the linear plot from Dr. Spencer’s post yesterday. He writes:
Courtesy of John Christy, a comparison between 73 CMIP5 models (archived at the KNMI Climate Explorer website) and observations for the tropical bulk tropospheric temperature (aka “MT”) since 1979 (click for large version):
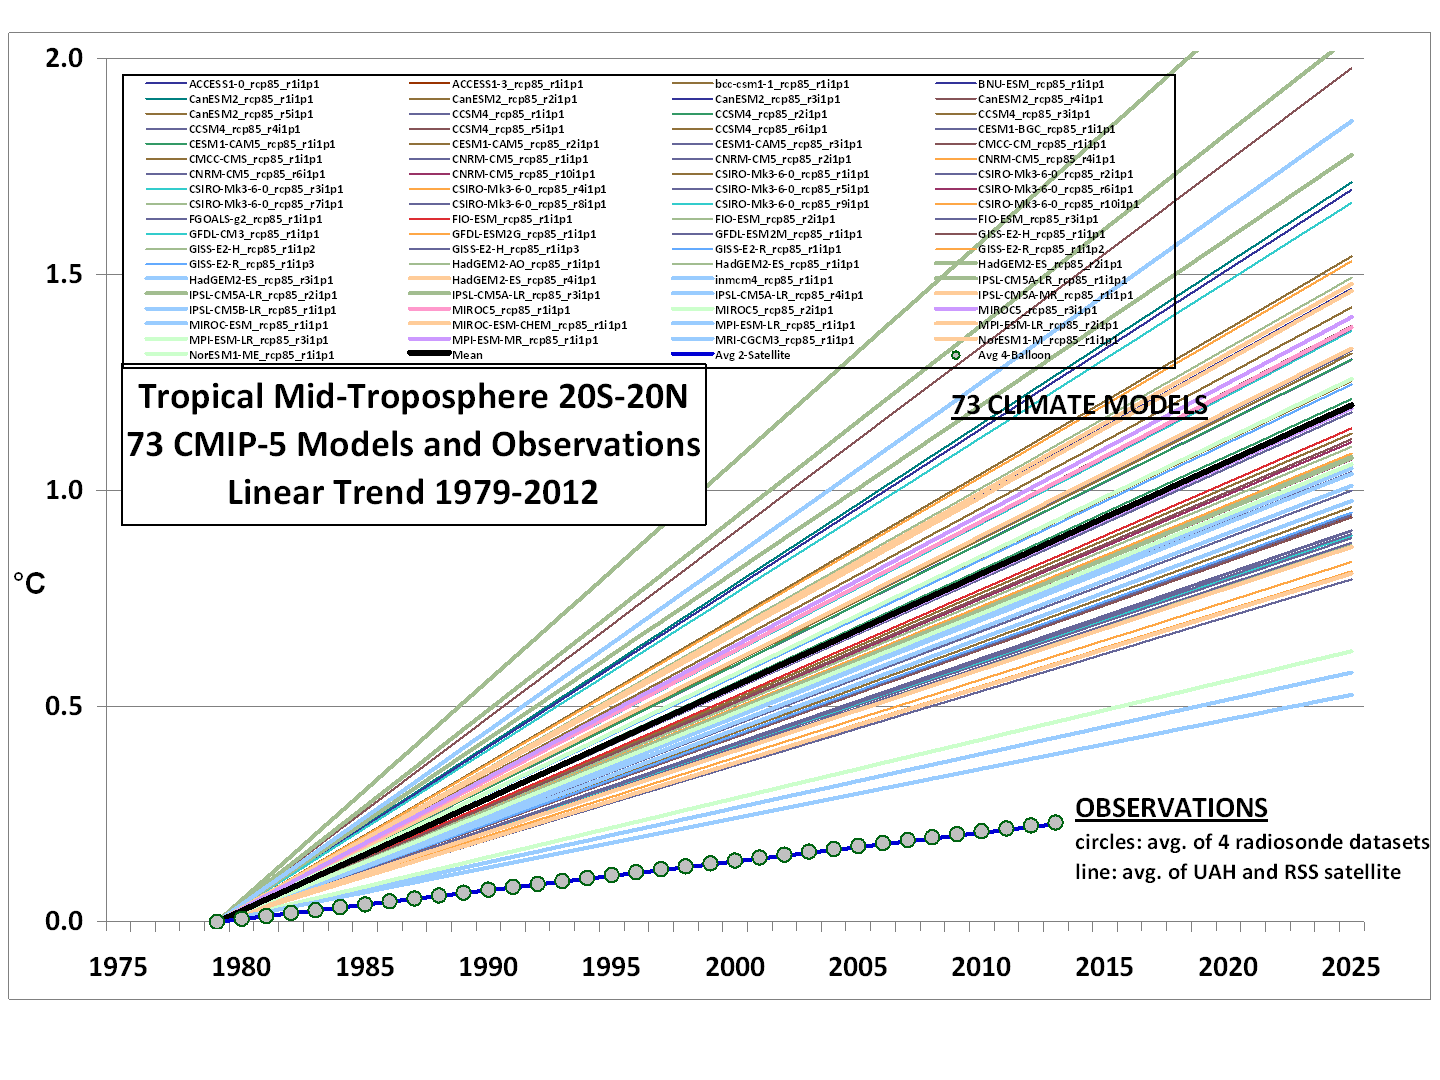
Rather than a spaghetti plot of the models’ individual years, we just plotted the linear temperature trend from each model and the observations for the period 1979-2012.
Note that the observations (which coincidentally give virtually identical trends) come from two very different observational systems: 4 radiosonde datasets, and 2 satellite datasets (UAH and RSS).
If we restrict the comparison to the 19 models produced by only U.S. research centers, the models are more tightly clustered:
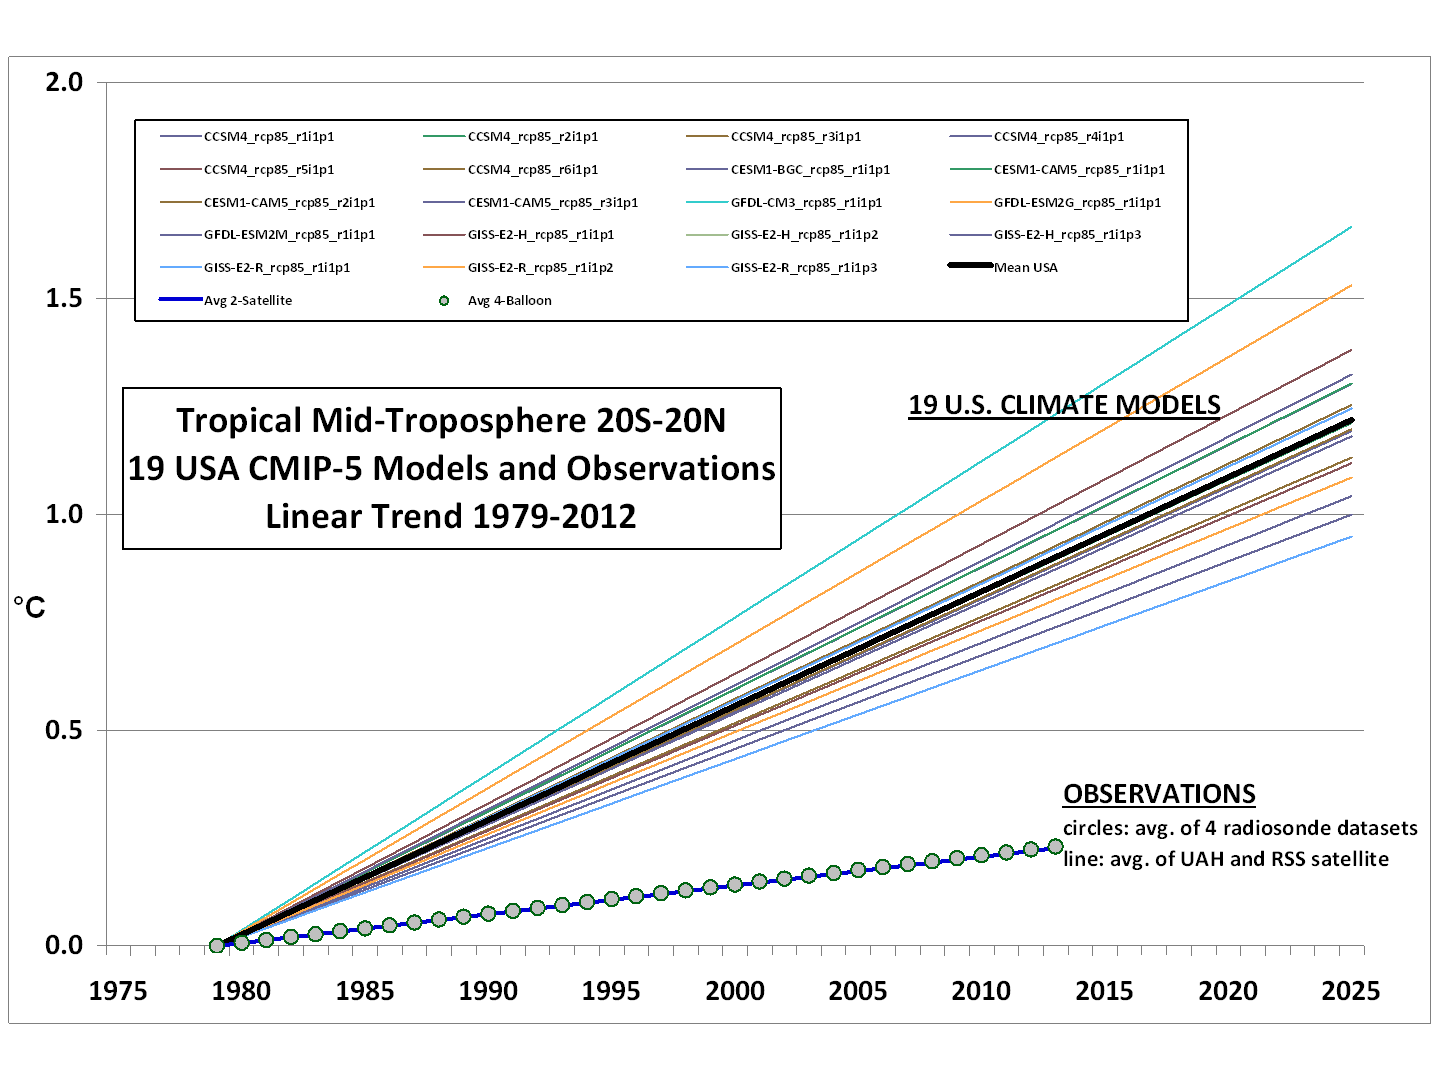
Now, in what universe do the above results not represent an epic failure for the models?
I suppose these graphs will grace the cover of the next IPCC report? /sarc
Type II error rate < 1/73?
Imagine how the Had CRU & GISS/NOAA Team would massage (massacre?) the surface station data if the satellites weren’t watching them?
Why doesn’t the observed temp line show the recent leveling-off? Just askin.
Heh, I had always given a 0.3 deg C rise as my educated guess.
Yea, they’re doing a poor job with tropical mid troposphere, perhaps they should look into that.
Let’s see. As noted above, climate models can’t simulate mid-troposphere temperatures. And as we’re seen before, they can’t simulate:
Sea surface temperatures:
http://bobtisdale.wordpress.com/2013/02/28/cmip5-model-data-comparison-satellite-era-sea-surface-temperature-anomalies/
Land+Sea Surface Temperatures (GISS LOTI):
http://bobtisdale.wordpress.com/2013/04/20/model-data-comparison-with-trend-maps-cmip5-ipcc-ar5-models-vs-new-giss-land-ocean-temperature-index/
Or Precipitation:
http://bobtisdale.wordpress.com/2012/12/27/model-data-precipitation-comparison-cmip5-ipcc-ar5-model-simulations-versus-satellite-era-observations/
When discussing climate models, is it okay to use the word poo?
”It doesn’t matter how beautiful your theory is, it doesn’t matter how smart you are. If it doesn’t agree with experiment, it’s wrong.”
—Richard Feynman
Would that Dr. Feynman were still with us. *sigh*
Reminds me of a lyric from Judy Collin’s “Both Sides Now”:
“I’ve looked at clouds from both sides now
From up and down and still somehow
It’s cloud’s illusions I recall
I really don’t know clouds at all”
I would say that with temp fiddling by the team even the observed temps are lower. I suggest a FLAT line (unless he is using AMSU and RSS). BTW it now time to really get these XXXXXXX. I think for far too long the skeptic sites have been far too soft on the team. It really is time to get some millionaire to get a legal team together and take these guys to court.
Interesting that the short term oscillations seem to match (but was that hindcasting?), but the models have a rising trend, against shall we say a ‘lower’ trend of observations..
look like one knob adjusted too high
UAH global chart for May 2013 shows temps are +0.1 over the base line.
It looks like the global temp in May 1980 is the same as today, ie zero change in 33 years.
Matters not in reality. Anyone with a knowledge of even basic physics knew AGW was garbage and weather was, well, just weather bad or otherwise! Through lies and propaganda, the damage has been done, the message has been delivered, the policies are in place. There is a glimmer of hope, and that is all sceptics have, that on Sept 14th Australia votes for a Govn’t that will repeal the “price on carbon”. This may send a signal to Obama. If not…we may as well kiss the western lifestyle goodbye!
The blue squares seem to be level since 1998.
The Models where based on the political decided UNFCCC!
The models are not science, but instead policy baced science, like any social ……. Science. It is simply not science at all!
Eustace,
He is as long as we keep in mind his sage advice about theory vs real world.
Unfortunately, too many otherwise intelligent people rely on the theory to dictate to reality what it must be. Contrary to that expectation, the theory must agree with the real world and the real world remains what it is without taking into account any of the various wonderful theories of man.
This post by Spencer should be headlines on all major MSM for gods sake do something somebody! LOL
Ryan says:
June 6, 2013 at 9:50 am
“Yea, they’re doing a poor job with tropical mid troposphere, perhaps they should look into that.”
It will be difficult to rig the models in such a way that they present the mid troposphere as cooler while continuing to show the steep surface warming trend the UN has ordered; and still get away with it as science. Maybe if you manage to keep the source codes secret and stop talking about physics altogether.
We need to get a fund going to get these graphs as widely disseminated as possible. When the truth is as obvious as this work shows it should be able to change minds!
Reminds me of a lyric from Joni Mitchell’s “Both Sides Now”:
Have the problems with the MT product been fixed? I recall that there were issues with contamination by the stratosphere data I know that RSS corrects for that, how have UAH dealt with it?
@coalsoffire 9:37 am
I suppose these graphs will grace the cover of the next IPCC report? /sarc
Yea, but it ought to grace the cover of the NIPCC report. Oops.
This is supposed to be a scientific discourse, but isn’t it amazing that it is impossible to engage in this discourse without the reality of political impacts and results coming into play.
What a deception we enable by trying to continue a scientific discourse over such obvious political rhetoric and intentions.
It appears that the consensus is that we must all buy tulips, regardless of price. Isn’t that what the Dutch concluded several hundred years ago? Or perhaps we should consider the behavior of Lemmings.
Sadly, Patrick, you’re wrong. Angela Merkel, chancellor of Germany, has a physics degree and yet she still spouts the warmist party line. Even advanced thinking skills and education are no protection from stupidity.
Human beings are nowhere near as reasonable as we think we are. Most of what passes for thought in our crania is just confabulation. We’re really good at it and we really can convince ourselves of anything, no matter how stupid. http://en.wikipedia.org/wiki/Confabulation
What process is depressing these temps in the tropics? Do you think it is sustained by His faithful providence?