
Guest post by Alec Rawls
They say it all the time: even if there were some substantial mechanism of enhanced solar forcing it couldn’t be responsible for late 20th century warming because solar activity was roughly constant from 1950 to 2000. I have rounded up statements to this effect from eighteen top “consensus” climatologists, like Raimund Muscheler (2012):
Solar activity & cosmic rays were relatively constant (high solar activity, strong shielding and low cosmic rays) in the second part of the 20th century and, therefore, it is unlikely that solar activity (whatever process) was involved in causing the warming since 1970.
Is he assuming that the oceans equilibrate rapidly to any change in forcing so that continued high forcing is necessary just to maintain the new equilibrium, resulting in only a brief shot of warming? He doesn’t say. None of them say. They just make this highly counterintuitive claim that persistent forcing cannot cause continued warming, as if they actually believe that it is the change in the forcing rather than the level of the forcing that does the warming.
The tune changes however, as soon as the subject is forcing from greenhouse gases. A staple of the crusade against CO2 is the “commitment study,” where climatologists use their general circulation computer models (GCMs) to estimate the amount of future warming that would result if atmospheric CO2 were to stop increasing and just stay at current levels. That means no change in forcing going forward, just continued forcing at the present “high” level. The estimates of the continued warming this would cause over the 21st century are quite large, roughly equivalent to 20th century warming, or in the latest estimations, substantially higher.
AR4 estimated the “constant composition” commitment at 0.1°C/decade for the early 21st century, 0.6 °C for the whole century
From AR4 (§10.7.1, PP4):
The multi-model average warming for all radiative forcing agents held constant at year 2000 (reported earlier for several of the models by Meehl et al., 2005c), is about 0.6°C for the period 2090 to 2099 relative to the 1980 to 1999 reference period. This is roughly the magnitude of warming simulated in the 20th century. Applying the same uncertainty assessment as for the SRES scenarios in Fig. 10.29 (–40 to +60%), the likely uncertainty range is 0.3°C to 0.9°C. Hansen et al. (2005a) calculate the current energy imbalance of the Earth to be 0.85 W m–2, implying that the unrealised global warming is about 0.6°C without any further increase in radiative forcing. The committed warming trend values show a rate of warming averaged over the first two decades of the 21st century of about 0.1°C per decade, due mainly to the slow response of the oceans. About twice as much warming (0.2°C per decade) would be expected if emissions are within the range of the SRES scenarios.
Should Gerald Meehl’s estimate of 21st century commitment be reduced in compensation for the fact that he uses a 1980 – 1999 temperature average as a baseline? It seems that a decade’s worth of his 21st century warming estimate is actually taking place between 1990 (the center of his baseline period) and 2000. If so, the compensation would be at most about 0.1°C. That is the peak rate of warming the models produce for year-2000 Green House Gas levels. 1980-1999 GHG levels were lower, hence modeled warming would have been less than 0.1°C between the 1990 midpoint of the period and 2000 so less than 0.1°C of Meehl’s estimate of 21st century warming would actually be taking place during the 20th century.
But maybe no adjustment is needed. Meehl et al. certainly do not hesitate in presenting their figures as estimates of “further warming” vis a vis 2000. From the Meehl 2005 abstract:
Two global coupled climate models show that even if the concentrations of greenhouse gases in the atmosphere had been stabilized in the year 2000, we are already committed to further global warming of about another half degree and an additional 320% sea level rise caused by thermal expansion by the end of the 21st century. … At any given point in time, even if concentrations are stabilized, there is a commitment to future climate changes that will be greater than those we have already observed.
As for other commitment findings, Tom Wigley (2005) estimated that the “constant composition” warming commitment “could exceed 1°C,” and the graph at the top of the post is from Matthews and Weaver 2010, a pay-walled post-AR4 commitment study that was reviewed by Gavin Schmidt, who lists their commitment estimate from constant year-2000 GHG forcing as “an additional 0.3 to 0.8ºC warming over the 21st Century.”
AR5 commitment estimates are higher still, presumably because they project 2010 GHG levels. From the Second Order Draft (p. 12-60):
“Constant emission commitment” is the warming that would result from keeping anthropogenic emissions constant and is estimated for example at about 1–2.5°C by 2100 assuming constant (year 2010) emissions in the future, based on the MAGICC model calibrated to CMIP3 and C4MIP (Meinshausen et al., 2011a; Meinshausen et al., 2011b) (see FAQ 12.3).
At the low end, that is more warming than was seen during the 20th century, at the high end it is 3 to 4 times 20th century warming. Guess that nixes the idea of rapid ocean equilibration.
Talking out of both sides of their mouths
These commitment findings should be taken with a grain of salt. Would current levels of GHG forcing, which have coexisted with no statistically significant warming for 15 years now, really cause the present century to warm twice as fast as last? Such wild prognostications show how extravagantly the “consensus” scientists are willing to exaggerate in favor of their anti-CO2 narrative, but they can’t have it both ways. If they expect the persistence of a mildly elevated GHG forcing to cause many decades of substantial warming then it is pure dishonesty to turn around and declare that persistently elevated solar forcing, regardless of its level, could not cause more than a decade or two of warming.
Some of these scientists have done very important work. Ilya Usoskin, for instance, has been a pioneer in developing cosmogenic nucleotide proxies for solar activity. That makes it unsettling to have to call him out, but HEY USOSKIN, it’s about time you renounced the BUT in Usoskin et al. 2005:
The long term trends in solar data and in northern hemisphere temperatures have a correlation coefficient of about 0.7 – .8 at a 94% – 98% confidence level.
BUT:
During these last 30 years the total solar irradiance, solar UV irradiance and cosmic ray flux has not shown any significant secular trend, so that at least this most warming episode must have another source.
Usoskin himself classifies 1920 to 2000 as a “grand maximum” of solar activity, thus his claim here is that even if a historically powerful driver of climate remains at a high level for an extended period of time it will still not cause continued warming. To cause continued warming it would have to keep going up (to higher than high levels).
Does he actually believe that, or did it just seem like a small price to pay to stay in the good graces of the funding institutions that Al Gore, Maurice Strong, James Hansen, Stephen Schneider et al. established in the 1990s? In fact it is a huge price to pay. It is a complete debasement of scientific principle, handing the anti-CO2 crusaders an utterly fraudulent grounds for dismissing the alternative solar-warming hypothesis, and pretty much all of the leading solar scientists have embraced the same trope.
Whether this is bias or cowardice it needs to stop, and for anyone who wants to be silenced no longer, the commitment studies offer an ironclad opportunity. After all, the GCM guys have their own field of expertise. If the computer modelers insist that a steady high level of forcing will cause at least several decades of substantial continued warming then who are the solar scientists to contradict them? All they have to do is stop making highly speculative claims about ocean equilibration that lie completely outside of their field and are unsupported by any reason or evidence.
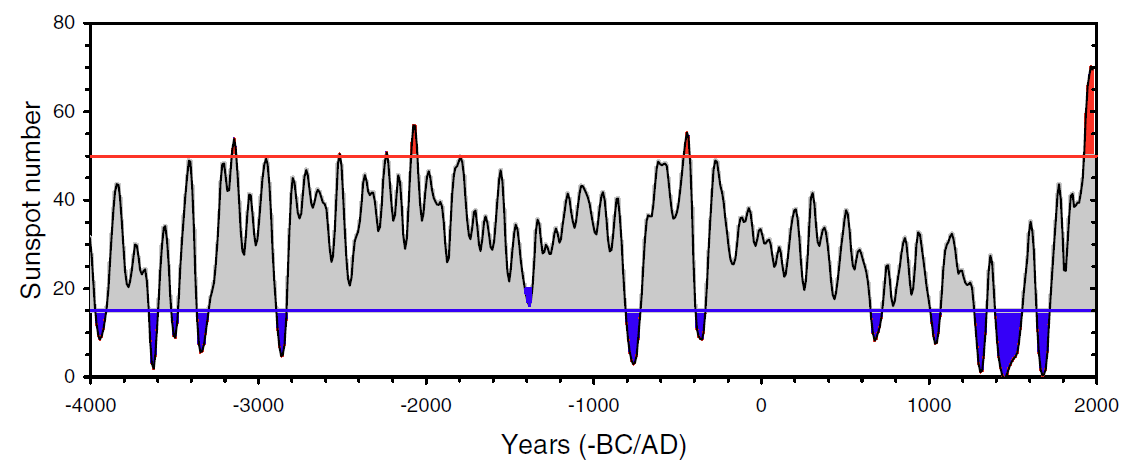
Usoskin’s solar estimates are “grand maximum” even if post-1945 Waldmeier-era sunspot counts are reduced by 20% as Leif Svalgaard urges
Usoskin uses a “high activity threshold” of 50 so even if his sunspot counts (“75 ± 3 since 1950“) are reduced by 20% they are still at “grand maximum” levels from the 1940s to the 1990s by Usoskin’s criteria.
Hat tip to Lucia Liljegren
I asked Lucia if she knew of any GCM tests of the solar warming hypothesis. Had the “consensus” ever GCM-tested their oft-repeated claim that even if there were a substantial mechanism of enhanced solar forcing it could not have caused late 20th century warming?
Not that she knew of, but she suggested that the results of a persistent elevated level of solar forcing should be roughly the same as for a persistent elevated level of GHG forcing, as examined in the commitment studies. In both cases the amount of warming would be the same. Both would be calibrated to account for observed 20th century warming, so the resulting ocean equilibration process should be similar.
Thanks Lucia. The “consensus” has indeed already in-effect GCM-tested the alternate hypothesis, with just a slight change in time frame. Fifty years of high solar activity beginning in 1950 are analogous to fifty years of 2010-level CO2 forcing beginning in 2010, and the predicted warming from the CO2 commitment testing directly contradicts the stated rationale for dismissing a solar explanation for late 20th century warming.
Discover more from Watts Up With That?
Subscribe to get the latest posts sent to your email.
(Snip. If that is your idea of debate you can take it elsewhere. Next off-topic attempt gets future comments deleted. ~mod)
Welcome to the reality based segment of the population that trusts HadCRUT3! Still, the basic issue is that CO2 is not the only driver of global temperatures, so you are arguing against a strawman here, as is Jo Nova. You might as well draw a few more lines on that second chart, and ask how steadily rising anthropogenic emission rates and total accumulation of CO2 in the atmosphere could cause the temperature to go down. Because that is the argument you are making, that 100% of the trend is attributable to CO2.
But if you insist on playing with colored lines, you might try to be a bit more science-y by making all the intervals the same length – you know, apples to apples and all that. If we make Jo’s first interval 30 years long, like the others, by starting in 1850 instead of 1860, what happens? Oh, the slope is different. If we make it end in 1890 instead of 1880, what happens? Oh, the slope is different. So careful choice of endpoints is necessary to make the argument work. Clue – that ain’t science.
Again, all is not lost! It is great to see that you think 30 year periods are needed to make a point about climate. Totally drives a stake in the heart of the 16 years of no warming meme, eh? And you had it right from the start. Good boy!
Bob This is why I have not been able to get the ERP for cross equatorial com’s
http://en.wikipedia.org/wiki/Spread_spectrum Big brother is allways looking over or shoulders .
vun Kannon,
Even the Met Office now admits that global warming has stopped. That admission totally drives a stake into the heart of your failed conjecture, eh? And you thought you had it right from the start.
Wrong.
@D Boehm Stealey – Stopped for what? 16 years? When the temperature was rising, we regularly heard that 20, 30 years of data was necessary to recognize a trend in climate. Come back in 14 years with your claim that global warming has stopped.