
Guest post by Alec Rawls
They say it all the time: even if there were some substantial mechanism of enhanced solar forcing it couldn’t be responsible for late 20th century warming because solar activity was roughly constant from 1950 to 2000. I have rounded up statements to this effect from eighteen top “consensus” climatologists, like Raimund Muscheler (2012):
Solar activity & cosmic rays were relatively constant (high solar activity, strong shielding and low cosmic rays) in the second part of the 20th century and, therefore, it is unlikely that solar activity (whatever process) was involved in causing the warming since 1970.
Is he assuming that the oceans equilibrate rapidly to any change in forcing so that continued high forcing is necessary just to maintain the new equilibrium, resulting in only a brief shot of warming? He doesn’t say. None of them say. They just make this highly counterintuitive claim that persistent forcing cannot cause continued warming, as if they actually believe that it is the change in the forcing rather than the level of the forcing that does the warming.
The tune changes however, as soon as the subject is forcing from greenhouse gases. A staple of the crusade against CO2 is the “commitment study,” where climatologists use their general circulation computer models (GCMs) to estimate the amount of future warming that would result if atmospheric CO2 were to stop increasing and just stay at current levels. That means no change in forcing going forward, just continued forcing at the present “high” level. The estimates of the continued warming this would cause over the 21st century are quite large, roughly equivalent to 20th century warming, or in the latest estimations, substantially higher.
AR4 estimated the “constant composition” commitment at 0.1°C/decade for the early 21st century, 0.6 °C for the whole century
From AR4 (§10.7.1, PP4):
The multi-model average warming for all radiative forcing agents held constant at year 2000 (reported earlier for several of the models by Meehl et al., 2005c), is about 0.6°C for the period 2090 to 2099 relative to the 1980 to 1999 reference period. This is roughly the magnitude of warming simulated in the 20th century. Applying the same uncertainty assessment as for the SRES scenarios in Fig. 10.29 (–40 to +60%), the likely uncertainty range is 0.3°C to 0.9°C. Hansen et al. (2005a) calculate the current energy imbalance of the Earth to be 0.85 W m–2, implying that the unrealised global warming is about 0.6°C without any further increase in radiative forcing. The committed warming trend values show a rate of warming averaged over the first two decades of the 21st century of about 0.1°C per decade, due mainly to the slow response of the oceans. About twice as much warming (0.2°C per decade) would be expected if emissions are within the range of the SRES scenarios.
Should Gerald Meehl’s estimate of 21st century commitment be reduced in compensation for the fact that he uses a 1980 – 1999 temperature average as a baseline? It seems that a decade’s worth of his 21st century warming estimate is actually taking place between 1990 (the center of his baseline period) and 2000. If so, the compensation would be at most about 0.1°C. That is the peak rate of warming the models produce for year-2000 Green House Gas levels. 1980-1999 GHG levels were lower, hence modeled warming would have been less than 0.1°C between the 1990 midpoint of the period and 2000 so less than 0.1°C of Meehl’s estimate of 21st century warming would actually be taking place during the 20th century.
But maybe no adjustment is needed. Meehl et al. certainly do not hesitate in presenting their figures as estimates of “further warming” vis a vis 2000. From the Meehl 2005 abstract:
Two global coupled climate models show that even if the concentrations of greenhouse gases in the atmosphere had been stabilized in the year 2000, we are already committed to further global warming of about another half degree and an additional 320% sea level rise caused by thermal expansion by the end of the 21st century. … At any given point in time, even if concentrations are stabilized, there is a commitment to future climate changes that will be greater than those we have already observed.
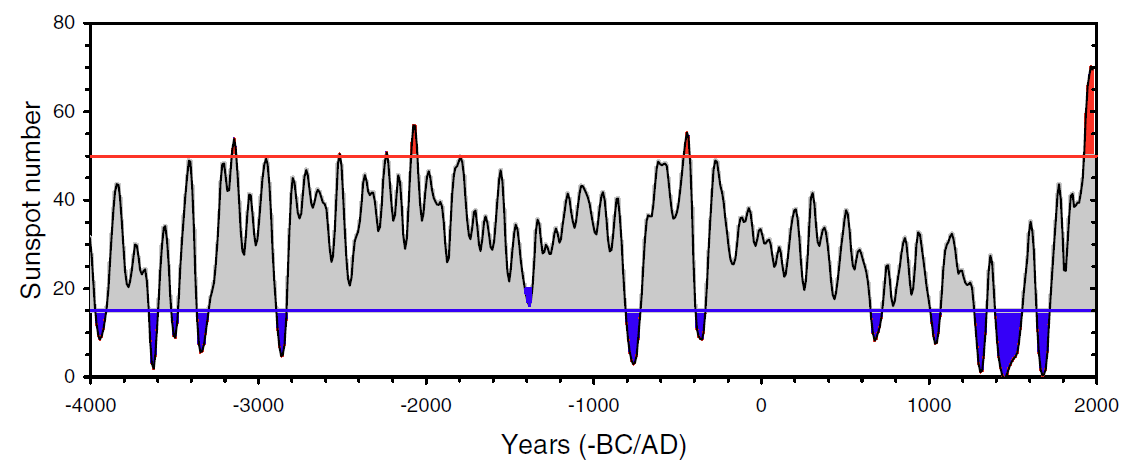
As for other commitment findings, Tom Wigley (2005) estimated that the “constant composition” warming commitment “could exceed 1°C,” and the graph at the top of the post is from Matthews and Weaver 2010, a pay-walled post-AR4 commitment study that was reviewed by Gavin Schmidt, who lists their commitment estimate from constant year-2000 GHG forcing as “an additional 0.3 to 0.8ºC warming over the 21st Century.”
AR5 commitment estimates are higher still, presumably because they project 2010 GHG levels. From the Second Order Draft (p. 12-60):
“Constant emission commitment” is the warming that would result from keeping anthropogenic emissions constant and is estimated for example at about 1–2.5°C by 2100 assuming constant (year 2010) emissions in the future, based on the MAGICC model calibrated to CMIP3 and C4MIP (Meinshausen et al., 2011a; Meinshausen et al., 2011b) (see FAQ 12.3).
At the low end, that is more warming than was seen during the 20th century, at the high end it is 3 to 4 times 20th century warming. Guess that nixes the idea of rapid ocean equilibration.
Talking out of both sides of their mouths
These commitment findings should be taken with a grain of salt. Would current levels of GHG forcing, which have coexisted with no statistically significant warming for 15 years now, really cause the present century to warm twice as fast as last? Such wild prognostications show how extravagantly the “consensus” scientists are willing to exaggerate in favor of their anti-CO2 narrative, but they can’t have it both ways. If they expect the persistence of a mildly elevated GHG forcing to cause many decades of substantial warming then it is pure dishonesty to turn around and declare that persistently elevated solar forcing, regardless of its level, could not cause more than a decade or two of warming.
Some of these scientists have done very important work. Ilya Usoskin, for instance, has been a pioneer in developing cosmogenic nucleotide proxies for solar activity. That makes it unsettling to have to call him out, but HEY USOSKIN, it’s about time you renounced the BUT in Usoskin et al. 2005:
The long term trends in solar data and in northern hemisphere temperatures have a correlation coefficient of about 0.7 – .8 at a 94% – 98% confidence level.
BUT:
During these last 30 years the total solar irradiance, solar UV irradiance and cosmic ray flux has not shown any significant secular trend, so that at least this most warming episode must have another source.
Usoskin himself classifies 1920 to 2000 as a “grand maximum” of solar activity, thus his claim here is that even if a historically powerful driver of climate remains at a high level for an extended period of time it will still not cause continued warming. To cause continued warming it would have to keep going up (to higher than high levels).
Does he actually believe that, or did it just seem like a small price to pay to stay in the good graces of the funding institutions that Al Gore, Maurice Strong, James Hansen, Stephen Schneider et al. established in the 1990s? In fact it is a huge price to pay. It is a complete debasement of scientific principle, handing the anti-CO2 crusaders an utterly fraudulent grounds for dismissing the alternative solar-warming hypothesis, and pretty much all of the leading solar scientists have embraced the same trope.
Whether this is bias or cowardice it needs to stop, and for anyone who wants to be silenced no longer, the commitment studies offer an ironclad opportunity. After all, the GCM guys have their own field of expertise. If the computer modelers insist that a steady high level of forcing will cause at least several decades of substantial continued warming then who are the solar scientists to contradict them? All they have to do is stop making highly speculative claims about ocean equilibration that lie completely outside of their field and are unsupported by any reason or evidence.
Usoskin’s solar estimates are “grand maximum” even if post-1945 Waldmeier-era sunspot counts are reduced by 20% as Leif Svalgaard urges
Usoskin uses a “high activity threshold” of 50 so even if his sunspot counts (“75 ± 3 since 1950“) are reduced by 20% they are still at “grand maximum” levels from the 1940s to the 1990s by Usoskin’s criteria.
Hat tip to Lucia Liljegren
I asked Lucia if she knew of any GCM tests of the solar warming hypothesis. Had the “consensus” ever GCM-tested their oft-repeated claim that even if there were a substantial mechanism of enhanced solar forcing it could not have caused late 20th century warming?
Not that she knew of, but she suggested that the results of a persistent elevated level of solar forcing should be roughly the same as for a persistent elevated level of GHG forcing, as examined in the commitment studies. In both cases the amount of warming would be the same. Both would be calibrated to account for observed 20th century warming, so the resulting ocean equilibration process should be similar.
Thanks Lucia. The “consensus” has indeed already in-effect GCM-tested the alternate hypothesis, with just a slight change in time frame. Fifty years of high solar activity beginning in 1950 are analogous to fifty years of 2010-level CO2 forcing beginning in 2010, and the predicted warming from the CO2 commitment testing directly contradicts the stated rationale for dismissing a solar explanation for late 20th century warming.
Discover more from Watts Up With That?
Subscribe to get the latest posts sent to your email.
That means no change in forcing going forward, just continued forcing at the present “high” level.
Not that right! If CO2 emissions would stabilize at their 2000 level the forcing would continue to increase because CO2 would continue to accumulate [at the 2000 annual rate].
To reduce the forcing one should decrease the CO2 atmopsheric concentration, and this is only possible if emissions were stopped.
This being said, it remains open to know if the impact is 0.6 °C per doubling of CO2 with which we can live with, or another much higher unrealistic number.
Ahem:
“The influence of the sun has been discounted in the climate models as a contributor to the warming observed between 1975 and 1998. Those who support the theory of anthropogenic global warming (AGW), now known as anthropogenic climate change so that recent cooling can be included in their scenario, always deny that the sun has anything to do with recent global temperature movements.
The reason given is that Total Solar Irradiance (TSI) varied so little over that period that it cannot explain the warming that was observed. I don’t yet accept that TSI tells the whole story because it is ill defined and speculative as regards it’s representation of all the different ways the sun could affect the Earth via the entire available range of physical processes. (Since writing this article the effect of UV and EUV on ozone quantities has come more to the fore).
It is true that, as the alarmists say, since 1961 the average level of TSI has been approximately level if one averages out the peaks and troughs from solar cycles 19 through to 23.
However, those solar cycles show substantially higher levels of TSI than have ever previously occurred in the historical record.
Because of the height of the TSI level one cannot simply ignore it as the IPCC and the modellers have done.
The critical issue is that having achieved such high levels of TSI by 1961 the sun was already producing more heat than was required to maintain a stable Earth temperature. On that basis alone the theory of AGW cannot be sustained and should now die.
Throughout the period 1961 to about 2001, there was a steady cumulative net warming effect from the sun. The fact that the TSI was, on average, level during that period is entirely irrelevant and misleading.
It is hardly likely that such a high level of TSI compared to historical levels is going to have no effect at all on global temperature changes and indeed during most of that period there was an enhanced period of positive Pacific Decadal Oscillation that imparted increasing warmth to the atmosphere. My link below to article 1041 contains details of my view that the sun drives the various oceanic oscillations which in turn drive global temperature variations with all other influences including CO2 being minor and often cancelling themselves out leaving the solar/oceanic driver supreme.
It could be said that the increase in TSI from a little over1363 to a little under1367 Watts per square metre over the 400 year period shown is pretty insignificant. However a square metre is a miniscule portion of the surface of the planet so that even a tiny increase or decrease in the heat being received on average over each such tiny area translates into a huge change in total heat budget for the entire planet. The smallness of the apparent range of variation is a function of the smallness of the area subdivision used rather than an indication of insignificance. It is fortunate for us that the sun is not more variable.
The observation of a historically high level of TSI from 1961 to 2001 tends to fit with the theories set out in my other articles about the real cause of recent warming and the real link between solar energy, ocean cycles and global temperatures.”
http://climaterealists.com/index.php?id=1396&linkbox=true&position=1
“The Death Blow To Anthropogenic Global Warming”
June 4th 2008.
thingadonta says:
January 9, 2013 at 9:58 pm
………They should have never jumped to the very convenient academic conclusion that society had to be saved by academia. They should have said that they don’t know. They should not have jumped to hasty conclusions, and should had better examined other possibilities. They should not have dug their heels in and formed a house of cards ‘consensus’. They were irresponsible, and it’s going to come and back and haunt them………
And what do you think that the average man and woman in the street will do when they realize that the scientists got it so wrong and the politicians used that – to extract huge taxes, kill industries, make fortunes – and leave the average man and woman in the street so much worse off with limited food and with their grandparents dying of cold in fuel poverty while the ‘green czars’ like Hansen and Gore live it up on their money? Does anyone really think that the population will ‘go quietly into the night’ with a collective ‘shrug’? When you say things will come back and haunt them; I would say that there will be some high profile scientists and politicians that may need to ‘do a Maurice Strong’ and decamp to one of the countries that won from the ‘nature trick’ they pulled on the taxpayers. There could be ‘Tahrir Square protests’ coming to cities near you – I don’t think this will be a gentle landing.
Alec Rawls: Climate models are nonsensical when it comes to the warming of the oceans, so using them as reference does not help your cause. Let’s discuss Ocean Heat Content, because if there was any mythical influence of CO2 and a solar lag in the warming of the oceans, it would show up there. Let me borrow some graphs from my book.
The ocean heat content for the tropical Pacific warms immediately during the 3-year La Niña events:
http://i48.tinypic.com/wcilgk.jpg
And again immediately during the 1995/96 La Niña event:
http://i45.tinypic.com/1zgc2s8.jpg
Likewise, the ocean heat content for the tropics as a whole warm, with a 9-month lag, during the 3-year La Niña events:
http://i50.tinypic.com/egaj4w.jpg
The warming of the ocean heat content for the extratropical North Pacific is dependent on a 2-year climate shift in 1989-90. Without that shift, the ocean heat content for the extratropical North Pacific would cool:
http://i45.tinypic.com/1z1aiix.jpg
And if you’re wondering how a shift in sea level pressure impacts ocean heat content, the shift in sea level pressure reflects a change in the wind patterns.
That same shift is also evident in the sea surface temperatures for the extratropical North Pacific but it occurs a year earlier.
So where’s the lag and where’s the solar influence? In other words, show me the data.
Bob.
Alec may have his own comment but mine would be that for periods less than 60 years the solar effect is hidden by shorter term variations.
The longer term solar background trend only shows up in successive positive or negative phases hence the upward stepping you noted from one positive phase to the next during the 20th century.
I expect there would have been similar downward stepping from MWP to LIA.
Leif Svalgaard says:
January 9, 2013 at 10:59 pm
Here we go again: Image TSI was constant for a million years. Then changed suddenly by 1% ans stayed at that higher level for the next million years. You are claiming that during that second million years [and actually also during the first million years] that the temperature [warming] would continue to rise throughout all that time. If a million is too short, make it 100 million.
And what is your field of study.
Most of the people here are really intelligent but miss the forest for the trees. These so called scientist know its not warming they don’t give a rats behind. They hate people and society and will say or do whatever they can to control you. The Hansons and Gores of the world consider themselves special and most everyone else worthless. When global warming goes away they will find another cause.
Stephen Wilde says: “Alec may have his own comment but mine would be that for periods less than 60 years the solar effect is hidden by shorter term variations.”
Show me the data. Otherwise, you’re simply speculating. Right now the data disagrees with your assumed long-term effects. That is, reductions in cloud amount associated with La Ninas provide immediate responses in ocean heat content. It may take a while to redistribute that warm water through El Ninos, but the response of the tropical Pacific to ENSO does not lag by any appreciable time period–months, if at all–not decades.
Alec Rawls says:
January 10, 2013 at 12:23 am
So in your view Leif, the later GSN numbers need to be reduced by 50%? Going how far back?
As with the International Sunspot Number, it is better to increase the older number. This has to be done for all times before 1882. http://www.leif.org/research/What-is-Wrong-with-GSN.pdf
Stephen Wilde says:
January 10, 2013 at 3:17 am
I don’t yet accept that TSI tells the whole story because it is ill defined
No, TSI is extremely well defined: the total amount of radiation we receive from the Sun.
However, those solar cycles show substantially higher levels of TSI than have ever previously occurred in the historical record.
Again, No. There is no evidence of such a ‘substantial higher level’ than ever before.
The observation of a historically high level of TSI from 1961 to 2001 tends to fit with the theories set out in my other articles
Since there is no such high levels, does that invalidate your theory?
Are you implying it should be possible to create a GCM with enhanced solar forcing that will perform as poorly at current GCMs?
Leif:
i) Taken out of context. Read the entire sentence.
ii) Article written prior to your ironing flatter of the historical record. Nonetheless the general shape of the record has been preserved though you have raised the 1700s to a similar level to the late 20th century.The dips in activity still correspond with cooler spells as modulated by the 60 year Pacific Multidecadal Oscillation.
iii) TSI from 1961 to 2001 was higher than ‘average’ but of course you do know that it is other aspects of solar activity that I have since proposed as causative of circulation changes.
So as far as I can see my hypothesis remains intact and apparently has now been ‘adopted’ by NASA.
Good point Alec. I’ve been trying to make the same one for several year. And there is another element, that combined with the solar activity, explains the temperature curve fairly well. Have a look at the ENSO chart from about 1976 to 1996.
http://www.esrl.noaa.gov/psd/enso/mei/ts.gif
Bob Tisdale says:
January 10, 2013 at 5:42 am
The relevant data is your own observation of upward stepping in global temperatures.
Short term data often ‘disagrees’ with the long term efects.
I understand what Alec is doing but I think the effort is misplaced. I have read Leif’s claims and I agree that the sun hasn’t been in any grand maximum. Over the last 3 centuries there has been a small warming due to a slightly stronger sun that pulled us out of the LIA. We have reached an equilibrium state.
So, if we remove the problems due to invalid temperature adjustments, siting problems and UHI from the temperature record, I believe the true data shows almost no warming at all during the 20th century. This fits perfectly with Leif’s new sunspot count. The variation we see is due to the oceans.
The entire cAGW mess is based on positive modes of the PDO and AMO. We won’t see that again for decades while we may see a small reduction in TSI as the sun goes quiet. This will lead to cooling.
Stephen Wilde says:
January 10, 2013 at 6:52 am
it is other aspects of solar activity that I have since proposed as causative of circulation changes.
Since the first ones didn’t work one apparently has to look around for something else, ignoring the falsification.
Leif said:
“Since the first ones didn’t work one apparently has to look around for something else, ignoring the falsification.”
The link with sunspots is good enough in broad terms but other variables are better.There has been no falsification even using your revised sunspot numbers.
Something caused the poleward zonal jets and reduced cloudiness during the late 20th century warming spell.
We are now seeing more equatorward zonal jets and increasing cloudiness with the less active sun.
The difference between MWP and LIA air circulation patterns was similar but more pronounced.
Ignore it if you will but there is a clear case for the sun to answer.
Whoops.
Should read:
” We are now seeing more equatorward meridional jets and increasing cloudiness with the less active sun”.
“there are two sunspot series in circulation. The Official [or International Sunspot Number – which has the Waldmeier problem] and the Group Sunspot Number suggested by Hoyt and Schatten.”
Imagine solar scientists counting teenagers’ pimples… LOL
@Alec – If you think a GCM would confirm your ideas, why don’t you just run it yourself? I’m pretty sure all the code and data are freely available, so don’t even have to break your word to use them. You’re an IPCC AR5 reviewer, right? You’ve got climatology and data chops, right? Just run the thing yourself, and publish the answer here, and then in Science, Nature, GRL, etc.
Leif Svalgaard says:
“Since the first ones didn’t work one apparently has to look around for something else, ignoring the falsification.”
Ignoring the falsification would be to NOT look around for something else, kind of like the CAGW crowd refusing to look at anything else even though the models exaggerate warming, i.e.: failed.
Did they write 320% sea level rise? Tell me they are joking. A strict interpretation would have the oceans up by 18,000 * 3.2 WOW, we’d all better get on NUCLEAR POWERED AIRLINERS for the rest of our lives! EVERYTHING will be covered. Tell me it ain’t so that so called “experts” are this dull and slow to make a trivial mistake such as this. (Wait, NO, remember the Himalyan glaciers gone in 35 years? WHOOPS, “typo”, (by 17 times)..we meant 350 years…remember that?)
Stephen Wilde says:
January 10, 2013 at 7:45 am
” We are now seeing more equatorward meridional jets and increasing cloudiness with the less active sun”.
Actually not: http://www.leif.org/research/Cloud-Cover-GCR-Disconnect.png
Let me see if I have “boiled this down” correctly:
1. Climate scientists claim that if CO2 concentration in the atmosphere were to remain at current “elevated” levels (around 400ppm) with no further increase, we would still have “warming in the pipeline” so continued warming would be expected even though the CO2 concentration leveled off.
2. Climate scientists claim that even if solar activity was very high from 1920 – 2000 compared to historical norms, the solar activity was statistically “level” throughout this 80 year time period, so after the initial increase in activity around 1920, all warming would have been essentially instantaneous, and there would have been no further “warming in the pipeline after an initial burst.
So, apparently they would have us believe that if variable A remains at an ELEVATED BUT CONSTANT LEVEL, warming will continue, but if variable B remains at an ELEVATED BUT CONSTANT LEVEL, warming will cease after an initial burst.
Yeah, ok….
So, what I think Alec is basically saying is that since the above claims in #1 and #2 are directly contradictory, one of the two claims MUST BE WRONG, and yet the “climate scientists” claim that both #1 and #2 are correct statements, which means that the “climate scientists” are talking nonsense.
Is that about right?
crosspatch says:
January 9, 2013 at 9:10 pm
“The duration and magnitude of warming from 1910 to 1940 was very close to the duration and magnitude of warming from 1975 to 2005. The first episode of warming happened when CO2 emissions could not have possibly been the cause.”
There’s more, crosspatch: If CO2 were forcing elevated warming in the latter period, then the 1975 to 2005 series should differ, i.e. be longer and stronger. If not, then CO2 rise is not a central factor in the warming. Do we have earlier stretches in the 1800s of the same magnitude and duration – this would definitely falsify the CO2 role as the major actor.
John West says:
January 10, 2013 at 8:44 am
Ignoring the falsification would be to NOT look around for something else
This is a valid argument if you assume a priori that the must somehow be the cause. Otherwise not.