Guest Post by Willis Eschenbach.
For all of its faults, the IPCC (Intergovernmental Panel on Climate Change) lays out their idea of the climate paradigm pretty clearly. A fundamental part of this paradigm is that the long-term change in global average surface temperature is a linear function of the long-term change in what is called the “radiative forcing”. Today I found myself contemplating the concept of radiative forcing, usually referred to just as “forcing”.
So … what is radiative forcing when it’s at home? Well, that gets a bit complex … in the history chapter of the Fourth Assessment Report (AR4), the IPCC says of the origination of the concept (emphasis mine):
The concept of radiative forcing (RF) as the radiative imbalance (W m–2) in the climate system at the top of the atmosphere caused by the addition of a greenhouse gas (or other change) was established at the time and summarised in Chapter 2 of the WGI FAR [First Assessment Report].

Figure 1. A graph of temperature versus altitude, showing how the tropopause is higher in the tropics and lower at the poles. The tropopause marks the boundary between the troposphere (the lowest atmospheric layer) and the stratosphere. SOURCE
The concept of radiative forcing was clearly stated in the Third Assessment Report (TAR), which defined radiative forcing as follows:
The radiative forcing of the surface-troposphere system due to the perturbation in or the introduction of an agent (say, a change in greenhouse gas concentrations) is the change in net (down minus up) irradiance (solar plus long-wave; in Wm-2) at the tropopause AFTER allowing for stratospheric temperatures to readjust to radiative equilibrium, but with surface and tropospheric temperatures and state held fixed at the unperturbed values.
In the context of climate change, the term forcing is restricted to changes in the radiation balance of the surface-troposphere system imposed by external factors, with no changes in stratospheric dynamics, without any surface and tropospheric feedbacks in operation (i.e., no secondary effects induced because of changes in tropospheric motions or its thermodynamic state), and with no dynamically-induced changes in the amount and distribution of atmospheric water (vapour, liquid, and solid forms).
So what’s not to like about that definition of forcing?
Well, the main thing that I don’t like about the definition is that it is not a definition of a measurable physical quantity.
We can measure the average surface temperature, or at least estimate it in a consistent fashion from a number of measurements. But we can never measure the change in the radiation balance at the troposphere AFTER the stratosphere has readjusted, but with the surface and tropospheric temperatures held fixed. You can’t hold any part of the climate fixed. It simply can not be done. This means that the IPCC vision of radiative forcing is a purely imaginary value, forever incapable of experimental confirmation or measurement.
The problem is that the surface and tropospheric temperatures respond to changes in radiation with a time scale on the order of seconds. The instant that the sun hits the surface, it starts affecting the surface temperature. Even hourly measurements of radiative imbalances reflect the changing temperatures of the surface and the troposphere during that hour. There is no way that we can have the “surface and tropospheric temperatures and state held fixed at the unperturbed values” as is required by the IPCC formulation.
There is a second difficulty with the IPCC definition of radiative forcing, a practical problem. This is that the forcing is defined by the IPCC as being measured at the tropopause. The tropopause is the boundary between the troposphere (the lowest atmospheric layer, where weather occurs), and the stratosphere above it. Unfortunately, the tropopause varies in height from the tropics to the poles, from day to night, and from summer to winter. The tropopause is a most vaguely located, vagrant, and ill-mannered creature that is neither stratosphere nor troposphere. One authority defines it as:
The boundary between the troposphere and the stratosphere, where an abrupt change in lapse rate usually occurs. It is defined as the lowest level at which the lapse rate decreases to 2 °C/km or less, provided that the average lapse rate between this level and all higher levels within 2 km does not exceed 2 °C/km.
This is an interesting definition. It highlights that there can be two or more layers that look like the tropopause (little temperature change with altitude), and if there is more than one, this definition always chooses the one at the higher altitude.
In any case, the issue arises because under the IPCC definition the radiation balance is measured at the tropopause. But it is very difficult to measure the radiation, either upwelling or downwelling, at the tropopause. You can’t do it from the ground, and you can’t do it from a satellite. You have to do it from a balloon or an airplane, while taking continuous temperature measurements so you can identify the altitude of the tropopause at that particular place and time. As a result, we will never be able to measure it on a global basis.
So even if we were not already talking about an unmeasurable quantity (radiative change with stratosphere reacting and surface and tropospheric temperatures held fixed), because of practical difficulties we still wouldn’t be able to measure the radiation at the tropopause in any global, regional, or even local sense. All we have is scattered point measurements, far from enough to establish a global average.
This is very unfortunate. It means that “radiative forcing” as defined by the IPCC is not measurable for two separate reasons, one practical, the other that the definition involves an imaginary and physically impossible situation.
In my experience, this is unusual in theories of physical phenomena. I don’t know of other scientific fields that base fundamental concepts on an unmeasurable imaginary variable rather than a measurable physical variable. Climate science is already strange enough, because it studies averages rather than observations. But this definition of forcing pushes the field into unreality.
Here is the main problem. Under the IPCC’s definition, radiative forcing cannot ever be measured. This makes it impossible to falsify the central idea that the change in surface temperature is a linear function of the change in forcing. Since we cannot measure the forcing, how can that be falsified (or proven)?
It is for this reason that I use a slightly different definition of the forcing. This is the net radiative change, not at the troposphere, but at the TOA (top of atmosphere, often taken to mean 20 km for practical purposes).
And rather than some imaginary measurement after some but not all parts of the climate have reacted, I use the forcing AFTER all parts of the climate have readjusted to the change. Any measurement we can take already must include whatever readjustments of the surface and tropospheric temperatures that have taken place since the last measurement. It is this definition of “radiative forcing” that I used in my recent post, An Interim Look at Intermediate Sensitivity.
I don’t have any particular conclusions in this post, other than this is a heck of a way to run a railroad, using imaginary values that can never be measured or verified.
w.
Mathematically yes, practically no. Which way is the energy flow?
Actually more the point how does the temperature gradient from ground to cloud look do you think?
Greg House says:
December 20, 2012 at 9:11 pm
That is exactly what the phrase reaching the top of the atmosphere directly facing the Sun means. You need to read a textbook instead of the high level summary on the NASA page. General science pages tend to not use phrases like “normal to the surface” because too many people won’t understand it. Consider a round disk in space and a line between the center of the disk and the Sun. If the disk is oriented at right angles to that line, we say that the line is “normal” to the plane of the disk. Now change the angle between the plane of the disk and the line. When you look at the circular disk from the Sun, it will now have the apparent shape of an ellipse. The area of that ellipse will be smaller than the area of the disk. The question is – Will the disk still get the same number of watts per unit area that it received when it was oriented normal to the line between the Sun and the disk? It should be obvious that the amount of sunlight per unit area decreases as the disk is tilted. Typically, the new value is computed by taking the amount of energy available, dividing by the area of the disk, and multiplying by the area of the ellipse seen from the Sun.
That refers to the total amount of energy available to objects the same distance from the Sun as the Earth. The word “total” is usually meant with respect to what is available at the surface. In other words, the amount at the surface is the total available amount minus what is absorbed in the atmosphere and reduced by an amount related to the angle between the local surface normal and the position of the Sun. Sometimes, the word “maximum” is used to stress that nothing that occurs in the atmosphere can increase that amount of energy above that value.
The reason the energy shown in most diagrams is one fourth the energy at the top of the atmosphere is two fold.
* The Earth is a sphere
* The Earth rotates
Yesterday I had a mug of hot coffee sitting on my desk in one of those insulated flask mugs. Unfortunately I left it there too long and it had got cold. I guess it took about half an hour to get cold. It started off at about 70Celsius I guess and within 2000seconds the water got cold. I did some calculations in miyt head and came to the conclusion that a body of water 1sqm in area heated to the same temperature would be losing something like 10,000watts/sqm, of that order.
Now that’s a high rate of loss but a coffee mug is nowhere near thermal equilibrium with the air. The heat from the mug is dispersing into the air and just a meter up you can’t feel the heat anymore. You could argue that it isn’t very well constrained to stay in a single column of air, but consider cars in a traffic jam – each engine is at about 70Celsius but if you are on a bridge over the traffic jam you can’t really feel the extra heat.
What the previous paragraph tells me is that the daytime heating of land and sea by the sun doesn’t really heat up the atmosphere that much. The atmosphere really just smooths the heat out from day to night just as the ocean does. There’s just too much of it for the heating of just one day to make much difference to the temperature of the troposphere. When I go skiing in the Alps the valley can be at +25Celsius but at 3000m up you don’t see much melting of the ice due to all this extra heating – the lapse rate of the air just shrugs it off.
Then I turned this idea on its head. I thought “if the hot coffee is losing heat at a rapid rate but gives me a steep temperature gradient through the air, what does that tell me about how much power is being lost through the air if the temperature gradient is very low?” Another calculation showed a very low rate of heat energy loss by this means – as you would expect if you have a low temperature gradient there just isn’t enough “ooomph” to get a lot of heat flow. A few watts/sqm.
What this tells me is that actually the atmosphere on its own would boil us all alive if there was no other cooling path. This has nothing to do with greenhouse gases. Just the sheer quantity of atmosphere causes a temperature gradient to build across it that means the temperature gradient is very low and you can’t get much heat flow through it. Fortunately the heat from the Earth can simply flow directly to space. Essentially the mechanism for keeping the Earth warmer than expected is simply photonic energy reaching land and sea directly but then be impeded in its escape by a vast body of air where greenhouse gasses are actually pretty irrelevant because most of the “cooling” is actually due to convection and so the Earth needs to reach a hotter equilibrium point in order to emit most of its heat energy by direct IR to space.
Trenberth’s “missing heat” from satellite measurements isn’t due to extra heat being stored in the deep oceans it is simply that the observations are difficult to do sufficiently accurately (especially if you are looking to find heat trapped by CO2 in a mechanism that doesn’t exist).
Willis says at 12/20, 7:32:
“Regarding variations in the DLR, what kind of variations were you expecting? All of them have diurnal variations on the order of 80-100 W/m2. It’s difficult to say what the average might be for any of them without downloading the data. I see some that vary maybe 320-420 W/m2, average maybe 370, and others that vary 290-370 or so on the same day, average maybe 330.”
Not so, Willis; that’s what bugs me. Look at all sites on July 15, 2012, for example. ALL SITES show DW IR of about 400 +/- 25 w/m2 DAY AND NIGHT! That’s weird, considering the enormous variation between the sites in terms of amounts of GHG (water vapor), altitude, latitude, temperature, sun/no sun, etc.. I don’t understand it at all.
This would be an interesting experiment: heat up one-square-foot cubes of iron and balsa wood at 300C until the temperature of both is stable as measured with an IR thermometer. Let them sit for ten minutes, then I’ll put my bare hand on the balsa wood and an academic climatologist can put his or her hand on the iron block.
Here’s a slight modification which will represent equal storage of thermal energy. Heat up 100-pound blocks of iron and balsa wood at 300C until the temperature of both are stable as measured with an IR thermometer. Let them sit for ten minutes, then I’ll put my bare hand on the 100-pound balsa wood block and an academic climatologist can put his or her hand on the hundred pound iron block.
In both cases, which test subject is more likely to need to visit an emergency room?
Interesting how the temperature of stuff does not tell a full thermodynamic story, eh? Wouldn’t we conclude from this that it’s very important to know what substance is doing the radiating? Further, might we not conclude that whatever radiates from air to land is irrelevant with regard to the surface temperature?
Greg House says:
December 20, 2012 at 9:11 pm (Edit)
Many thanks for your explanation, Greg. Let me say in front that I am happy to answer your questions.
Rather than focus on the words of one person at NASA, lets develop the TSI from first principles.
The amount of sun reaching the earth is related to a couple things—the distance from the sun to the earth and the luminosity (brightness) of the sun. This makes sense, because the TSI decreases with distance from the sun and increases with the luminosity of the sun.
The formula to calculate TSI is simple.
TSI = L / (4 Pi A2)
where L is the luminosity of the sun, 3.84e+26 Watts, and A is the unit distance from the sun to the earth, 1.50e+11 metres. Since A gets squared, the answer is in watts per square metre.
What we are doing here is just total solar energy divided by total area at the distance of the earth, to get the energy per unit area (square metre) at the orbit of the earth. The area is the area of a sphere with a radius equal to the distance from the earth to the sun, which is 4 Pi A2.
When we substitute, we get
TSI = 3.84e+26 W / (4 * 3.1416 * (1.5e+11)2)
which simplifies to 1,364 W/m2. Note that this is perpendicular to the sun, as it is measured on a sun-centered sphere whose radius is the distance from the earth to the sun. In other words, your speculation about what NASA meant by “average” is incorrect, and a plain reading of the NASA text suffices. The TSI is about 1360 W/m2 measured on a surface perpendicular to the sun.
Can’t say why NASA does what they do, you’ll have to ask them about that. I have shown you upthread the calculation to go from the 1,364 W/m2 TSI, to the TSI averaged over the whole surface of the earth. I note that no one has found any problems with that calculation, which is total energy intercepted by the earth, divided by the total area of the earth.
If you don’t calculate it as energy divided by area, how else are you planning to calculate solar per unit area of the planet?
As to “experimental proof of back radiation”, say what? I’ve been posting graphs of actual measurements of “back radiation” (DLR) over a 24 hour period. I am stunned that you still sit there and fatuously claim there is no “experimental proof” that DLR exists, when it is measured daily by scientists all over the world … you really are going a long ways off the path to try to establish that you are right, including totally ignoring scientific measurements of DLR made by lots and lots of folks.
Go back and look at the calculation of the average power. I use this mysterious thing called “mathematics”. I take the total amount of solar energy intercepted by the planet, and divide it by the ENTIRE SURFACE AREA OF THE PLANET, using the following magical incantation:
Average energy per unit area = total energy / total area.
Study that staggeringly complex formula for a while, and you’ll see that I have indeed given you the average sunlight over the total surface of the planet, and that I have absolutely NOT done what you say, to “consider only half of the earth to receive solar power).
Ryan said:
December 18, 2012 at 4:57 pm
This is supposed to be news? The lengths of the two sides of a rectangle are A and B. The area is A * B = AB.
The average of A and B is (A+B)/2. When we square that, we get (A2 + 2AB + B2)/2.
And yes, (A2 + 2AB + B2)/2 is not equal to AB. We’ve definitively shown that bad math gives wrong answers. So what?
Ryan has proven that to get the area of a rectangle, you can’t average the sides and square them. Whoa, Greg, that’s heavy, man … you also can’t take the square root of the sides and square them to get the area. And you can’t take the difference of the sides and square them to get the area, or the logarithms of the sides, or the sum of the sides.
All of which proves, I suppose, that “playing with square roots and logarithms and subtraction and addition is not a good idea in non-linear systems”.
Hey, playing with anything in non-linear systems if you are not a mathematician is always a mistake, step back from the equations and nobody gets hurt … but what does that have to do with averages and logarithms and addition?
Actually, Greg, all Ryan has shown is that to get the area of a rectangle, the correct formula is A times B, and guess what? If you use any other formula, you get a wrong answer … whoa, shocking news, huh? He has conclusively proven is that if you use averages incorrectly, you will get an incorrect answer …
That is the weakest argument against using averages that I’ve ever heard, by an order of magnitude, which is why I forbore commenting earlier, from a sense of mercy. There are valid strong arguments against using averages, particularly in responsive governed systems like the climate, but Ryan’s argument is not one of them.
Thanks for being clear about your issues, Greg, it helps a lot.
w.
Ryan says:
December 21, 2012 at 2:18 am
Ten thousand watts per square metre? That makes my bad number detector ring like crazy. Let’s run the calculations (details in the appendix).
A cup of coffee is usually about 8 ounces, or half a pound, or about 226 grams.
The specific heat of water is about 4.186 joules/gram/kelvin
The change from hot to cold coffee is about 50 kelvin.
That means that the coffee loses about 47,500 joules as it cools 50K in 2,000 seconds, or about 24 joules per second … which is also 24 watts, since a watt is a joule per second.
Now, I figured the coffee to be in a cylinder about 10 cm tall and 10 cm across. This gives a surface area of about 0.047 square metres.
Dividing that into the watts to give us watts per square metre, we find that the coffee cup is losing heat, not at the claimed rate of ten thousand watts per square metre, but about 500 watts per square metre. You are wrong by more than an order of magnitude.
Ryan, I have to tell you that I have stopped reading your post at that point. Why?
Because a man who wants to do the math in his head, doesn’t bother checking it with Excel, gets it horribly wrong, and then wants to lecture me on the startling conclusions revealed by his math, that man is not worth my time to read.
I knew your numbers were bad on my first glance … and the fact that you did not notice that, didn’t bother to check, and then spun a whole story out of your results, tells me a lot. I don’t have a lot of time, so I want to concentrate on people who are paying attention to the details … and that’s clearly not you.
One of the lessons I have learned (to my cost) is that when a number seems way high or way low, maybe it’s not, but I damn well better check it. The same is applicable on the other end of the scale, when a number seems too good to be true, it likely is. I’ve been bitten too often by both of those bugs.
w.
NOTE: Here’s the values for the calculation
jae says:
December 21, 2012 at 6:28 am
Jae, you might try this. Go to the setup page. Run the various locations for 15 July again, and this time, instead of just getting the graph for downwelling longwave radiation, get the air temperature as well (right column).
You’ll see that the air temperature for all of the locations is roughly similar, they run from about 20°C to about 30°C, some a bit higher, some a bit lower. Remember that we can take an effective radiation altitude of half a km, and that the temperature drop with altitude is about 1°C per hundred metres. That means the air half a km up will be about 5°C cooler than at ground level. This gives air temps at altitude running from around 15°C to 25°C.
S-B radiation for those temperatures assuming gray body (emissivity = 0.95) gives equivalent radiations of 371 W/m2 and 426 W/m2 …
Which is about what you said for that day, 400 ± 25 W/m2.
Finally, remember that even a doubling of CO2 is only supposed to add 4 W/m2 or so, and when the total longwave signal is 400 W/m2, that’s only 1%.
w.
Willis Eschenbach says, December 21, 2012 at 9:52 am: “As to “experimental proof of back radiation”, say what? I’ve been posting graphs of actual measurements of “back radiation”[…]
====================================================
Willis, this is unfortunately another example of a “straw man argument”. I never said or asked anything about an “experimental proof of back radiation”.
It was about apparent absence of experimental proof of “WARMING/(slowing down cooling) via back radiation”. I hope you will understand the difference.
Ken Coffman says:
December 21, 2012 at 9:37 am
Ken, as a man who both utilizes and enjoys thought experiments, thank you for yours.
You are correct that equal temperature or equal amounts of radiation doesn’t mean other things are equal. That’s no surprise, there are various things that we can measure regarding temperature. We can measure total heat in an object, for example. We can measure its thermal conductivity, which you have implicity measured by placing your hand on the two blocks. These are independent properties of the material.
Now, thermal conductivity is a property of the material itself, one which is not affected by temperature. Steel conducts the heat to your hand rapidly. Balsa wood doesn’t. This is true whether they are hot or cold.
So you are right, there’s a host of different things that you’d need to tell the “full thermodynamic story”. But here’s the part you are overlooking. All those things like the one you list have nothing to do with radiation.
The only things that you need to know to determine the radiation are the emissivity and the temperature of the object. Period. The material it’s made of makes absolutely no difference. I first learned this when I was studying blacksmithing. My book pointed out that you can tell the temperature of steel by the color. Deep red is coolest, then cherry red, then yellow, then orange, then white.
The book also pointed out what seemed odd to me at the time. This was that it doesn’t matter in the slightest what the metal is. Blood red is about 1200°F (650°C) whether you are heating steel or copper or tin or whatever.
Thermal radiation at lower temperatures is just the same. It’s a function of the temperature and the emissivity, not of the thermal mass or the type of material or the amount of heat contained in the material or any other variable.
So when you say:
No, it’s no more important than whether steel or tin is doing the radiating, because the result is the same. My desk’s radiation only depends on temperature and emissivity, not on it being wood or how heavy it is or its thermal conductivity or mass.
Finally, you say:
Absolutely not. Radiation is real and measurable, and it contains energy. That energy is transferred to whatever absorbs the radiation, regardless of the temperature of the absorbing object.
Remember that this is a flow of energy, not a flow of heat. Heat is the net energy flow. So if a hot object is absorbing 400 W/m of radiation, say radiation from my desk, and that same hot object is radiating at 600 W/m2, there will be a net flow of radiant energy from the object to my desk.
Here’s the thing. If there is radiation from objectA to objectB, that means that objectB is in sight of objectA. But that also means that you can see objectA from objectB, so objectA must be absorbing radiation from objectB. It is the NET of these two energy flows that is the flow of heat.
Note that the radiation doesn’t care about the temperature of the object it hits. Radiation from a cooler object is absorbed by a hotter object. People think this violates the 2nd Law. But if you remember that they both radiate to each other, there must be a larger radiant energy flow from the hotter object to the cooler object.
As a result, although there is a radiant energy flow from cool to hot, the heat only flows from hot to cold, and there is no 2nd law violation.
People also ask, if the global average background radiation is 340 W/m2, why can’t I boil water with it? The problem is, you’ll never be able to get anything warmer than the point at which it is radiating 340 W/m2. At that point it is radiating away the 340 W/m2 it is absorbing, so it will warm no further … and 340 W/m2 is down near freezing.
People ask, how about getting mechanical work out of the radiation? Couldn’t it run a heat engine? Sure, but to do that, you need to have a colder place to reject the waste heat. Heat engines don’t run on temperature. They run on temperature differential. Where will you reject the heat if the hot end of your engine is around freezing?
People ask, how about something like a photoelectric cell? The problem is, the radiation doesn’t have enough energy in it to knock an electron out of its easy chair … so the photoelectric effect just doesn’t occur with thermal IR in the temperature range we’re talking about in any known materials.
Anyhow, I tend to ramble, but there’s a lot of misinformation out there on this subject.
My best to you,
w.
Greg House says:
December 21, 2012 at 4:46 pm
Greg, your suspicion is misplaced. It is not a straw man argument, I don’t deal in straw. Instead it is what goes by the technical name of a “misunderstanding”.
I took the interpretation I did because I truly couldn’t conceive that your argument was actually that
a) back radiation exists, but
b) it doesn’t transfer energy to the surface when it is absorbed.
I figured if you didn’t think DLR transfers energy to the surface, you must believe it doesn’t exist. Because if it exists, as it seems you are saying, I don’t understand where you think the energy goes when the radiation is absorbed by the surface.
If you want experimental proof that the surface end up warmer with DLR than without, because DLR transfers energy to the surface, consider that the oceans are liquid. I ascribe that to the ~ 340 W/m2 of DLR that is absorbed by the ocean … if you have another explanation for where the 340 W/m2 necessary to prevent the oceans from freezing is coming from, bring it out.
All the best,
w.
Willis Eschenbach says, December 21, 2012 at 9:52 am: Actually, Greg, all Ryan has shown is that to get the area of a rectangle, the correct formula is A times B, and guess what? If you use any other formula, you get a wrong answer … whoa, shocking news, huh? He has conclusively proven is that if you use averages incorrectly, you will get an incorrect answer …
That is the weakest argument against using averages that I’ve ever heard, by an order of magnitude, which is why I forbore commenting earlier, from a sense of mercy.
==========================================================
Mercy? Well, I see mercy actually on the Ryan’s side. But OK, if you wish, let us get a little bit deeper into that thing about averages.
One of the problems of that bogus calculation of “Earth without atmosphere” temperature is the extraction of average temperature from average radiation. This is a blunder, unacceptable even on junior high school level. The point is, that in reality you can have different average temperatures produced by the same average radiation. I guess, you do not understand that, and neither do many other “climate scientists”, so let us come back to the Ryan’s example to illustrate that point.
Let us say, the “average side” of two squares is 5. Is it possible to extract from that the “average area” of those two squares? No problem for a climate scientist, I guess, his calculation would be 5×5=25. Note this 25.
It is apparently possible that the sides of our two squares are 1 and 9 (the average is still the same 5). Now look at the areas, the are 1×1=1 and 9×9=81. The average of 1 and 81 is (1+81)/2=41. Note this 41.
So, the correct average area for our two squares is 41, the result “climate science” would get is 25. The difference is enormous.
Now, you can also take 2 and 8 as the sides of our two squares (the average is still the same 5), the the average area will be (2×2 + 8×8)/2=34. Still different from 25 and different from 41 as well. So, you can see, from the same “average side of a square” you can produce different “average areas”.
I am just curious, is basic math knowledge not required from climate scientists? Anyway, I hope we have identified the problem with extracting average from average in that bogus calculation of “Earth without atmosphere” temperature.
Willis Eschenbach says, December 21, 2012 at 5:30 pm: It is not a straw man argument, I don’t deal in straw. Instead it is what goes by the technical name of a “misunderstanding”.
I took the interpretation I did because I truly couldn’t conceive that your argument was actually that
a) back radiation exists, but
b) it doesn’t transfer energy to the surface when it is absorbed.
[…]If you want experimental proof that the surface end up warmer with DLR than without … consider … I ascribe that to … if you have another explanation …
==========================================================
And yet we have another example of a
strawmisunderstanding. I did not say that either. Again, I said: “It was about apparent absence of experimental proof of “WARMING/(slowing down cooling) via back radiation”. I hope you can understand the difference now.What you ascribe to what and how you explain it is not an experimental proof of “WARMING/(slowing down cooling) via back radiation, I hope we can agree on that.
We do not want to twist, squeeze and otherwise torture the notion of “experimental”, do we?
Willis sez (finally):
“jae, you might try this. Go to the setup page. Run the various locations for 15 July again, and this time, instead of just getting the graph for downwelling longwave radiation, get the air temperature as well (right column).”
Well, W, been there, done that already, many times. I don’t think you are getting my point. First of all, the temperature variations are WAY wider than you state, and, more importantly, we are comparing areas which differ wlith respect to GHGs by 2-3 times, WITHOUT ANY SIGNIFICANT CHANGE IN DOWNWARD RADIATION!. Just where is there some indication of a GHE effect in this data? I’m right back at the Phoenix/Atlanta comparison–If GHGs dominate, then Atlanta should be MUCH hotter than Phoenix. But it is much cooler. WHY?
I got a conundrum, too, W!
Willis: BTW, my conundrum is bigger and better than your conundrum! 🙂
Greg House says:
December 21, 2012 at 5:55 pm
Thanks, Greg, but I don’t wish that in the slightest. Ryan made an incorrect and frankly ridiculous argument against averages, which was that if you used averages incorrectly, you got wrong answers. Seriously, that was his whole argument …
…
…
I refrained from commenting on it, I didn’t want to bust his bubble. You requested that I comment on it. I did so, as you quote above. I notice that you have refrained from commenting on the substance of my objections. Instead of even acknowledging that the insights you recommended to me about averages had turned out to be substance-free, suddenly you wish to investigate averages.
What in any of that makes you think that I wish to “get a little bit deeper into that thing about averages”? I have no such desire, in fact, quite the opposite—I actively want to stay out of that discussion. It is difficult enough making progress on the topics already in hand, thanks.
w.
jae says:
December 21, 2012 at 6:36 pm
Aw, go soak your head with your damn “(finally)”. I have a life, I have a wife, and a daughter visiting for Christmas, I have a day job, I have other interests. I spent today taking care of my blind 85-year-old father in law. So you can stuff your “(finally)” in that part of your pelvic anatomy where the TSI is zero.
We now return you to your regularly scheduled science programming …
w.
Willis Eschenbach says, December 21, 2012 at 9:52 am: “Rather than focus on the words of one person at NASA, lets develop the TSI from first principles. The formula to calculate TSI is simple.
TSI = L / (4 Pi A2) where L is the luminosity of the sun, 3.84e+26 Watts, and A is the unit distance from the sun to the earth, 1.50e+11 metres.
… we get TSI = 3.84e+26 W / (4 * 3.1416 * (1.5e+11)2) which simplifies to 1,364 W/m2. Note that this is perpendicular to the sun, as it is measured on a sun-centered sphere whose radius is the distance from the earth to the sun.”
===========================================================
Really? I was just about to believe you, Willis, but then one expression you used struck me: “it is measured”. Then I thought, why would Willis talk about “measured TSI” after he presented a pure calculation of that TSI? This is a contradiction. And contradictions, you know, are signs of, let us say, errors.
So I asked myself, how do they know how much the luminosity of the Sun (L) is? Yeah, this is easy: they calculate it based on TSI! Like that: L=(4 Pi A2)TSI . (http://en.wikipedia.org/wiki/Solar_luminosity)
That is nice. The luminosity of the Sun is derived from TSI, and TSI is derived from the luminosity of the Sun!
Congratulations, Willis, this is an outstanding example of a logical fallacy called “circular reasoning” (http://en.wikipedia.org/wiki/Circular_reasoning). Thank you.
So, here we are again. You provided the NASA link, not me, and according to it there is no scientific reason for your “disk” interpretation, it is hemisphere, and your cutting solar power in half is still an error.
Willis Eschenbach says, December 21, 2012 at 7:36 pm: What in any of that makes you think that I wish to “get a little bit deeper into that thing about averages”?
==========================================================
Willis, my expression “But OK, if you wish, let us get a little bit deeper into that thing about averages” was rhetorical and was connected to your failure, as I saw it, to understand the point of Ryan’s about the false extracting average from average concerning radiation and temperature.
Even if you do not care, the readers still might be interested.
jae says:
December 21, 2012 at 6:36 pm
To recap the bidding, Jae is objecting to this statement of mine about the temperature variations:
So, I did what most folks somehow never get around to doing. I downloaded the data. Here’s the results:
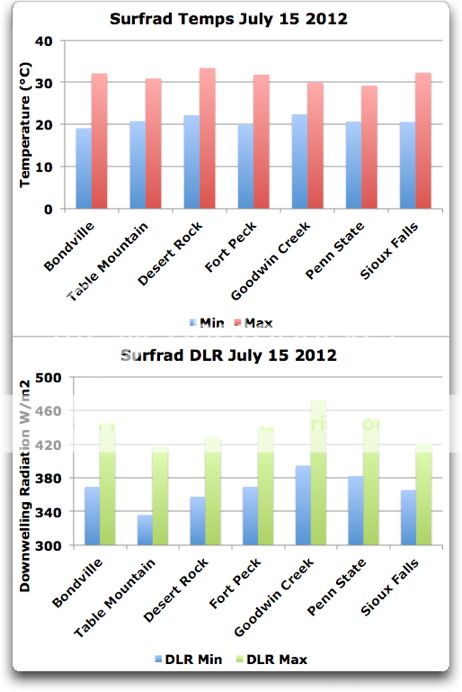
As you can see, the low temperatures are clustered around 20°C and the high temperatures around 30°C, as I said.
I see significant changes in the radiation. The minimums vary from 336 to 396, a difference of 60 W/m2 and the maximums vary from 417 to 472, a difference of 55 W/m2. A doubling of CO2 is slated to cause 3.7 W/m2 change in forcing, this has a difference of 50 or 60 W/m2, and you think there should be even more variation …
This is why I asked you what kind of signal you were expecting.
All the best,
w.
Greg House says:
December 21, 2012 at 8:17 pm
Oh, man, now you’re going to pick on one word? Mea maxima culpa, replace “measured” with “calculated”. Can you focus in the issues now?
I give up, Greg. I’m done. I cry uncle, I surrender. I’m going to leave you in sole possession of the field. You are determined to believe what you want to believe, in spite of the fact that the various college textbooks and online resources say the same thing—that the TSI is ~ 1368 W/m2, and that averaged over the surface, that’s 342 W/m2. You could google it and get a raft of citations, but instead you insist on hanging on to your twisted interpretation of a single NASA web page. I’ve tried a host of ways to explain it to you, as have others. You remain unmoved, not the slightest change in your position. And unfortunately, you seem to interpret that immobility as a virtue, rather than seeing it for what it is, a refusal to learn …
You are free to believe anything you want, Greg. Just don’t expect me to pay any further attention to your ideas and claims. I’ve tried that, didn’t work, you simply blew me and my ideas off entirely. I’m returning the favor.
Sadly,
w.
Greg House says:
December 21, 2012 at 8:28 pm
Speculation about what I might wish is never rhetorical. Instead, it was a (likely subconscious) attempt to shift responsibility for the change in subject (to averages) onto my shoulders. It was a subtle rhetorical flourish, to convince the reader that you are being generous and complying with my wishes in changing the subject.
In fact, that wasn’t my desire at all. YOU wanted to change the subject, not me, I had no wish to do so. Sorry, but it was your idea, and trying to pawn it off on me won’t wash.
Yeah, I notice they’re beating down your door to discuss it …
w.
PS—Ryan’s claim was that the use of averages was suspect because you can make mistakes with them, viz:
Ryan says:
December 18, 2012 at 4:57 pm
Indeed, you can make mistakes with averages, as he illustrates. So what? You can also make mistakes with addition, and with square roots. So what? Does that mean that playing with addition is not a good idea in non-linear systems? Making mistakes is a problem in any system.
Bottom line for me is that until Ryan or you or someone demonstrate that I am actually making mistakes with the averages, we don’t have much to discuss …
Willis says……”someone demonstrate that I am actually making mistakes with averages,we don’t have much to discuss”
The figure of 1360w/sq.m is a YEARLY global AVERAGE. It is the only real measurement of incoming solar incoming radiation we have .It is a bulk amount which cannot be divided. It is the net amount from a sun that flickers. It actually is irrelevant wherefrom ie from what direction this energy comes from .; regard it coming from all directions in space if you want because the sun also shines over your head at night-time when dealing with this average. A YEARLY AVERAGE. and it has to remain simply as that. Forget about Cosine of this , angle of that, Throw away your slide-rule ,distance calculations, size calculations ,even area calculation (because this has been standardised at the TOA and Earth;s surface as 1 sq.m.) and concentrate on this net bulk amount. This real and measured net bulk amount has to remain simply as that and that then attenuates down to a real and measured yearly global average of about 340w/sq m at the surface.
There’s nothing much more in the way of discussion I can offer other than that Willis.but there is the mistake you are making with averages. You don’t need to answer if you’re still not talking to me. 😉
Mack says:
December 22, 2012 at 4:18 am (Edit)
Not true in the slightest. We have satellites that measure incoming solar radiation 24/7.
That sentence has no meaning I can discern.
Umm … errr … not much I can say about that, because it doesn’t make sense. Cosine of this? Angle of that? Attenuates down? IIRC, I said nothing about either cosines, angles, or attenuation, so I fear I can’t comment..
Whoa, back up there. You say “there is the mistake you are making with averages” … but where? What is the mistake? You seem to have skipped over the part where you quote my words and show me that they are wrong.
Simple instructions, Mack. If you want to bust me for any of my manifold sins of commission, omission, or emission, here’s the steps:
1. Find where you think I made a mistake.
2. Quote what I said that you think is in error, with a link to the original.
3. Demonstrate, through math, logic, citations, authorities, and the like, just exactly why you think I’m wrong.
A vague ramble followed by some handwaving on the order of ‘thereis the mistake you are making with averages’, without saying just where “there” might be located, just doesn’t cut it.
Regards, thanks for the reply,
w.
Thanks for all the effort, Willis. I really appreciate it.
Notice the generally inverse relationship between temperature and downwelling IR. Just like Phoenix vs. Atlanata. Why is this, I wonder?