Guest Post by Willis Eschenbach.
For all of its faults, the IPCC (Intergovernmental Panel on Climate Change) lays out their idea of the climate paradigm pretty clearly. A fundamental part of this paradigm is that the long-term change in global average surface temperature is a linear function of the long-term change in what is called the “radiative forcing”. Today I found myself contemplating the concept of radiative forcing, usually referred to just as “forcing”.
So … what is radiative forcing when it’s at home? Well, that gets a bit complex … in the history chapter of the Fourth Assessment Report (AR4), the IPCC says of the origination of the concept (emphasis mine):
The concept of radiative forcing (RF) as the radiative imbalance (W m–2) in the climate system at the top of the atmosphere caused by the addition of a greenhouse gas (or other change) was established at the time and summarised in Chapter 2 of the WGI FAR [First Assessment Report].

Figure 1. A graph of temperature versus altitude, showing how the tropopause is higher in the tropics and lower at the poles. The tropopause marks the boundary between the troposphere (the lowest atmospheric layer) and the stratosphere. SOURCE

The concept of radiative forcing was clearly stated in the Third Assessment Report (TAR), which defined radiative forcing as follows:
The radiative forcing of the surface-troposphere system due to the perturbation in or the introduction of an agent (say, a change in greenhouse gas concentrations) is the change in net (down minus up) irradiance (solar plus long-wave; in Wm-2) at the tropopause AFTER allowing for stratospheric temperatures to readjust to radiative equilibrium, but with surface and tropospheric temperatures and state held fixed at the unperturbed values.
In the context of climate change, the term forcing is restricted to changes in the radiation balance of the surface-troposphere system imposed by external factors, with no changes in stratospheric dynamics, without any surface and tropospheric feedbacks in operation (i.e., no secondary effects induced because of changes in tropospheric motions or its thermodynamic state), and with no dynamically-induced changes in the amount and distribution of atmospheric water (vapour, liquid, and solid forms).
So what’s not to like about that definition of forcing?
Well, the main thing that I don’t like about the definition is that it is not a definition of a measurable physical quantity.
We can measure the average surface temperature, or at least estimate it in a consistent fashion from a number of measurements. But we can never measure the change in the radiation balance at the troposphere AFTER the stratosphere has readjusted, but with the surface and tropospheric temperatures held fixed. You can’t hold any part of the climate fixed. It simply can not be done. This means that the IPCC vision of radiative forcing is a purely imaginary value, forever incapable of experimental confirmation or measurement.
The problem is that the surface and tropospheric temperatures respond to changes in radiation with a time scale on the order of seconds. The instant that the sun hits the surface, it starts affecting the surface temperature. Even hourly measurements of radiative imbalances reflect the changing temperatures of the surface and the troposphere during that hour. There is no way that we can have the “surface and tropospheric temperatures and state held fixed at the unperturbed values” as is required by the IPCC formulation.
There is a second difficulty with the IPCC definition of radiative forcing, a practical problem. This is that the forcing is defined by the IPCC as being measured at the tropopause. The tropopause is the boundary between the troposphere (the lowest atmospheric layer, where weather occurs), and the stratosphere above it. Unfortunately, the tropopause varies in height from the tropics to the poles, from day to night, and from summer to winter. The tropopause is a most vaguely located, vagrant, and ill-mannered creature that is neither stratosphere nor troposphere. One authority defines it as:
The boundary between the troposphere and the stratosphere, where an abrupt change in lapse rate usually occurs. It is defined as the lowest level at which the lapse rate decreases to 2 °C/km or less, provided that the average lapse rate between this level and all higher levels within 2 km does not exceed 2 °C/km.
This is an interesting definition. It highlights that there can be two or more layers that look like the tropopause (little temperature change with altitude), and if there is more than one, this definition always chooses the one at the higher altitude.
In any case, the issue arises because under the IPCC definition the radiation balance is measured at the tropopause. But it is very difficult to measure the radiation, either upwelling or downwelling, at the tropopause. You can’t do it from the ground, and you can’t do it from a satellite. You have to do it from a balloon or an airplane, while taking continuous temperature measurements so you can identify the altitude of the tropopause at that particular place and time. As a result, we will never be able to measure it on a global basis.
So even if we were not already talking about an unmeasurable quantity (radiative change with stratosphere reacting and surface and tropospheric temperatures held fixed), because of practical difficulties we still wouldn’t be able to measure the radiation at the tropopause in any global, regional, or even local sense. All we have is scattered point measurements, far from enough to establish a global average.
This is very unfortunate. It means that “radiative forcing” as defined by the IPCC is not measurable for two separate reasons, one practical, the other that the definition involves an imaginary and physically impossible situation.
In my experience, this is unusual in theories of physical phenomena. I don’t know of other scientific fields that base fundamental concepts on an unmeasurable imaginary variable rather than a measurable physical variable. Climate science is already strange enough, because it studies averages rather than observations. But this definition of forcing pushes the field into unreality.
Here is the main problem. Under the IPCC’s definition, radiative forcing cannot ever be measured. This makes it impossible to falsify the central idea that the change in surface temperature is a linear function of the change in forcing. Since we cannot measure the forcing, how can that be falsified (or proven)?
It is for this reason that I use a slightly different definition of the forcing. This is the net radiative change, not at the troposphere, but at the TOA (top of atmosphere, often taken to mean 20 km for practical purposes).
And rather than some imaginary measurement after some but not all parts of the climate have reacted, I use the forcing AFTER all parts of the climate have readjusted to the change. Any measurement we can take already must include whatever readjustments of the surface and tropospheric temperatures that have taken place since the last measurement. It is this definition of “radiative forcing” that I used in my recent post, An Interim Look at Intermediate Sensitivity.
I don’t have any particular conclusions in this post, other than this is a heck of a way to run a railroad, using imaginary values that can never be measured or verified.
w.
Thanks, jae.
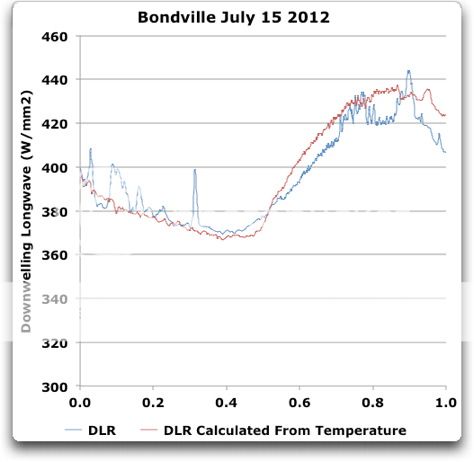
Not sure what you mean by the “inverse relationship between temperature and downwelling IR”. Here’s the situation in Bondville. I show the DLR, and also the DLR calculated from the temperature (using emissivity of 0.95 and a temperature drop to altitude of 5°C).
As you can see, the temperature and the DLR move basically in lockstep, there is no inverse relationship. When SAT goes up, so does the DLR. Not only that, but the DLR follows very closely the theoretical relationship
W = epsilon sigma T4
just as we would expect.
All the best,
w.
Willis:
Thanks again.
No surprise there, but that’s not what I’m trying to get at. I am trying to compare sites with large amounts of water vapor to sites with small amounts to determine whether the GHE (downwelling radiation) from water vapor actually causes an increase in temperature–i.e., if more water vapor, all other things constant, leads to higher temperatures via the GHE. The “inverse relationship” I have noted is BETWEEN sites, not at a single site, like you plotted. Like Phoenix and Atlanta. Phoenix is much hotter, despite having much less GHE from water vapor (the inverse relationship). I think the presence of water (even in vegetation) causes a negative feedback, and I think the data clearly show that. My analyses show that dryer areas are generally hotter than humid areas, when other variables (elevation, latitude, cloudiness) are constant (or nearly so). I think that is due to the heat loss through evaporation and increased haze/clouds. Negative feedback.
Hope I’m making sense here.
Thanks, jae.
I’m not sure that you can pair up sites like that. For starters, I don’t see how you’d account for other factors. For example, Phoenix is underneath the descending part of the Hadley cell circulation, where despite being at the same latitude, Atlanta is not. As a result, Phoenix is bathed in dry, hot descending air.
For that reason, it is both hotter than Atlanta, and the temperature swings are much larger. But that is not a result of the lower water vapor, at least not directly. It is a result of Phoenix getting a constant influx of hot, dry descending air from the Hadley Cell.
So for all of those reasons, rather than look at different sites, I’d look at one site under different humidity conditions.
I don’t see anywhere that there is a continuous record of humidity available at the SURFRAD site, which is a shame. Seems to me the way to investigate the question that interests you would be to look at one site with both DLR and RH records, to see how they co-vary.
Not sure where you’d find such a record, but I’d be interested in your results. Problem with RH is that it is such a local phenomenon, for example when you walk out of the forest and into the field, the RH drops dramatically.
Maybe you could use the “water content” files from the weather satellites to give you a rough look at the RH over a wide area.
Over to you,
w.
A few more thoughts.
If you do want to compare sites in the SURFRAD network, you can’t compare the radiation directly. You have to first subtract out what you expect to find given the temperature. Here’s how I do it.
Get the underlying data from the site, there’s a button on each page. I copy it and paste it into an Excel spreadsheet.
From looking at the map, the driest site seems to be Desert Rock, Nevada. The moistest site seems to be Goodwin Creek, Mississippi.
You can see the difference in the diurnal temperature range. In the desert, there is little moisture, so the earth can cool very quickly. During the day, there are few clouds, so the ground gets hot quickly and continues to warm throughout the afternoon. So the range is wider in the desert than in Mississippi, and the temperature is hotter. Mostly that’s from the difference in clouds, though.
So, I get the data. Then I use Solver in Excel to solve for the best fit.
The relationship between the ground temperature T (kelvins) and the DLR is going to be roughly expressed by:
DLR = sigma epsilon (T-X)4
where sigma is the S-B constant (5.67e-8), epsilon is emissivity, T is surface temperature, and X is how much cooler the effective radiation level is than the ground temperature.
I use Solver to give me the best solution for “X”. To isolate just that variable, I set the emissivity to 0.95, a “greybody”.
In the case I showed above, Bondville, the best fit was with the effective radiation altitude temperature being 5° cooler than the surface.
Now, what would we expect in a very dry place? Since the atmosphere is absorbing less ULR, we would expect the atmospheric temperature to be less. And in fact, when I ran the numbers, Desert Rock, Nevada has an effective radiation temperature of not five, but about seventeen degrees cooler than the surface.
For Goodwin Creek, using the identical conditions, the best fit is with the effective radiation temperature about the same as the surface. In other words, in that muggy atmosphere, the upwelling radiation is absorbed near the surface, and the downwelling radiation is coming from right near the surface.
In other words, in the desert, because the air is dry we get less downwelling longwave radiation than expected, and in Mississippi where the air is wet we get more radiation than expected.
So I would say that the water vapor is working in the expected manner in both locations. And that’s how I would probe the data to determine that.
Regards,
w.
jae, reflecting on the situation in Desert Rock, Nevada brings a curious thought about your Atlanta-Phoenix paradox.
There is undoubtedly an increase in DLR from the direct effect of water vapor. However, what this overlooks is that there is also a strong negative feedback from clouds.
If there is no water vapor in the air, as in Desert Rock, you get less DLR, it’s true.
But you also get less clouds. No water vapor means no puffy white solar reflectors. So (in some dry locations) that the decrease in DLR (from less water vapor, a notorious GHG) is overwhelmed by the increase in solar radiation because there are no clouds.
So the positive feedback from the water vapor is reduced, and in some cases totally overwhelmed, by the negative feedback from the clouds. Gottal love nature …
w.
Jae, Willis,
The USCRN sites are slowly becoming more comprehensive regarding the variables they are tracking. For example the AL_Gadsden_19_N site has a full set of hourly data for the last couple years. As well as the usual temperature readings they also include solar radiation, relative humidity, surface temperature, several levels of sub-surface temperature and moisture content, precipitation. Few other sites are as comprehensive, but some like CA_Fallbrook_5_NE are missing only sub-surface readings. They appear to be starting a separate data set for the sub-surface readings.
Perhaps jae can further his investigation by making use of the hourly data for only a couple years.
http://www.ncdc.noaa.gov/crn/qcdatasets.html
Willis Eschenbach says, December 21, 2012 at 10:46 pm: “You are determined to believe what you want to believe, in spite of the fact that the various college textbooks and online resources say the same thing—that the TSI is ~ 1368 W/m2, and that averaged over the surface, that’s 342 W/m2. …I’ve tried a host of ways to explain it to you … refusal to learn …”
=======================================================
Willis, as I said before, it was not apparently you who initially introduced this “averaging an average”, as I see it. Therefore your reference to “college textbooks” etc. does not add anything to a scientific debate.
Regardless where else that thing is mentioned, you failed to prove scientifically that your “342 W/m2” is correct.
Your first attempt was a reference to a NASA web page and it turned out that it does not support your thesis.
Your second attempt was presentation of a bogus calculation, where you derived the disputed TSI from something that has already been derived from that same disputed TSI, and I am still not sure, whether you understand or not how wrong such
tricksmethods are and that they are completely unacceptable in real science.Now you are referring to textbooks. I am sorry, but you could write a textbook yourself and include your bogus TSI calculation there, it still would be wrong. The same goes for your cutting the solar power in half by averaging an average.
Willis:
Thanks for all your thoughts, which I will try to digest thoroughly…
Willis:
The reason I have to stick with the Atlanta/Phoenix comparison is that it is the only pair of locations where one is very dry, one very wet, where there is data, and where the latitude and elevation are the same. I’m sure that the Hadley Cell effect exerts some influence, but I would expect the greenhouse effect from the extra water vapor in Atlanta to exert some positive influence also! The influence seems negative.
I guess what amazes me is that the difference in the amount of GHGs in a humid area like atlanta, relative to a dry place like Phoenix is equivalent to adding over 66 times as much CO2 to the atmosphere in Atlanta (simply assuming that CO2 is as efficient as HOH in capturing IR–which it is not by any stretch). (Water vapor is normally 1-3% of the atmosphere; whereas OCO is only about 0.03%). So why would we see almost exactly the same amount of downwelling radiation (about 400 Wm-2) in both locations on a nice July day? I guess it’s that logarithmic relationship between concentration and radiation? If so, we certainly don’t need much water vapor in the air to obtain the max. greenhouse effect, right? And given the overlapping of radiation bands for CO2 and HOH, I don’t see how CO2 can have any effect at all.
“So why would we see almost exactly the same amount of downwelling radiation (about 400 Wm-2) in both locations on a nice July day? I guess it’s that logarithmic relationship between concentration and radiation?”
It is due to the relationship between atmospheric density and insolation.
It is not DWIR that is being measured but the temperature of the air around the instrument and that is controlled by the balance between KE and PE at the height of the sensor which is in turn set by the slope of the lapse rate.
Surface temperature is set by density and insolation with the slope of the ideal lapse rate set by gravity.
GHGs can alter the slope of the decline of temperature with height but not the surface temperature because that is set by density (mass) and insolation.
Furthermore any effect of the GHGs on the slope in one layer is offset by an equal and opposite change in the slope in another layer.
In order to achieve the necessary adjustments there is simply a change in the global air circulation.
Compared to the changes caused naturally by sun and oceans our CO2 is insignificant.
Willis writes “There is undoubtedly an increase in DLR from the direct effect of water vapor. ”
The water vapor must be coming from somewhere and so there is evaporation involved. That lowers the surface temperature and reduces the amount of DLR producing ULR. Whilst there is probably a net increase over land especially, your statement is far too strong when there are negative feedbacks involved.
Stephen Wilde says;
“It is not DWIR that is being measured but the temperature of the air around the instrument and that is controlled by the balance between KE and PE at the height of the sensor which is in turn set by the slope of the lapse rate.”
Stephen, I have always thought this is the case, but I’m trying to find a way to demonstrate empirically that the GHE does not work as advertised.
Willis, I went digging again.
I did not have the terms or physics quite correct. Solids like water droplets and ice crystals do emit a continuous spectrum, gases at lower pressure and temperature emit discrete spectra.
There are some interesting graphs of discrete DLR radiation on that thread BTW. That was what I was actually looking for.
But the take home is you are looking at a mix bag and not just the energy from “bounced” earth energy.
Water is STILL the big factor though and the only way the IPCC can prop up CO2 as the big bad boogie man is to bundle the effect of water under the category they call CO2 radiative forcing.
Gail writes “Water is STILL the big factor though and the only way the IPCC can prop up CO2 as the big bad boogie man is to bundle the effect of water under the category they call CO2 radiative forcing.”
I’m especially sceptical about any multiplicative effect of the CO2 over the ocean where surely there is already a great deal of water vapor directly above the surface. This is kinda important DLR too!
jae says:
December 23, 2012 at 11:21 am
Thanks, jae. I have shown above that if we compare a very dry and a very wet location, the water vapor has the effect on the DLR that we would expect. More water vapor = more DLR, no surprise there.
The problem is that there are other effects of very dry and very wet. A wet location like Atlanta supports thermally generated thunderstorms in the summer, which have both a cooling and a moderating effect on the climate. Thunderstorms cool the earth through a host of mechanisms, including direct reflection of solar energy, transfer of heat from the surface aloft, transfer of cold from the atmosphere to the surface, and others.
Phoenix generally doesn’t have that kind of cooling, thermally generated thunderstorms in the summer. Instead, because the air is so dry that clouds are rare, it gets sun, sun, sun, and more sun.
Now, which place is going to be warmer? A place with the cooling effect of afternoon thunderstorms in the summer, or a place with almost no clouds at all and just sun, sun, and more sun?
I’d say the place with full-bore sun would be warmer, and Phoenix bears that out. The heating effect of having no afternoon thunderstorms overwhelms the lack of heating from no water vapor. Here’s the thing. Clouds in the daytime have a very large cooling effect, hundreds of watts per square metre. As a result, the extra energy from the sun if there are no clouds is likely an order of magnitude greater than the loss of energy from the lack of water vapor.
That’s why I say that you will have a very difficult time trying to establish your claim using those two cities. They are in totally different climate zones. I don’t see how you plan to account for e.g. the difference in summer cloud cover.
w.
jae says, December 23, 2012 at 5:19 pm: “…but I’m trying to find a way to demonstrate empirically that the GHE does not work as advertised.”
=======================================================
Jae, I am just curious. You know that in the Wood’s experiment the back radiation from glass does not work “as advertised”. Why do you think that back radiation from anything else like “GHG” still might work?
Let me give you an example. A person is accused of shooting people from a large distance with a sniper rifle. The defence proves that the person is blind. Would it be reasonable, if the prosecutor said “OK, he shot with a Kalashnikov then”?
Willis:
You say: “Thanks, jae. I have shown above that if we compare a very dry and a very wet location, the water vapor has the effect on the DLR that we would expect. More water vapor = more DLR, no surprise there.”
NO, Willis!! That is my central issue, here. One goes from an average of about 8 g/m3 vapor in Phoenix to over 20 g/m3 in Atlanta. That’s from about 1% of the air to 3%. That’s the equivalent of increasing the amount of CO2 in the atmosphere in Atlanta by 66 times over the amount in Phoenix–or a doubling of CO2 of 6 times!* And CO2 is no where near as strong a GHG as water vapor, so there should be even more of an effect! It looks to me that one would expect MUCH more effects from the GHG, if it did anything! All we get is 400 W/m2 at both locations???
I agree with Wilde that the DWR is simply a parameter of the temperature.
* 1%/0.03% = 33 “CO2 equivalents” for each percentage change in water vapor.
jae says:
December 24, 2012 at 8:34 am
jae, you insist on comparing raw temperatures between a place with a lot of clouds and thunderstorms (Atlanta), and one without much clouds and thunderstorms (Phoenix).
Now, you are welcome to do that, but I don’t foresee success. How on earth are you ever going to be able to untangle the temperature differences from the clouds, from the differences in water vapor? In Phoenix the radiation from the cloud changes is likely a couple of orders of magnitude greater than the loss from not getting the DLR from the water vapor. How do you plan to extract the H2O signal from the increased solar?
Finally, I have shown above that in Table Rock, Nevada, and in Goodwin, Mississippi, the actual observations show the expected effects of the difference in water vapor. You keep failing to comment on that, I suspect because it doesn’t fit your schtick of claiming that water vapor has no effect … so how about you forget about Atlanta and Phoenix, where you don’t have any damn data, and concentrate on a place where we actually do have data?
You were all up in arms claiming that there was no difference in the DLR between the sites. I showed that indeed, there was a large difference in the DLR between the sites, and I told you how to detect it, and I pointed out that it was exactly the difference we would expect to find if water vapor causes DLR.
At that point, you suddenly got interested in Phoenix and Atlanta again … curious, that.
w.
PS—You claim that a change from 8 g/m3 to 20 g/m3 of water in the air increases the DLR by the same as 6 doublings of CO2. What is your source for those figures? All you say is that 1% is 33 times 0.03%, viz:
but I don’t see what one has to do with the other. I see no physical reason why your calculation should have anything to do with comparing DLR from H2O and CO2. I ask additionally because that kind of change seems high. You may be right, but it just seems high.
Also, regarding Phoenix and Atlanta, you say that “All we get is 400 W/m2 at both locations???”. I was unaware that there are DLR measurements for Phoenix and Atlanta, what is your source for them?
jae says:
December 23, 2012 at 5:19 pm
So jae, your claim is that Stephen Wilde is right, that the hundreds of scientists who thought they were using a radiation measuring instrument to measure radiation were actually too dumb to notice that they were using a temperature measuring instrument to measure temperature?
Yeah, that’s the ticket …
I swear, every time I think folks have hit rock bottom, they always manage to surprise me. Beauty is only skin deep, but stupid goes all the way to the bone …
w.
Willis, you say:
“Finally, I have shown above that in Table Rock, Nevada, and in Goodwin, Mississippi, the actual observations show the expected effects of the difference in water vapor. You keep failing to comment on that, I suspect because it doesn’t fit your schtick of claiming that water vapor has no effect … so how about you forget about Atlanta and Phoenix, where you don’t have any damn data, and concentrate on a place where we actually do have data?”
No, you didn’t show that, at all. I think all you showed is a temperature effect! You cannot compare the locations because Table Rock is at a much higher elevation and at a different lattitude.
You also ask:
“S—You claim that a change from 8 g/m3 to 20 g/m3 of water in the air increases the DLR by the same as 6 doublings of CO2. What is your source for those figures? All you say is that 1% is 33 times 0.03%, viz:”
I don’t think you understand what I’m doing here. My source is simple logic. I am assuming, for grins, that CO2 has the same radiative power as H20 (actually C02 is much weaker, so my results would be extremely conservative). If I change the H20 vapor (absolute humidity) by 2% of the atmosphere (going from 1% in a dry location to 3% in a wet location (7 g/m3 to 21 g/m3), that is equivalent to changing the CO2 levels by 2/0.03 = 66 times (remember that CO2 is only 0.03 % of the atmosphere, while water vapor varies between about 1-3%). That is more than a sixfold doubling of CO2 (2X2X2X2X2X2 = 66).
My only question is: Why is there no observed effect for this tremendous increase in GHGs?
And finally:
“So jae, your claim is that Stephen Wilde is right, that the hundreds of scientists who thought they were using a radiation measuring instrument to measure radiation were actually too dumb to notice that they were using a temperature measuring instrument to measure temperature?”
No, I think you are again misunderstanding what I meaan (and presumably Wilde, also). All I am saying is that the radiation measurement reflects the amount of radiation coming from the GHGs in the atmosphere at the “effective temperature.” Just like you say. The DIFFERENCE is that I think it goes no further than that, and the radiation has no effect on the existing temperature. It is just a property of IR-active molecules in the air. It’s not a “heating mechanism,” or “retardation-of-cooling -mechanism,” no more than “back-conduction” is a heating mechanism in a steel rod stuck in a fire at one end. Otherwise there should be a much bigger difference between wet areas and dry ones, per the above reasoning.
Sorry to see you get angry; usually I’m the one that blows my stack…
jae, let me start with what you close with:
jae says:
December 24, 2012 at 10:28 am
jae, not sure where you get the idea that I’m angry. I do get angry at times, but you don’t have to parse my words to find it, you’ll know when it happens … I assure you that I am not angry in the slightest, it’s a lovely day here after some days of rain.
You go on to say:
Hmmm, I see that my writing is not clear.
In fact, I have done what I thought was a rather clever analysis to cancel out the temperature effect. What I have done is to find, not the temperature of the effective radiation level, but the difference between that and the actual surface air temperature. In that way, the surface temperature drops out of the equation. We get to see, for each location, the effective DLR radiation temperature. This, of course, is also closely related to the effective DLR radiation altitude.
If there is lots of water vapor in the air, we would expect the upwelling radiation to be absorbed near the surface. By the same token, this would mean that the DLR striking the ground originated near the surface. In this case, of course, the temperature of the radiating layer would be close to ground temperature (whatever that might be).
If there is no water vapor in the air, on the other hand, the atmosphere is relatively transparent to IR. In that case we’d expect the upwelling radiation to penetrate to higher, cooler elevations. And by the same token, we’d expect the DLR to be originating in those same higher, cooler layers.
As to whether I can compare locations at different elevations and latitudes, why not? I am doing a relative comparison (surface temperature minus effective radiation temperature).
Indeed, that’s why I asked.
I fear that “simple logic” in a complex system may not be adequate.
Second, I can’t follow the “simple logic” in that at all.
A large part of the problem is, it seems like you are not talking about absolute humidity (AH), which is measured in mass per unit volume (e.g. grams per cubic metre). It is never measured as a percentage that I know of.
Instead you seem to be kind of talking about specific humidity, which is grams of water per kilogram of dry air. That you could express as a percentage, although I have not seen it done … but the problem is, normal surface values for that are in the range of 2 to 20 grams of water per kilogram of dry air. As a percentage, that’s 0.2% to 2% with the larger values occurring in the tropics and decreasing towards the poles. But that maxes out at around 2%, and you are talking about 3%.
Alternatively, you could be talking about relative humidity. This actually is commonly measured as a percentage (of the theoretical water capacity of the air at that temperature). But if that is the case, then going from a wet location to a dry location might take you from a few percent RH to 80% or 90% RH, not to 3%.
Here, for example, is the average specific humidity by month for the Atlanta Airport, from this site:
Month, Specific Humidity at Atlanta Hartsfield Jackson Airport g/kg
Jan, 3.8 g/kg
Feb, 4.2 g/kg
Mar, 5.2 g/kg
Apr, 6.6 g/kg
May, 10 g/kg
Jun, 13.3 g/kg
Jul, 15.4 g/kg
Aug, 15 g/kg
Sep, 12.1 g/kg
Oct, 8.2 g/kg
Nov, 5.8 g/kg
Dec, 4.3 g/kg
I note that from the low to the high point it varies by about 15 / 3.8 = almost four to one …
In any case, I can’t make sense of it. I can’t figure out the units you are using or where you are getting your info. Specific humidity in the summer in Atlanta is about twice the SH in Phoenix summer. See here.
jae, you say that ” the radiation has no effect on the existing temperature“. From this, it is clear that you are saying that this is a special, brand-new kind of radiation that doesn’t contain any energy … because if it contained energy it would transfer that energy to whatever object absorbs the radiation, thus affecting the temperature of the object in question. So if it doesn’t affect the temperature, it cannot contain energy.
Now, if you and Stephen think you have discovered some kind of energy-free radiation, a never-observed kind of radiation that doesn’t affect the temperature of the object that absorbs the radiation, I’m afraid you’ll have to be the ones to notify the newspapers …
All the best,
w.
Willis Eschenbach says:, December 21, 2012 at 9:52 am: “Go back and look at the calculation of the average power. I use this mysterious thing called “mathematics”. I take the total amount of solar energy intercepted by the planet, and divide it by the ENTIRE SURFACE AREA OF THE PLANET, using the following magical incantation:
Average energy per unit area = total energy / total area.
Study that staggeringly complex formula for a while, and you’ll see that I have indeed given you the average sunlight over the total surface of the planet, and that I have absolutely NOT done what you say, to “consider only half of the earth to receive solar power).”
=========================================================
Yes, you have done that implicitly by calling the half of energy “total energy”. To demonstrate that, we can simplify a little bit and imagine that the Earth without atmosphere is a disk and does not rotate continuously but simply switches sides every 12 hours.
Then it is only for the first 12 hours after the Sun is “turned on” for the first time that only half the total area (1 hemisphere) receives sunlight. The light side would get like 120C warm and the dark side would remain 0K. After the switch the former dark side will get the same 120C, but the other side would only cool down and that not immediately to 0K, hence it’s temperature will be higher then 0K. If the cooling is slow, both sides of the disk would have almost the same temperature.
Your calculation “average energy per unit area = total energy / total area” is used to extract “average temperature” but does not take into consideration what I described above. As a result, “the average temperature” derived from your calculation is false (not to mention the wrong operating with averages”).
In other words, your approach does not make any physical sense, because it has little to do with the real physical process.
Willis Eschenbach says, December 24, 2012 at 3:30 pm: “jae, you say that ” the radiation has no effect on the existing temperature“. From this, it is clear that you are saying that this is a special, brand-new kind of radiation that doesn’t contain any energy … because if it contained energy it would transfer that energy to whatever object absorbs the radiation, thus affecting the temperature of the object in question. So if it doesn’t affect the temperature, it cannot contain energy. Now, if you and Stephen think you have discovered some kind of energy-free radiation, …
=======================================================
I am sorry, but that is an inversion of logic. This would be a correct logical procedure:
1. you assume that back radiation warms, you have your reasons, wonderful, but
2. the reality merciless demonstrates that it does not work, then you come to the conclusion that
3. Your initial assumption is wrong.
So simple is that.
Willis:
“A large part of the problem is, it seems like you are not talking about absolute humidity (AH), which is measured in mass per unit volume (e.g. grams per cubic metre). It is never measured as a percentage that I know of.”
Shit! You talk about bone-deep STUPID! WOW! (and THAT KIND OF RESPONSE FROM YOU IS ANGER, BRO!) And then you LECTURE me on just what absolute humidity is??? Just WHO the hell are you??
Read my math again and just try to understand it.
More, later, after you’ve cooled off…..
jae says:
December 24, 2012 at 8:33 pm
jae, you keep trying to convince folks that I’m angry. Sorry, that dog won’t hunt. I’m not angry. I’m in mystery. Truly, jae, if I were angry, you’d know it, because your ears would be burning and the hair on your chest would be scorched. Since those haven’t happened, you can rest assured that I’m not angry.
I am, however, confused about the point you are trying to make.
For example, as I said, absolute humidity is the mass of water in a given volume of air. It is typically measured in grams per cubic metre. And in fact, it is nothing more than the density of the water vapor.
Now, here’s the thing. You say regarding the absolute humidity:
Now, as I said, I don’t understand that. What does “change the H20 vapor (absolute humidity) by 2% of the atmosphere” mean? The absolute humidity is not calculated in “percent of the atmosphere”, as far as I know … but then I don’t have a clue what a percent of the atmosphere might be.
But perhaps AH might be calculated as a percent, there’s lots that I don’t know, and I’ve been wrong before. As a result, that’s why I asked …
In response, you wish to claim that the issue is that I am STUPID! WOW!. I notice that you don’t say one word regarding where I am wrong, or what I am being STUPID! WOW! about. You wish to convince folks that the issue is my ANGER … when I’ve been having a great time, I haven’t been angered in the slightest. Like I say, it’s been far too nice a day for that kind of nonsense.
Now, if you were to explain what you mean by discussing absolute humidity in percentages, that would be a great start. If you wanted to comment on the fact that the specific humidity in Atlanta varies about four-fold over the year, and speculate on how that might relate to your work, that would be interesting.
Heck, if you’d just comment on the analysis I’ve done of the two sites, that would be great. But so far, all I’ve gotten from you is ugly insults and vague claims that I’m wrong and you’re right … if you don’t like my math, you need to point out exactly where I’m wrong. Just claiming I’m wrong is wildly inadequate as an attempt to falsify my work.
Finally, where’s your analysis, jae? I’ve given you an analysis of the effect of the H2O vapor on the average emission height in the two sites. You don’t like it. But so far all you’ve done is wave your hands and utter reassuring words about Phoenix and Atlanta, and tell me what an angry jerkwagon I am … which is all well and good, but where’s the science? Where’s the substance? Where’s the results of your work? Where’s the beef?
My best to you,
w.