
By Joseph D’Aleo, CCM, AMS Fellow
INTRODUCTION
The US congress sub-committee on Energy and Commerce Committee held hearings on whether to restrict in some way the EPA’s regulatory authority relative to greenhouse gas emissions.
There were 7 scientists invited to testify. Three of the four who argued not to restrict the EPA played a key role in the last IPCC report (and will also in the next one) and generally started with the position that IPCC science was sound and there was a consensus of all real scientists.
In the attached analysis we take a look at the IPCC based science. We are going to ignore all the many ‘gates’ that were uncovered like the Himalayan glaciers, Amazon rain forests, how many real scientists there were who authored the key summaries and all the issues as to whether the summaries truly reflected the scientific information in the chapters and despite claims to the contrary, how a significant percentage of citations were not peer reviewed.
We will not attempt to address the issues of sensitivity for CO2 or solar and cloud and water vapor feedbacks relative to the models. We will also ignore the many model shortcomings – like inability to forecast regional patterns, ocean oscillations, etc. Each of these alone discredit the consensus ‘settled science claim.
We will focus on how actual data compares to the consensus science, model based virtual world view of climate.
We will look at some of the major findings, assessments or model predictions from the IPCC and other national climate centers and NGOs, that we believe have failed and let you decide then whether or not the their science and model projections should be the bedrock onto which we build public policy.
The ten issues:
1. Warming is said to be unprecedented and accelerating. It is neither.
2. Global warming is not GLOBAL
3. Winters would grow increasingly warm
4. The entire Northern Hemisphere would experience less snow and snowcover
5. The arctic oscillation (AO) would become increasingly positive, aiding in the warming
6. Global warming would lead to a permanent or semi-permanent El Nino
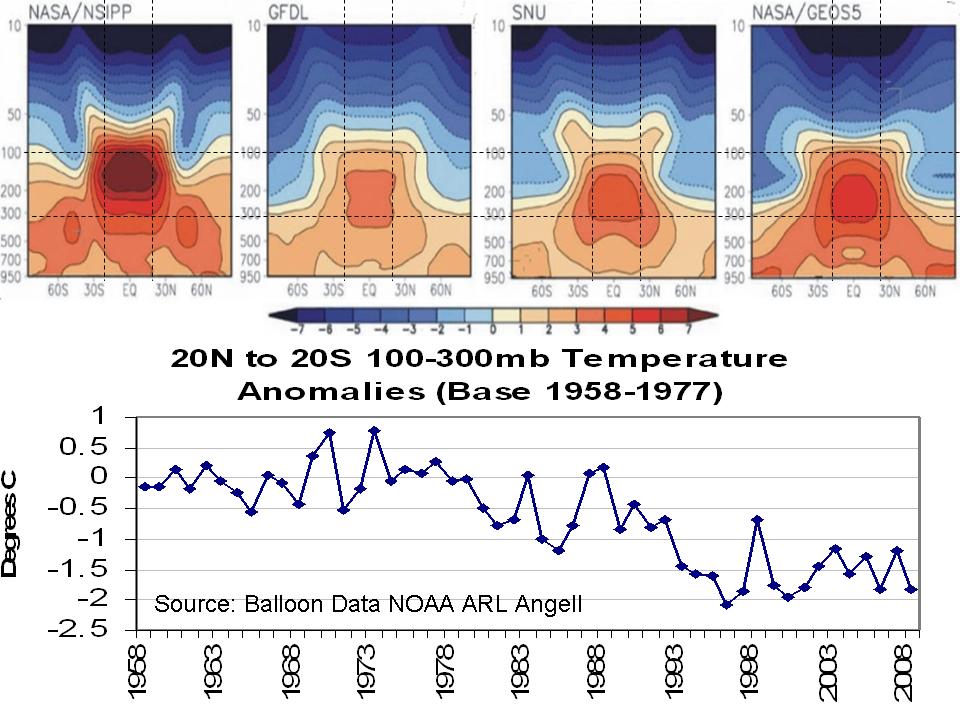
7. Atmosphere will warm faster than surface (because that is where the heat trapping gases are).

Enlarged. Balloon data for actual 100-300 mb from 20S-20N from NOAA ARL Angell (anomalies relative to base period 1968-1977) compared to models forecasts of warming 20S-20N 100-300mb. Note the cooling observed where models suggest most GHG warming. This is similar to depictions from Singer etal NIPCC 2007 and others.
8. Record highs and heat waves are increasing
9. Sea levels are rising at an increasing, alarming rate
10. Droughts and floods will worsen
We have actually made a list of 30 such ‘failures’ or ‘shortcomings’, but decided to focus on the first ten.
See the analysis part 1 and part 2.
As the earth splits open, it releases all the heat from the core, thereby contributing to even more warming!
Inescapable Conclusion: It’s worse than we thought.
Steven Mosher
No claims of runaway temperature? What is the term tipping point intended to mean?
Making the claims that the models are so complicated, and that other forcings are almost as important, or nearly as important, or whatever, doesn’t do anything but obfuscate. You are aware that the GIS, Hadley temps are contaminated by UHI, you are also aware that, other than in the cities, virtually no other meteorological sites are showing warming, and the Argus ocean buoys are not showing an increase in heat content. So what is it about the obviously broken models that keeps you defending them?
R Gates,
Whilst reports like this from NASA, tout ice loss, the researchers are now starting to hedge their bets on prediction.
“While this provides one indication of the potential contribution ice sheets could make to sea level in the coming century, the authors caution that considerable uncertainties remain in estimating future ice loss acceleration. ”
http://www.nasa.gov/topics/earth/features/earth20110308.html
Looks like they’re about 25% sceptic like you. ( ;<}
Two more years to the global tipping point, then unstoppable cooling. 4 to 1 odds eh?
rbateman says: March 21, 2011 at 3:02 pm
Arizona CJ says: March 21, 2011 at 2:35 pm
The Climate Change alarm began prior to 1900, when thermometers became widespread. Each time the cycles change, so does the nature of the alarm.
Cold, Hot, Cold, Hot and now back to Cold again.
And, just like previous episodes of climate alarm, give them a few more years for reality to sink in, and it will be Global Cooling causes Coming Ice Age all over again.
To be historically correct, CO2 warming was introduced to explain the failure of the camp century cycles prediction of cooling (what are they look at Wikipedia .. JOKE!! Cause it’s not in Wikipedia.)
What happened, was that they detected some cycle in some ice cores. They then said this showed we would get cooling. The cooling failed to materialise, and to explain the lack of cooling, they postulated a new force … CO2 warming, and the rest is history.
So, CO2 warming will never be disproven. Like the Camp Century Cycles a greater force will be found to be causing the climate to go the other way.
So, e.g. if they predict 0.3C/decade warming, and they find -0.2C/decade cooling, this will be taken as absolute proof that there is a new force equivalent to -0.5C/decade … and because all such proofs only escalate limited only by the bounds of human gullibility, this force will itself be a massive and escalating climate cooling effect.
Then a few years later, when it starts to warm again, by e.g. 0.2C/decade, there will be an even greater god in climate science whose 0.7C/decade,
etc., etc. etc. etc. limited only by the gullibility of those who listen to them!
Graeme W says:
March 21, 2011 at 10:16 pm
Further on my last post, I’ve been thinking on a couple of the items that R.Gates gave as why he considers AGW as a probability (75% likely, if I’ve understood his use of percentages correctly).
Arctic ice loss. The problem here is that this is not really a prediction of AGW. The ice loss has been documented as starting around the 1950s…
____
Reply…uh, CO2 started rising beyond it’s 800,000 year range in the mid-1700’s with the onset of industrialization. GCM’s did not look at the ice loss starting in the 1950’s to project sea ice loss but actually programmed the rise in anthropogenic CO2 that has been going on for several hundred years into the modesl, and found that polar amplification and sea ice loss would be a consequence of this rise. Yes, CO2 has begun rising much faster this century with worldwide expansion of industry and the global growth in the use of fossil fuel burning cars & trucks, etc., but the rise started back in the 1750’s.
Perry says:
March 22, 2011 at 6:17 am
R Gates,
Whilst reports like this from NASA, tout ice loss, the researchers are now starting to hedge their bets on prediction.
“While this provides one indication of the potential contribution ice sheets could make to sea level in the coming century, the authors caution that considerable uncertainties remain in estimating future ice loss acceleration. ”
http://www.nasa.gov/topics/earth/features/earth20110308.html
Looks like they’re about 25% sceptic like you. ( ;<}
Two more years to the global tipping point, then unstoppable cooling. 4 to 1 odds eh?
______
What is pretty certain is that we'll see an ice free summer Arctic this century and equally as certain that the cause will be due to the 40% increase in CO2 since the 1700's. Polar amplification of the AGW is one of the consistent forecasts as seen in the GCM's, and we've seen it, and will continue to see it.
steven mosher says:
March 21, 2011 at 9:54 pm
did anyone read and check I just spend a few minutes on number 1
“1. Warming is said to be unprecedented and accelerating. It is neither.
Satellite and surface data shows no warming for 15 years despite CO2 increases ..”
There are several problem with this.
A. there are no citations for the claim.
B. the evidence produced doesnt address the issue. they show two graphs
1.UAH Monthly from 1995 (15 years) with NO TREND calculation
2 hadcrut from 2002 with a trend. thats not 15 years.
So, lets take a look at the actual evidence for the past 15 years.
first, the claim:
=============================================
A. None is needed. This is commonly held view. It doesn’t matter who said it or when.
B. My ten year trend is every bit as valid as your arbitrary 15 year trend. I don’t know when or why it is accepted that 15 years holds any more meaning than 10 or why 30 years holds some magical value, but my arbitrary values are just as meaningful as anyone else’ and so too, is this refutation to CAGW.
How long, I wonder, before the alarmist/warmists/eco-lunes/eco-fascists start wearing pendants shaped like wind-turbines/bird-shredders in order to ward off the evils of global warming.
steven mosher said March 21, 2011 at 9:54 pm”
“‘So, lets take a look at the actual evidence for the past 15 years.”
Steven, given the inherent characteristics/variability of the temperature data sets, can you please share your opinion as to the validity of using a 15 year time line to establish a trend, regardless?
R Gates said;
“Reply…uh, CO2 started rising beyond it’s 800,000 year range in the mid-1700′s with the onset of industrialization…’
Surely only a fraction of the already tiny amount of post 1750 co2 is still in the atmosphere? Most has gone into sinks including the ocean. I thought it was only post 1950 co2 that was making any significant contribution.
tonyb
It seems to be taken as a given that anthropogenic CO2 production has only been of real consequence since about 1945. That is certainly true if one looks only at the way that motor vehicles have proliferated over the intervening years. Those of us old enough to remember 1945 (and earlier years) can recall the pall of smoke that overhung every industrial city in those days. Smoke from domestic chimneys added appreciably to the general fug that overhung the land. My guess would be that the steel furnesses of Sheffield in, say, 1956, when I worked there briefly, belched out more pollutants than all of that city’s vehicles do today. Virtually every industrial process was coal fired of course. We hide the evidence better these days but massive CO2 production would have begun before my grandfather was born.
Couldn’t help notice a few AGW believers still pushing the CO2 angle. Perhaps these guys can explain this: For more than 55 million years, Ellesmere Island in Canada’s high Arctic remained in one place while the world around it changed. Fifty-five million years ago, verdant forests grew at 75° North latitude. These wetland forests, comprised of species now primarily found in China, grew on an alluvial plain where channels meandered back and forth and periodic floods buried stumps, logs, and leaves intact. Today the forests are preserved as coal seams that outcrop on the edges …of modern Ellesmere Island, where there are no forests, and the tallest vegetation grows less than 15 cm high. Large parts of the area are polar desert, subject to intensely cold and dark winters and minimal precipitation.
Now this is a time span worth considering – before SUVs, oil sands, and filthy humans to mess up the scene – a century isn’t even a blink in time – this is before AGW and their spiritual advisors found a new way to make money off the rest of us. You can’t just up and decide from this century or that century when to start your climate experiment without understanding the historical earth. Until and unless the AGW side explains all the previous ice ages and warm periods throughout earth history all the hockey sticks in Canada isn’t going to convince anyone until we know WHY these events happened in previous history. That is not skepticism that is reality!
tonyb says:
March 22, 2011 at 10:50 am
R Gates said;
“Reply…uh, CO2 started rising beyond it’s 800,000 year range in the mid-1700′s with the onset of industrialization…’
Surely only a fraction of the already tiny amount of post 1750 co2 is still in the atmosphere? Most has gone into sinks including the ocean. I thought it was only post 1950 co2 that was making any significant contribution.
tonyb
____
Don’t know if your kidding or not, but regardless, the effects of CO2 are cummulative and nonlinear (i.e. chaotic). Essentially anthropogenic CO2 is much like a human-created CO2 volcano which started to erupt around 1750 and continues to erupt today, and perhaps hasn’t even seen the peak of it’s eruption if you measure it by the gain in ppm of CO2 per year. The issue is: how sensitive is the climate to this eruption which is spewing more CO2 into the air than at anytime in the past 800,000 years?
Steve Mosher says:
“The question of global DAMAGE is vastly different from the question of what happens when we double the IR opaque gases in the atmosphere.”
# # #
But the question of global DAMAGE caused by CO2 is the central argument, isn’t it? The evidence-free assumption that a rise in CO2 will cause global harm, runaway global warming, tipping points, climate catastrophe, etc., is the stated rationale for the “carbon” scare. But since it is now clear that there is zero evidence showing that CO2 causes any global harm, after a significant 40% increase, then at what point would you propose that evidence of such putative global harm will appear? A rational person would look at these facts and sensibly conclude that the CO2=CAGW conjecture is simply wrong.
The fact that the endlessly predicted harm from CO2 has never happened is a serious threat to those who enjoy the 6 – 7 billion taxpayer dollars lavished on the “carbon” industry every year.
You know the Climategate emails better than most, so you are aware of the underhanded methods used by Mann and his clique to keep scientific skeptics from being published, even if it means they have to “re-define peer review.” They threaten climate journals to toe their CAGW line, and worry that even one person at a journal might actually see both sides of the question. It is crystal clear that they have an agenda, and use a thin veneer of science to cover it up. Skepticism is at the heart of the scientific method; you don’t see a problem with their actions?
Also, I have never stated that CO2 has no effect on temperature. My position has always been that the effect has been greatly exaggerated. If it were significant, it would be easy to show measurable evidence of the effect of CO2 after a 40% increase. But there is no such evidence. The entire CO2=CAGW edifice is based on computer models, circular pal reviewed papers, and questionable proxies.
CO2 simply has too small an effect on temperature to measure, so these climate charlatans hide out, and they hide their data. And when they have no data, as the Harry_Read_Me programmer admits, they simply fabricated years of data to support their agenda.
Other areas of science are starved of money because the climate scare has sucked up so much funding. And it is all based on the debunked belief that CO2 [“carbon”] will cause runaway global warming. But the planet itself has falsified that belief, which is why I keep asking for evidence of global damage due to CO2. That is the central question in the entire debate. Since there is no global harm, there is no credible reason for the “carbon” scare, and the enormous burden that mitigation of a non-problem would put on society.
The rational, evidence-based conclusion is that CO2 is both harmless and beneficial. More is better. The runaway global warming scare has been repeatedly falsified; the climate clique led by Michael Mann depends upon deceit, trickery, and the outright refusal to disclose their data, methodologies, metadata and codes for falsification: a basic requirement of the scientific method.
If their data and methods withstand scrutiny, I will accept that they have a cause for action. But the fact that the ringleader and his clique fight tooth and nail to avoid the requirements of the scientific method makes it clear that their claims are based on smoke and mirrors.
Finally, I enjoyed your woodfortrees graphs, and I agree that the trend for the past 15 years is up [although most of the rise is natural]. But most of the past decade looks like this:
click1
click2
click3
See? Anyone can play the woodfortrees game.☺
Ken Harvey says:
March 22, 2011 at 11:13 am
It seems to be taken as a given that anthropogenic CO2 production has only been of real consequence since about 1945.
____
No one knows that and I certainly don’t think it is “taken a a given”. The effect is cummulative, so as soon as CO2 rose outside the range seen over the past 800,000 years the cummulative effects would be in play. The only real scientific way of know would be to have an identical earth and use it for the control model, and then begin to slowly begin to add CO2 as we’ve done and note the differences. This is essentially what GCM’s attempt to do, but of course, their model earth’s cannot possible incorporate all the complexity and interconnections, though they are pretty darn complex and of course require super-computers to work. Regardless, they are the best model we’ve got thus far and will only get better and better, and I do feel strongly that they’ve got the trends correct, though will never get the details right nor the potential chaotic tipping points.
Wil says:
March 22, 2011 at 11:19 am
Couldn’t help notice a few AGW believers still pushing the CO2 angle. Perhaps these guys can explain this: For more than 55 million years, Ellesmere Island in Canada’s high Arctic remained in one place while the world around it changed. Fifty-five million years ago, verdant forests grew at 75° North latitude. These wetland forests, comprised of species now primarily found in China, grew on an alluvial plain where channels meandered back and forth and periodic floods buried stumps, logs, and leaves intact. Today the forests are preserved as coal seams that outcrop on the edges …of modern Ellesmere Island, where there are no forests, and the tallest vegetation grows less than 15 cm high. Large parts of the area are polar desert, subject to intensely cold and dark winters and minimal precipitation.
Now this is a time span worth considering – before SUVs, oil sands, and filthy humans to mess up the scene – a century isn’t even a blink in time – this is before AGW and their spiritual advisors found a new way to make money off the rest of us. You can’t just up and decide from this century or that century when to start your climate experiment without understanding the historical earth. Until and unless the AGW side explains all the previous ice ages and warm periods throughout earth history all the hockey sticks in Canada isn’t going to convince anyone until we know WHY these events happened in previous history. That is not skepticism that is reality!
____
Wil,
Your argument fails on a logical basis. We don’t have to know all possible cause and effects of everything regarding earth’s climate to understand a specific chain of cause and effect that AGW is concerned with. The same effect can be produced by multiple causes, so you don’t have to understand all those causes to study the effects of just one potential cause. Specifically, we know that CO2 is a GH gas, and we know that humans have caused it to increase to levels 40% higher than they’ve been in the past 800,000 years. This is the only cause we need to concern ourselves with in asking the essential question of the entire AGW debate: How sensitive is the earth’s climate to the 40% increase in CO2 since the 1700’s?
We don’t have to know what caused all other ice ages, glacials, interglacials, snowball earths, hothouse earth’s, or any such thing to look at this specific relationship. Studying those past periods certainly might give us clues, but we don’t have know every detail about them to study the specific question asked above.
@R “40%” Gates:
“What is pretty certain is that we’ll see an ice free summer Arctic this century and equally as certain that the cause will be due to the 40% increase in CO2 since the 1700’s. Polar amplification of the AGW is one of the consistent forecasts as seen in the GCM’s, and we’ve seen it, and will continue to see it.”
+++++
GCM’s predict absolutely everything so I am unimpressed with talk of polar amplification. Blunt CO2-science calls for equatorial atmospheric amplification heating the oceans! Not much of that to be seen anywhere.
Warm water entering the Arctic: well that water was not heated by a heat-retaining CO2-enhanced atmosphere, was it? No known mechanism for it, is there. Bit of a spanner in the works, that.
So what caused the ice-free Arctic in the years 900-1100 when the Siberian Inuit people moved rapidly East across the northern edge of Canada, wiping out the Clovis Culture and established fishing settlements on the north shore of Greenland? Their permanent homes are presently permanently ice-bound. Bit of a spanner in the AGW-GCM works, that.
And what caused the ice-free Arctic Ocean that the Vikings sailed in when they circumnavigated Greenland in the 1200’s? Was it perhaps the 800,000 year constant CO2 level or some forcing we don’t yet know about? [Think: ‘Sun’] Another spanner in the works, that.
What lies at the core of CAGW is an unceasing, mind-boggling denial of reality.
If the poles cool, and it appears they are going to, a new fiction will be written about how it was all predicted by the GCM’s. Giant fortune-Cookie Maker’s:
“Someone you know may secretly admire you!”
“Today’s temperature is not tomorrow’s.”
Can’t miss.
R. Gates, please help me understand your statement that “the effects are cumulative”. Do you mean heat? If you do, would that not also be the case for heat trapped by any other means? If I follow your logic, we should not be cooling. At all. All the heat of the past El Nino’s since CO2 started to rise, should still be here, overwhelming any La Nina cooling. The temperatures should not be noisy. At any station. If there is any noise at all, as in one is cooling, another should be rising to drown it out. And the one that is cooling must have an error in it.
Smokey says:
March 22, 2011 at 11:42 am
Hear, Hear! Smokey did it again!
Steve M,
increased GHG’s lead to warming … agreed, in a labratory of course … but does more CO2 mean there are more GHG’s in the atmosphere ? please cite the GHG data on a global scale … please don’t forget to include ALL GHG’s not just CO2 …
I find it interesting that we accept the CO2 measurement from a single location (which happens to be sited next to a huge volcanic CO2 emitter) for the entire planet …
R. Gates says:
March 22, 2011 at 11:59 am
“We don’t have to know what caused all other ice ages, glacials, interglacials, snowball earths, hothouse earth’s, or any such thing to look at this specific relationship. Studying those past periods certainly might give us clues, but we don’t have know every detail about them to study the specific question asked above.”
Certainly you don’t have to know, but it might make the science of the climate just a little easier to understand, and the effects of nature more accurately quantified. The problem with trying to study a chaotic system in isolation is that you can’t isolate it. Since you can’t isolate it, and your models don’t correctly predict future behavior, it’s clear that ignoring past strange attractors is no way to remotely predict future trajectories.
Wall Street has been carefully tiptoeing around Mandelbrot in the same way. Long tailed distributions have interesting behaviors in that tail section. 2008 was a marvelous case in point.
In long term Meteorology, LTM, the first thing to do is to establish valid measurements, validate historical records, and correlate prior LTM Cycles. It’s about the data, real data, not models. If the UC Berkley work doesn’t revisit UHI effects in current measurements, then they won’t have met the second criterium. Fixing poor data acquisition is a prerequisite for good science. For LTM to be good science, it must be built upon measurements and methods that we all can trust.
Smokey
I will note that you have abandoned your argument about C02 and its effect on temperatures.
“But the question of global DAMAGE caused by CO2 is the central argument, isn’t it? The evidence-free assumption that a rise in CO2 will cause global harm, runaway global warming, tipping points, climate catastrophe, etc., is the stated rationale for the “carbon” scare. ”
No its is not the CENTRAL argument. The central question is this:
GIVEN that more GHGs cause a warmer world, What is our best estimate of
A. the trajectory of emissions for the future
B. the trajectory of temperature.
THEN come the questions of impacts.
Up until now, many people have been unwilling to grant that GHGs will cause warming. So, I like to start at that beginning. Will you or will you not Join
Lindzen, Christy,Spencer,Monckton,Watts,Eschenbach, et al, and grant that More GHGs means a warmer world and NOT a cooler world?
On the record.
or do you have some scientific theory that will explain how an opaque atmosphere leads to a cooler world?
Finally, to return to your questions about C02 and temp. SteveF did some nice charts
First. when you plot C02 as you did you make some horrible mistakes. Its time for you to own those errors. Here is SteveFs plot of FORCINGS
http://i51.tinypic.com/2mg70cg.jpg
You cannot plot C02 ALONE. you cannot plot C02 as a ppm. you MUST use FORCING. the forcing is expressed in watts. watts of forcing. The chart above shows you all the positive forcings ( there are also negative forcings like aerosols)
Then, what does theory tell you? theory tells you if you increase the external forcing, the temperature will respond. It will go UP, not DOWN. the world will get warmer, not colder. Thats the “trend” OVER TIME. month to month, year to year, decade to decade to decade we will see perturbations about this trend. Volcano here, el nino there, but over time, the trend will be up. So, lets see how that looks. change the forcing, what happens to temperature:
http://i51.tinypic.com/2j43qmg.jpg
And so the question is: whats the relationship between C02 ppm and the FORCING it produces.
RGates, then how can you explain 1940 to 1970 and 1998 to 2011. It doesn’t fit in to the CO2 record while it does fit in to ocean changes.
R. Gates says: Your argument fails on a logical basis. We don’t have to know all possible cause and effects of everything regarding earth’s climate to understand a specific chain of cause and effect that AGW is concerned with. The same effect can be produced by multiple causes, so you don’t have to understand all those causes to study the effects of just one potential cause. Specifically, we know that CO2 is a GH gas, and we know that humans have caused it to increase to levels 40% higher than they’ve been in the past 800,000 years. This is the only cause we need to concern ourselves with in asking the essential question of the entire AGW debate: How sensitive is the earth’s climate to the 40% increase in CO2 since the 1700′s?
We don’t have to know what caused all other ice ages, glacials, interglacials, snowball earths, hothouse earth’s, or any such thing to look at this specific relationship. Studying those past periods certainly might give us clues, but we don’t have know every detail about them to study the specific question asked above.
——–
Thanks for your response. On the contrary, logically, if we do not understand either the cause of an ice age nor the cause of succeeding warm periods, and many warmer than today, we are missing extremely important data of previous cause and effect. In essence because both ice and warm periods each have a scientific cause, yet unknown, how can any of us possible rule in or out which is which. The best scientific information currently available also indicates much higher CO2 values on historical earth, CO2 which I might add is a red herring to begin with possibly causing to many of us to inherit tunnel vision at the expense of a much larger picture. For instance, how would any of us even suspect what a possible mini ice age would look like let alone a hot period, its duration, historically, or its tipping point either way.
It is more than evident modern climate experiments are much too short a time frame, highly questionable at best, and in its infancy incapable of arriving at accurate predictions. Current predictions are no better than throwing darts blindfolded. Sagan had it correct: “Extraordinary claims require extraordinary evidence.”
By that standard the AGW community has indeed failed this challenge.
R Gates said
“Don’t know if your kidding or not, but regardless, the effects of CO2 are cummulative and nonlinear (i.e. chaotic).”
The point I was making was that the amount of Co2 emitted from 1750 was miniscule until more modern times.
http://c3headlines.typepad.com/.a/6a010536b58035970c0120a7c87805970b-pi
Are you saying that ALL of it emitted since 1750 has remained in the atmosphere since then? None has found its way into sinks?
tonyb