In our previous post, we highlighted the BoM weather station on Willis Island, and wondered what would happen to it and to the staff who worked there.
Fortunately the staff has been evacuated prior to Yasi hitting the island. They apparently left everything running on automatic, including the radar. The data from the weather station tells the story of the approach and the hit.
Temperature and dewpoint converge as the air and the sea become one.
 The humidity pegs the meter.
 Rainfall soared.
 Barometric pressure dropped like a rock.
 And the wind peaked, the equipment failed, and the station went silent.
 The last radar image from the Willis Island BoM radar showed a massive eye.

You can watch the story the data tells at other weather stations in Queensland, just click on the map below to use the interactive BoM website.

Those of you living south of the path should watch out. Even if the eye passage isn’t all that close, the forward speed of the storm adds to the wind speed on that side.
Baa Humbug says:
February 1, 2011 at 11:42 pm
The more I look at TC Yasi, the more I think it’s gunna be a bit of a fizzer. As big as it looks on the radar images, I don’t think it’s as severe as it’s made out to be. Lets hope so.
—————————————————————
As part of WUWT’s continuing education program about different versions of English, I should explain that a ‘fizzer’ in Australia is a firework that, instead of going ‘bang’, goes ‘phizzz’.
However, it does seem that the catastrophic effects of Yani won’t be quite as bad as predicted.
I am not sure how useful discussions about individual events are to overall discussions about climate. As Anthony, and we, all know, people are passionately concerned about weather (including this latest Queensland cyclone).
I have got half a dozen tabs open showing different dimensions of the approaching Yani. It is fascinating. But, I do not imagine that it has anything to do with forecasting.
Lazy Know-It-All says:
“Have you noticed the sea surface temperatures off the coast of Queensland?”
You mean where those mild yellow and blue colors are?
http://www.osdpd.noaa.gov/data/sst/anomaly/2011/anomp.1.31.2011.gif
Dear Anthony/Mr Moderator
The Guardian have already started:-
“So we can’t just continue to mop-up without thinking about how fossil fuel emissions are changing our climate.”
http://www.guardian.co.uk/environment/damian-carrington-blog/2011/feb/02/cyclone-yasi-australia-climate?commentpage=last#end-of-comments
I found this on Wiki and is in respect of a Cat 5 storm in 1899
http://en.wikipedia.org/wiki/Cyclone_Mahina
Mike Haseler says 2:06 am: “This is why everyone thinks the world has more natural disasters … the public and media are being bombarded to overload with this and that natural disaster ”
And that is why amateur climate science – like environmentalism generally – is “the science of solipsism.”
“Everything I see in my immediate vicinity and experience is the way the world is, everywhere!”
It’s just one reason why so many urbanite yuppies living in dirty cities believe the entire planet is filthy and polluted, just like their own cesspool.
Checked the location map, stats and satellite map just before bed last night and was absolutely horrified for those folks and they’ve so much on their plates already. The pressure drop on the chart above…is what your stomach does as the thing keeps getting closer and just doesn’t calm down any. (Went through Bertha and Fran in ’96 and thought that rendered me a veteran. The night Ivan came ashore, I was reconsidering my attitude…)
The real-time weather data seems relatively moderate. The eye is onshore now so landfall has happened. Both wind and rain north of the eye are apparently very moderate. Cairns Aero has recorded maximum 85 kph gusts and 15 mm rain. Winds and rain are stronger on the south side, with Townsville recording 120 kph gusts and 75 mm rain. Lucinda which was apparently right in the eyewall recorded 185 kph gusts but only 25 mm rain. It would seem that Yasi made landfall as weak category 3 on the Saffir-Simpson scale.
Weather data here:
http://www.bom.gov.au/qld/qld-observations-map.shtml
It would seem that Yasi made landfall as weak category 3 on the Saffir-Simpson scale.
“Whew!” if that holds up.
Great satellite picture here:
http://earthobservatory.nasa.gov/IOTD/view.php?id=49066
While checking out the wind speed for Lucinda (close to where Yasi has fallen), I noticed the temps seem a bit screwy:
http://www.bom.gov.au/products/IDQ60801/IDQ60801.94295.shtml
Created by the high wind?
“johanna says:
February 2, 2011 at 6:11 am”
I’ve been watching this on Channel 7 and ABC News 24 and the reporters are there, webcams and all, just wating to be “the first to record”! Channel 10 “will be the first to record, and broadcast, the aftermath”…all the webcam images, well the worst ones I could see, were like a normal windy westerly night storm in the Wairarapa in New Zealand.
Almost everyone who is interviewed are “terrified”. I wonder if that is due to media hype?
It certainly is sad for the locals however, as I said before about living in flood plains, if you live in a “disaster” prone zone, expect a disater at some point in time.
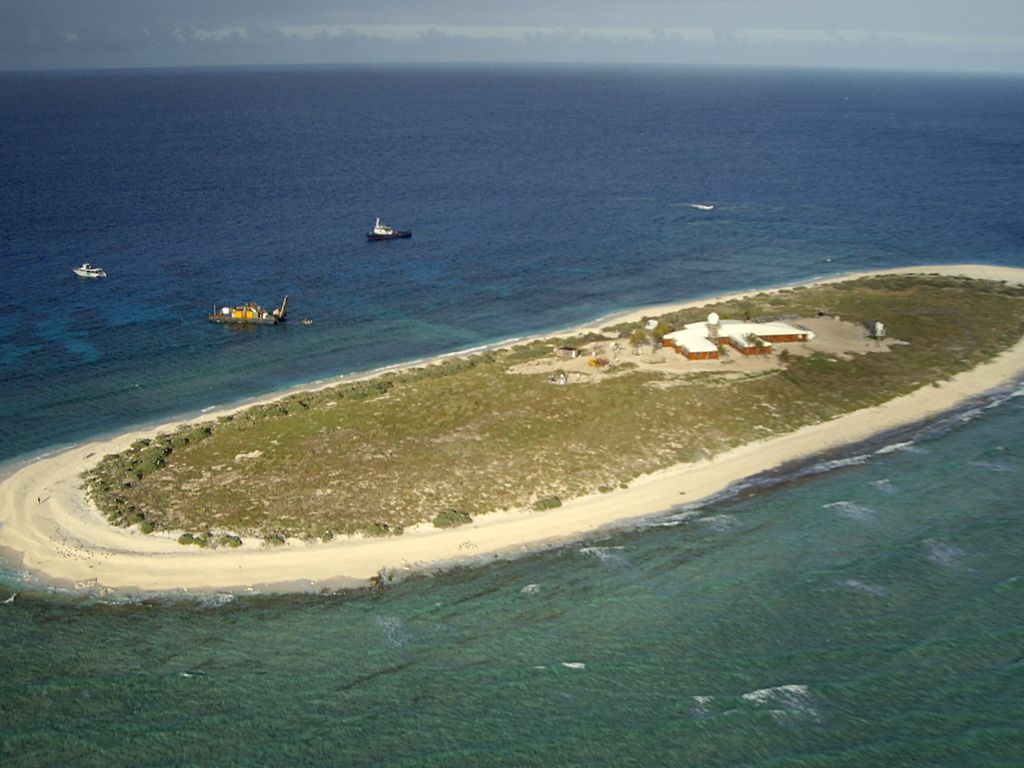
The island looks flat, so the storm surge probably swept completely across it! I am glad they got the people off before it hit.
Dave N says:
February 2, 2011 at 8:00 am
Yeah, that 63.5C sure looks in need of some homogenisation!
Winds suddenly dropped to near-zero at 0900 2 Feb.
Either the eye crossed the station, or the anemometer got destroyed.
This is great data which tells a very dramatic story. I think I will use this in my earth science class this week – we just started talking about barometric pressure.
Thanks!
Jason
It is 6 am, Feb 3. Yasi is downgraded to Category 3. Little solid report during the night, and it’s been mostly positive. The sky is lighting up on the eastern seaboard. The scale of destrcution shall be known soon.
I can’t help wondering if it ever was more than a category 3, though a geographically big one. There has been a lot of talk about 250+ kph winds, but I can’t remember seeing any actual measurements over c. 100 knots. It seems odd that a Cat 5 would drop to a Cat 3 so quickly while over one of the worlds’ warmest ocean areas.
As things stand now it seems likely that the Townsville area was worst hit while Cairns is unlikely to have suffered significant damage.
Ken Stewart says:
February 2, 2011 at 3:22 am
Baa Humbug:
“I have to agree with you. I’ve looked at all wind speeds in the area to 8pm when the BOM says coastal areas between C Flattery and Sarina are experiencing damaging winds with gusts up to 90km/hr:
Townsville had a gust at 98kmh at 8pm, Hamilton Island 109kmh (117 at 4pm and 5pm), Lucinda gusting over 100kmh since 3.30pm, highest 120 at 6.30pm, and obviously between Innisfail and Cardwell would be similar. but none others within cooee. Cairns at 8.00 48kmh!
Willis Island would have gone higher than 185 as the pressure kept going down, but highest gust recorded anywhere else was 167 at Flinders Reef at 2pm, 141 at Holmes Reef at 7pm. Next highest was 120 at 6.30 at Lucinda. So I will keep checking the figures for the next 12 hours or so but the wind speeds are nothing like what has been claimed, certainly nothing approaching 290kmh. Thank goodness for that! Time will tell, let’s hope it fades away to nothing.”
It helps to have a little understanding of the structure of cyclones.
Extremely destructive winds occur within the inner eyewall of the cyclone which in most cases is only 10-20km across. Outside of this the wind speed drops very quickly. The measuring station at Flinders Reef was 65km from the eye of the TC Yasi so was at least 40km from the inner eyewall which is why the maximum gust recorded was only 167kmh.
By comparison, given the movement speed of 30kmh and Yasi entering the inner eyewall at Willis Island at about 8am, it would have been about 65km from the eye at around 6.30am at which point it was registering wind gusts at 130kmh.
No BOM measuring station other than Willis Island was in the eye of this cyclone and Willis Island measuring station was put out of action just as it was entering the inner eyewall. The closest mainland station to record measurements was at Lucinda and clearly from its measurements it was in the northern part of the eyewall and measured a maximum gust at 185kmh. As the storm was moving at about 30km at landfall this would translate to maximum windgusts in the 250-260kmh range on the south side of the eye at landfall on the southern side at the very least. There was simply no measuring station in place to measure those speeds though.
It is worth noting that Townsville 150km south of the crossing point experienced maximum wind gusts in excess of 130kmh which gives you an indication of the true strength of the storm.
So at landfall it seems Yasi was very close to the strength of BOM forecasts but fortunately crossed in a lightly populated area. I think when film crews get into those areas they will find devastation.
“”””” johanna says:
February 2, 2011 at 6:11 am
Baa Humbug says:
February 1, 2011 at 11:42 pm
The more I look at TC Yasi, the more I think it’s gunna be a bit of a fizzer. As big as it looks on the radar images, I don’t think it’s as severe as it’s made out to be. Lets hope so.
—————————————————————
As part of WUWT’s continuing education program about different versions of English, I should explain that a ‘fizzer’ in Australia is a firework that, instead of going ‘bang’, goes ‘phizzz’.
However, it does seem that the catastrophic effects of Yani won’t be quite as bad as predicted. “””””
So in ‘strine, just what the blazes is a ‘yani’; most other places, he’s some sort of ersatz musician/singer/noise maker.
And forgive me for asking; but are you one of those cool/hot Bondi Sheilas ? Enquiring minds, want to know ?
“”””” John M says:
February 2, 2011 at 6:14 am
Lazy Know-It-All says:
“Have you noticed the sea surface temperatures off the coast of Queensland?”
You mean where those mild yellow and blue colors are?
http://www.osdpd.noaa.gov/data/sst/anomaly/2011/anomp.1.31.2011.gif “””””
So a couple of questions come to mind, looking at some of these pictures/maps.
How far off shore is the Great Barrier Reef (mainly) , and what sort of water depths are there off that North Queensland coast ? I know that Cairns, is a mecca for really big Black Marlin enthusiasts; and I have always presumed; what the hell, assumed that they are fishing waters outboard of the GB Reef; but I dunno if that’s so.
I’m thinking if the reef’s waters are quite shallow, even if maybe warmer as a result, that the energy available to a
Hurricane^-1 might be somewhat attenuated compared to a deep ocean situation.
So maybe Dr Roy can get us some up to date, lookum down pictures (Temperature wise) of the Yasi trail of the SSTs off Q.
Maybe the BG Reef is a natural Cyclone attenuator, although the eye is apaprently all ashore now.
Nother question; what is the inland terrain of that part of Australia ? I always thought that 90% of Australia was less than 10 feet above sea level. In any case, I’m wondering if the inland terrain, has any special properties as regards shutting down monster storms ? If there’s nothing in the way to drive the weather to higher altitudes, I would think things would just blow right on out the other side; that’s been my thinking as to why Aussieland doesn’t get much rain.
I guess I need to hit the topo maps.
Hey Aussies–Why did y’all put a weather station on a little ole island like that? —Judy in Troup, TX
Morning radio news papers here in Oz report measured wind velocities up to 290 km/h. That’s cat 5 even on the international scale.
Mission Beach is well known for its flightless cassowaries (think of an ostrich with a bad temper). It may be some poor birds got a taste of what flight is like overnight.
“”””” Bruce says:
February 2, 2011 at 2:09 pm
Morning radio news papers here in Oz report measured wind velocities up to 290 km/h. That’s cat 5 even on the international scale.
Mission Beach is well known for its flightless cassowaries (think of an ostrich with a bad temper). It may be some poor birds got a taste of what flight is like overnight. “””””
Maybe those grouch birds are like the Penguins; they just don’t know that you have to flap a little bit harder, to get airborne.
Any way, what’s the difference between the Flightless Cassowaries of Mission Beach, and the regular flying kind; and are they a bit like the Emu, and taste like chicken ?
At around 4:00 AM PST this morning, our local T&V news reports from Australia (actually on a Communist Red China TV News Station), said that peak winds of 300 kph had been measured on the south eye wall area.
So any idea where exactly the eye went through; specially that south wall. I guess my Aussie buddy, who’s built like a Cape Buffalo (ex-cop) lives off the Gold Coast; some place called Bribie Island.
Willis Island is a perfect place to monitor TC’s from. Its a brick bunker and the location of the Radar there makes a huge difference to our knowledge of the actual strength and particularly the position of the eye of the approaching TC’s . It also has great fishing I’m told.
The eye crossed over Mission Beach where my uncle lives. He reports it was much stronger than TC Larry .The eye took about an hour to pass, with the transition to huge winds from opposite direction only taking a minute r so. The second half was worse than the first and it took about 8 hours to pass. The trees are all stripped of leaves and many are down. Most power poles are standing, his house and many in the town took the full brunt of the wind with reported strengths close to 300Km/h. But the concrete filled walls , stood up well. There are many houses without roofs.
Tidal Surge was only a couple of meters which missed the high tide. No reports of fatalities as of yet. Thanks for your concern , thoughts and prayers.