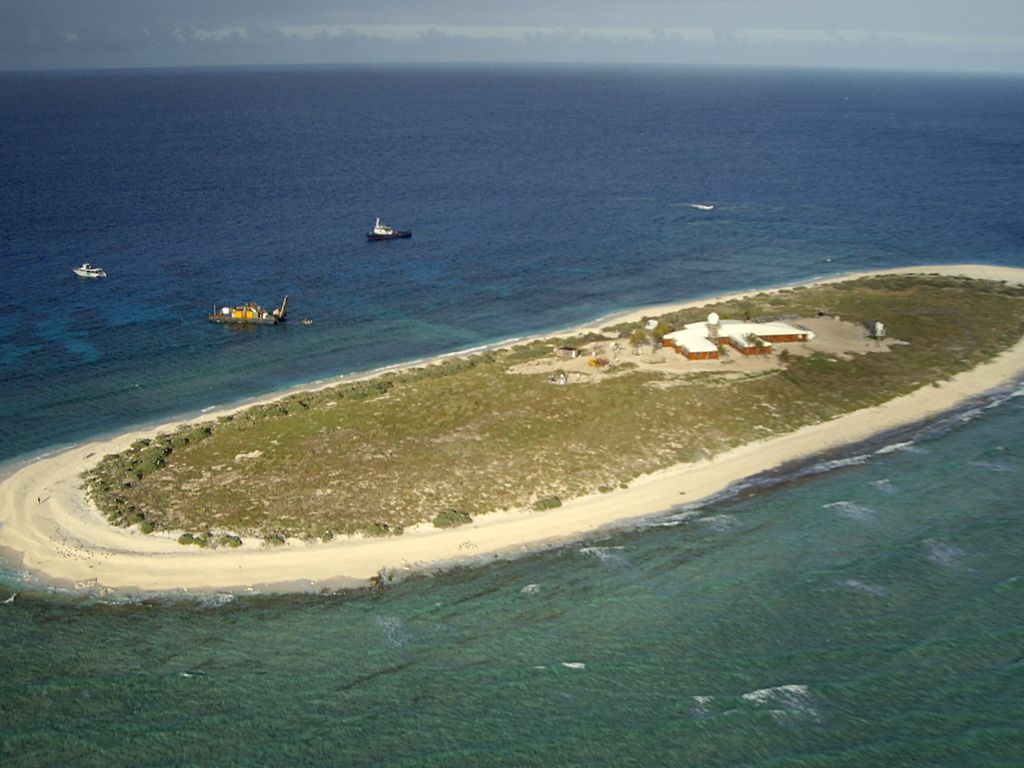
In our previous post, we highlighted the BoM weather station on Willis Island, and wondered what would happen to it and to the staff who worked there.
Fortunately the staff has been evacuated prior to Yasi hitting the island. They apparently left everything running on automatic, including the radar. The data from the weather station tells the story of the approach and the hit.
Temperature and dewpoint converge as the air and the sea become one.
 The humidity pegs the meter.
 Rainfall soared.
 Barometric pressure dropped like a rock.
 And the wind peaked, the equipment failed, and the station went silent.
 The last radar image from the Willis Island BoM radar showed a massive eye.

You can watch the story the data tells at other weather stations in Queensland, just click on the map below to use the interactive BoM website.

When Cyclone Tracy hit Darwin at Christmas 1974, it was night time and many people had started Christmas festivities in the way that Top End people know. There is still a theory that relaxed (drunk) people can survive falls better than tense, alert people. I was at Head Office in Sydney, but we had more than 80 staff and family people in Darwin. Some has been blown from the first level to the ground when the home was taken off at floor level, which was commonly on stilts.
This being the Top End, there was deep sympathy for those who were hurt or who perished. There was also a string of incredible stories from those who were there. (It’s a place of adversity and diversity). Like the imprint of a refrigerator in the side of the high steel tank that was Darwin’s immediate water supply. Like the hippie couple who had tried LSD for the first time and were heard walking through the ruins at first light muttering “Wow! What a trip. I’m off this for Life.”
In hindsight, the death toll was low because of a simple piece of architecture. It was common for the home laundry, often beneath the house on stilts, to be built from concrete brick. This was the safe refuge for many families. Despite this being widely known, I have never seen a proposal to build similar cheap boxes in cyclone prone areas elsewhere. By tomorrow, I hope that not many Queensland people are missing for the lack of a brick laundry.
wayne says:
February 1, 2011 at 10:05 pm
“I’m looking how T barely moved but DP merged.”
You may notice also 100% humidity during that time. Very cool data.
The BOM are pretty good at monitoring – as anyone who has been watching this cyclone can attest. They have good public access to satellite maps and all the rest, updated every 10 minutes or so.
If only they continued to focus on this essential work (what expensive and redundant management consultants would call their core mission) and got out of ideologically driven futurology, the world would be a better place. It also seems to indicate, as posters in other WUWT threads have suggested, that like the UK Met Office, there are 2 camps in the organisation. There are the ‘sexy’ futurologists, and the serious science and technical people who work hard to provide this essential service to the best of their ability.
Given our small population and massive area, I dips my lid to the real workers in the BOM who have made it possible for everyone to see what is happening so clearly and easily. Of course, they are piggybacking on the work of others in terms of satellite monitoring etc. Still, anyone in the world with internet access can follow exactly what is occurring – no data fudging possible there. And, touch wood, the sites are managing the increased traffic just fine.
What a contrast to the voodoo and spin of the futurologists, who are no doubt on the fast track for promotion in the BOM!
My money is on the storm surge having taken out the weather station, a close up view of the island shows it is only a few meters above sea level.
Thanks, Anthony, wonderful how technology gives us new windows on our world.
It’s amazing to think as I sit here in a small village in scotland, I can see the latest radar from the other side of the world almost live!
Compare that to the time when I lived in Australia in the 1960s. We literally had to wait 4 hours for a telephone line to come free to make a telephone call back to England – one which had to be booked something like a month in advance.
It’s the sheer simplicity of reporting on disasters the other side of the world which is why the news is now full of natural disasters!
This is why everyone thinks the world has more natural disasters … the public and media are being bombarded to overload with this and that natural disaster and they cannot help thinking the number and severity has gone up … but the scientific facts speak otherwise!
Eyeballing the temp data for willis island since 1921 (using the BOM monthly charts) it sure doesn’t look like its been warming up there for the last 90 years.
I was curious because the island would have little in the way of UHI signature, assuming the paths and hardscape is clear of the recording devices.
Looks like Innisfail is going to be where it lands.
http://www.bom.gov.au/products/IDR192.loop.shtml#skip
Jack rants
————-
Even the simplest school child knows this is about the La Nina pattern.
————-
Probably not true. But then again it was just an insult, not that anyone cares.
However if it was La Nina we would have a cyclone of similar magnitude every time we have a La Nina. And we don’t.
Why don’t you just count it as a random event possibly made worse by La Nina and possibly made worse by CO2. A lot more honest.
Have you noticed the sea surface temperatures off the coast of Queensland?
Lawrie Ayres, it could be that the rain gauge broke.
Baa Humbug:
I have to agree with you. I’ve looked at all wind speeds in the area to 8pm when the BOM says coastal areas between C Flattery and Sarina are experiencing damaging winds with gusts up to 90km/hr:
Townsville had a gust at 98kmh at 8pm, Hamilton Island 109kmh (117 at 4pm and 5pm), Lucinda gusting over 100kmh since 3.30pm, highest 120 at 6.30pm, and obviously between Innisfail and Cardwell would be similar. but none others within cooee. Cairns at 8.00 48kmh!
Willis Island would have gone higher than 185 as the pressure kept going down, but highest gust recorded anywhere else was 167 at Flinders Reef at 2pm, 141 at Holmes Reef at 7pm. Next highest was 120 at 6.30 at Lucinda. So I will keep checking the figures for the next 12 hours or so but the wind speeds are nothing like what has been claimed, certainly nothing approaching 290kmh. Thank goodness for that! Time will tell, let’s hope it fades away to nothing.
Bruce left Willis.
(Couldn’t resist)
One of the TV media stations has almost continuous coverage of this coming event.
The host of the program interviewed a weather disaster expert earlier on this evening Australian Eastern time.
The host kept talking this current event up – e.g.
Stating that is the largest cyclone for 100 years. Nope, said expert citing other past events.
Host tried again : largest in living memory? Not really said expert citing other past events.
Host: this will cause the most damage? Nope, said expert.
Don’t think that expert will b e invited back again.
Thnaks Antony, good reports.
Jeff C says: February 1, 2011 at 9:58 pm
If you can ring/text your son. Then ask him to organise a group of 10. Chat/text their names, family and contact details. Then switch off mobiles (or maintain recharging) and use 1 contact a day to contact one family member and relay messages to other 9.
Likely if direct hit network will go or be slack, power could be off for a week (worst scenario).
Worst is the CLOGGING of the networks as everyone texts or tries to ring.
Baa Humbug says: February 1, 2011 at 11:30 pm
Yes, the pub and empty bottles are a good idea- can fill with clean water. And the mattreses are also handy.
People here have been saying that it is reported worse than it is.
I still reckon a direct hit south of Cairns and people not nestled down could be in for some trouble. Better to be safe, cheery and with friends.
Jeff C and Baa Humbug
But if the beer pumps are electric and they lose mains power?
Thanks Anthony, great post!
This is one of those events where Twitter actually becomes extremely useful for realtime news updates:
http://search.twitter.com/search?q=%23tcyasi
And ABC News 24 (Australia) has unblocked its realtime TV stream for global viewing:
http://www.abc.net.au/news/abcnews24/
I notice that Australia’s “Warmistbureaupolitik” the ABC simply cannot help themselves. http://www.abc.net.au/news/stories/2011/02/01/3127091.htm
Once again (like the Queensland floods and Victorian fires (early ’09)) they make some vague loose ‘couldbe- maybe’ references to how AGW might be responsible. They also fabricate a “fact” about a 100% increase in C4 and C5 cyclones globally, however this is irrefutably incorrect.
(See: http://www.coaps.fsu.edu/~maue/tropical/)
“Since 1979…Global TCs of Hurricane Force + show no upward trend in frequency.”
It would appear that Yasi is Katrina’s big brother.
Patrick Davis says:
February 1, 2011 at 10:47 pm
“Lawrie Ayres says:
February 1, 2011 at 10:10 pm”
I agree with your sentiments however, the Australian media are stroking this one for all they can.
By Bonnie Malkin, Sydney 7:30AM GMT 02 Feb 2011
After intensifying overnight, the storm is travelling at 20mph and measures 360 miles wide. The same strength as Hurricane Katrina, the storm is expected to be the biggest and most deadly cyclone to hit Australia in history.
http://www.telegraph.co.uk/news/worldnews/australiaandthepacific/australia/8297904/Cyclone-Yasi-La-Nina-and-record-ocean-temperatures-behind-storm.html
By Bonnie Malkin, Sydney 10:30AM GMT 02 Feb 2011
Alan Sharp, national manager, tropical cyclone warning services, of the Australian Bureau of Meteorology, said the cyclone was the worst Australia had seen for more than a century.
“Yasi is not enormously unusual but it is at the top-end of the scale as far size goes as well as intensity,” he said.
The country’s most deadly cyclone to date hit in March 1899 cyclone, striking a pearling fleet on Cape York Peninsula and killing more than 300 people.
A major global study in 2010, based on complex computer modelling, found that tropical cyclones will become stronger, with the intensity increasing between 2 and 11 percent by 2100.
http://www.telegraph.co.uk/news/worldnews/australiaandthepacific/australia/8297904/Cyclone-Yasi-La-Nina-and-record-ocean-temperatures-behind-storm.html
The worst most deadly cyclone to hit Australia was Cyclone Tracy, which devastated the Northern Territory capital of Darwin in 1974, killing 71 people.
http://www.telegraph.co.uk/news/worldnews/australiaandthepacific/australia/8297597/Cyclone-Yasi-factfile.html
Here is a list of the most deadly cyclones in history:
1. Bhola Cyclone 1970
In November 1970, 500,000 people were killed when the Bhola Cyclone hit what is now Bangladesh.
2. Indian Cyclone 1839
In 1839 a powerful cyclone struck India, killing 300,000 people.
3. The Calcutta Cyclone 1733
There are few records about this cyclone, but the weather system is known to have killed 300,000 people and destroyed 20,000 ships when it hit Calcutta in 1737.
4. The 1975 Super Typhoon Nina 1975
The Super” Typhoon Nina was one of the largest recorded typhoons in history and the second most deadly hurricanes in the Pacific.
5. The Great Backerganj Cyclone 1876
In 1876 this cyclone formed over the Bay of Bengal. Its maximum wind speed recorded was at over 136mph and the largest storm surge was 45ft. The cyclone killed around 200,000 people and the property damage was massive. The storm also caused famine and epidemic.
6. Cyclone Nargis 2008
In May 2008 Cyclone Nargis hit Burma, packing winds of up to 133mph.
As it slowly travelled over the country, 1.5 million people were affected. The Labutta Township alone was reported to have 80,000 dead, with about 10,000 more deaths in Bogale. An estimated total of 146,000 people died.
7. The Bangladesh Cyclone 1991
On the night of April 29, 1991, the southern part of Bangladesh, Chittagong, was hit my a powerful Cyclone., with wind speeds of up to 160 mph. At least 138,000 people died in the storm,
9. The Swatow Typhoon 1922
The Swatow Typhoon in 1922 was first spotted July 27 near the Caroline Islands in the Pacific Ocean. The typhoon moved slowly north as it intensified. In August the typhoon hit the Chinese city of Swatow with the winds blowing at 100mph. The water levels as the storm hit were 12ft above normal and left the land saturated with water many days after. Nearly 50,000 people were taken as the storm swept over Swatow.
10. Calcutta Cyclone 5th October 1864
On October 5 1864, a powerful cyclone hit near Calcutta, India, killing around 60,000 people. Over 100 brick homes and tens of thousands of tiled and straw huts were leveled. Most ships in the harbor (172 out of 195) were either damaged or destroyed.
http://www.telegraph.co.uk/news/worldnews/australiaandthepacific/australia/8297595/Cyclone-Yasi-worst-cyclones-in-history.html
2 hrs to landfall.
The mayor of Innisfail – where the cyclone will make first landfall – was just interviewed.
A few hours ago the police and emergency response did a house to house with mandatory orders to evacuate. Around 100 people failed to comply – they are on their own.
Now emergency calls are being received from some of those people. They are in desperate situation. There is nothing emergency services can do. Very bad.
Landfall still two hours away.
Hold on to your hats! we will be told by the BBC that this is Anthroprogenic Global Warming
Thanks to Zorro:-
Cyclone Ingrid, 2005: a category 5 cyclone, it swirled across three states and territories — Queensland, the Northern Territory and Western Australia. It was small in size but very intense. No reports of serious injury or death.
Apparently, according to BBC lunchtime News (BBC1) today (02.02.11), Australia has “rarely, if ever” faced a storm of such magnitide! Plus the recent Queensland floods were the “worst ever”. S0 1974 was a walk in the park as were the two in 1918? I would happy for someone to confirm or deny those BBC statements of fact. I expect they are being a little picky to sensationalise it, & it’s always easy to get a bystander to burst into tears for the camera.
This data points to a mediocer storm, hurricane-wise. 60 mm = 2.36 inches, 185 km/hr = 115 mile/hr.
Perhaps this equipment gave out way before the storm hit since it was supposed to be a cat 5 storm (> 250 km/hr = 155.4 miles/hr ).
For a look at where the Eye is right now, check out either of these two Rain Radar loops:
256 km Cairns Radar Loop
256 km Townsville Radar Loop