By Steven Goddard
The topic this week is verification of data sources. NSIDC reports :
At the end of the month, extent fell near the level recorded in 2006, the lowest in the satellite record for the end of May
That sounds bad! Let’s see how 2010 compares with ten, twenty and thirty years ago :

Ice looks healthier than 10 years ago

Ice looks healthier than 20 years ago

Ice looks healthier than 30 years ago
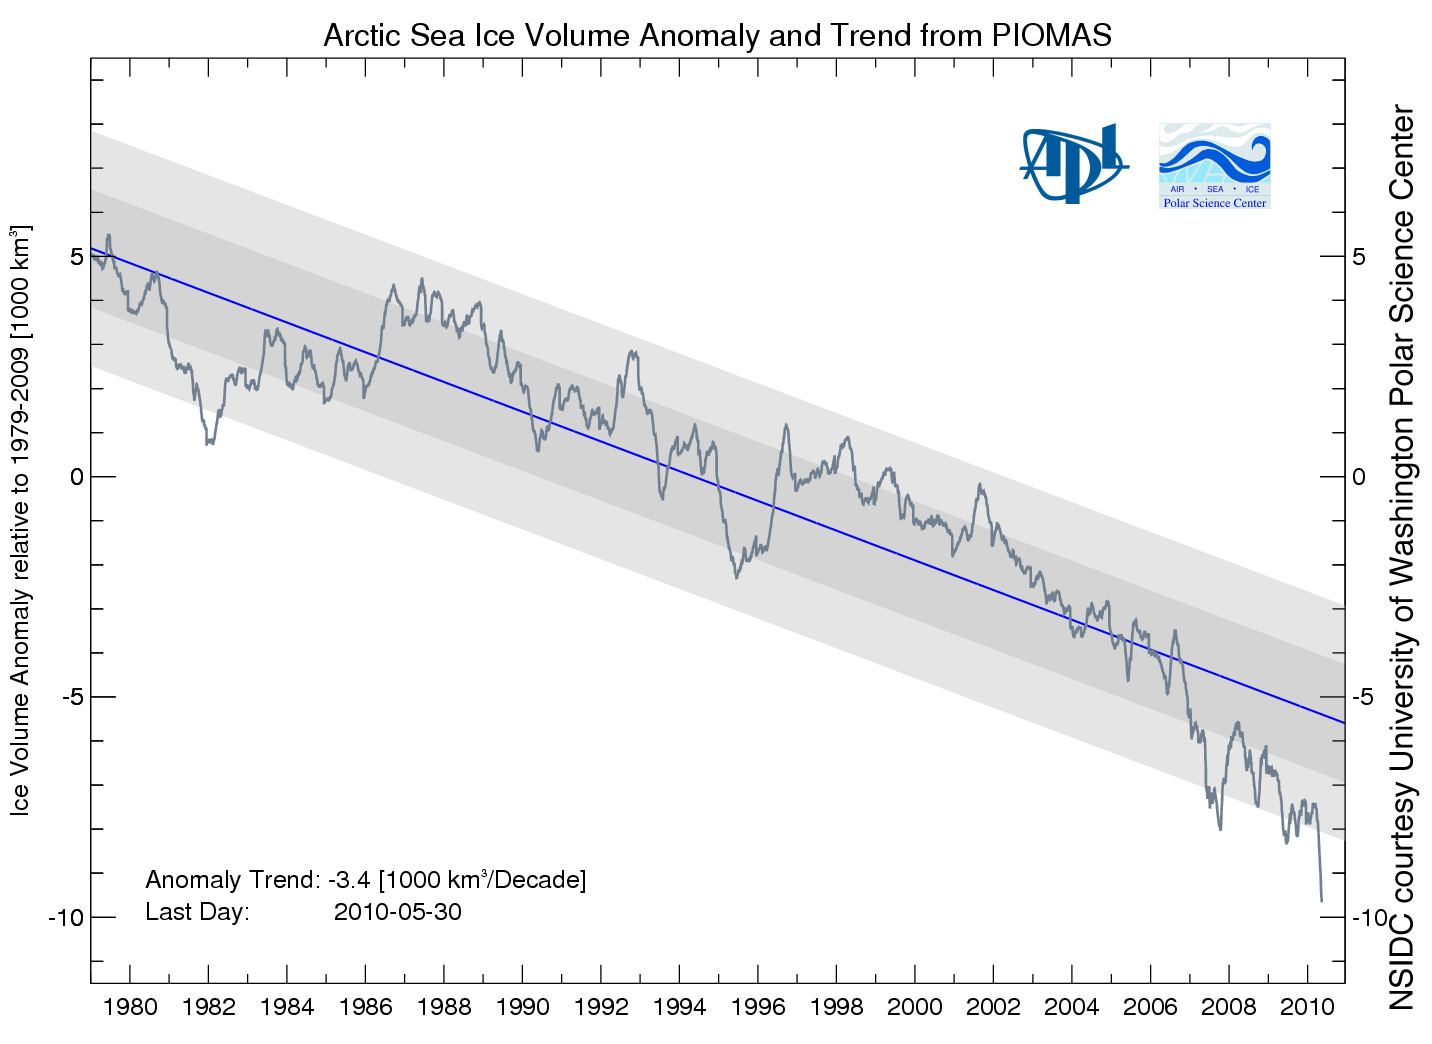
Then NSIDC discussed my favorite graph from PIOMAS, showing a record low anomaly of Arctic ice volume.

PIOMAS shows an anomaly nearly 50% greater than 2008. If that is correct, then surely we will have a record minimum this summer. However, the PIOMAS data seems inconsistent with PIPS2 data, which shows thicker ice covering a much larger area in 2010. My guess is that PIOMAS is looking at only a small region of the Arctic interior.
Next data source to look at are the Arctic Ice Concentration maps. UIUC has archived lower resolution maps since the start of the satellite record, such as the one below for June 11, 2010.

Their newer maps appear to show a lot more detail.
")
Note that the newer map shows a lot of low concentration ice in the Beaufort Sea (green, yellow, light pink.) Let’s see how that compares with a current satellite photo.

I must be missing something, because I don’t see much of that low concentration (green) ice in the satellite photo. The two videos below compare satellite vs new and old concentration maps. New comparison first :
The old concentration maps correlate much more closely with the satellite photo.
You can also see in the video below how erratic the bands of yellow and green are in the newer maps. They appear one day and disappear the next.
In the low colour version of the video, it appears that they may be having trouble differentiating between cloud cover and low concentration ice. We see large areas of open water switching to saturated ice overnight, and vice-versa.
It appears that the precision of the newer maps is much greater than their accuracy. Better to use a low precision map which is matched correctly with its accuracy.
Moving on, Barrow Sea Ice is starting to show first signs of thinning. By June 16, 2007 the ice had already broken up.
.
http://seaice.alaska.edu/gi/observatories/barrow_sealevel/brw2010/BRW_MBS10_overview_complete.png
Temperatures in the Arctic have continued below normal and below freezing for the last few weeks.
")
http://ocean.dmi.dk/arctic/meant80n.uk.php
NCEP is forecasting below freezing temperatures for much of the Arctic Basin during the next week.

This week, the sun reaches its highest point in the sky. Next week it starts its decline towards winter.
Now, the really interesting stuff. Arctic Basin sea ice volume (calculated from PIPS maps) remains close to the 2006 track, and well above the last three years

Area is slightly below 2006 and 2009.

Thickness is nearly identical to 2006 and 2007.

Conclusion : 2010 minimum extent is on track to come in just below 2006. With the cold temperatures the Arctic is experiencing, the likelihood of a big melt is diminishing.
NSIDC shows extent lower than 2007. The modified NSIDC map below shows where they believe the gaps are (in red.)

On the surface, this appears to disagree with my measurement above that Arctic Basin ice area is greater than 2007. The difference is that I am only considering regions that have perennial ice – i.e my PIPS calculations assume that there is no summer ice in Hudson Bay or the Barents Sea, and that they are a “don’t care” for estimating minimum extent. You can see in my PIPS ROI (Region of Interest) maps for June 14 below, that there is excellent agreement between PIPS and NSIDC. 2007 had less ice in the Chukchi and Laptev Sea, and more in the Beaufort Sea.

PIPS June 14, 2010

PIPS June 14, 2007
The modified NSIDC image below shows ice loss since June 3.

The modified NSIDC image below shows ice loss since early April.

And finally, the modified NSIDC image below shows regions which have below normal ice extent.

My analysis indicates the highest late summer extent since 2006. In discussing, please remember that the regions in red above normally have no ice in September. They don’t figure in to the summer minimum.
Sounds like a classic case of The Heisenberg Principle. Better break that ice up as quickly as possible to assure maximum melt.
No doubt Barber is correct and the Arctic will be ice free in three years.
“Science is the belief in the ignorance of the experts”
Richard Feynman
Xi Chin made an interesting comment when he wished there were a abstract or summary at the beginning of the article/post. The back and forth of “I said-he said” does leave one scratching his head at times, though obviously the writer believes he comes out best. The response-blogs are the equivalents of peer-reviewed comments, but without a synopsis or consensus agreement.
There is a huge amount of value in the post-normal science, intelligent-observer auditing going on as represented by this and other high quality blogs. The problem is that, as there is no summary/conclusion, it becomes fluff, or a tangle of string. There are books here made up of chapters simply created by distilling the statements and counterstatments (and data) each topic stimulates. The AGW and anti-AGW positions already have books, of course, but they are predictable and one-sided positions (and, in part, rants). If ever there is to be a public debate about the current temperature rise, ice loss and ocean acidification, the skeptic position would be enriched by an objective review of these blog dialogues. The alarmists don’t do these things (nor do they list the skeptic blog locations). They claim that giving time to skeptics gives credence to their doubts. I’d say it weakens their ability to rationally discuss the subject. But then, the main alarmist argument is to fall back on authority, either of the government spokesperson or the scientists who gathered the data. The difference between explaining what a thing is (i.e. the picture the data shows) is, of course, different from explaining how or why a thing is (i.e. the key items, patterns or processes involved). The alarmist view does not recognize this difference; the blog-audits do.
To return to Xi Chin’s point about abstracts or summaries: if, every few months, a wrap-up of key reports and rebuttals were done, we would be both enlightened and armed against the non-reflective alarmist arguments. Either the Arctic sea ice is increasing (extent, thickness, volume) or it is not: regardless of what we read here, the pro-melt faction doesn’t budge or reconsider their position. Why? Is it because we don’t finish what we started, don’t answer their dismissals with data they cannot refute, or because our position is no more tenable than theirs, and their advantage is fundamentally that they, like the incumbent politician, are the ones “in office” right now. In military situations, it takes a 4 to 1 (or more) advantage to take a defended position: is that where we are at in the AGW battle?
Layne Blanchard
The big question is – can the US ever score a goal in the World Cup, or do they always have to rely on the other team to put the ball in the net for them?
In the 1970′s, an impending ice age was all the rage by climate scientists – now it’s global warming and rapidly increasing in sea levels… unprecedented in earth’s history. What next?… ”
No. The majority of peer reviewed studies in the ’70s predicted warming due to Co2 and stated that the cooling trend was just a short term trend.
http://www.skepticalscience.com/ice-age-predictions-in-1970s.htm
It would help the skeptic cause not to constantly repeated widely confuted factless claims that are little more than urban legends. It makes skepticism sound like 9/11 conspiracism.
The one thing few people consider when arguing about Arctic ice and that is the variations in the salinity of that ocean.
Northern Canada appears to have had unusually low rainfall this winter, therefore the rivers there will be transporting less fresh water into the Arctic. Fresh water is less dense and probably slightly warmer than the Arctic Ocean’s water – therefore fresh water from the rivers should tend to lie on top of the sea water.
Therefore reduced inflows of fresh water into the Arctic Ocean should act as an effective inhibitor to the rate at which ice forms in winter and as as accelerator to the ice melt in summer. This is almost certainly a localised effect, but may help explain why the ice does not melt at an even rate throughout the Arctic.
Paul McCulloch says:
June 15, 2010 at 9:56 am
‘Reports of Record Arctic Ice Melt Disgracefully Ignore History’ by Noel Sheppard (September 9, 2007):
“Roald Amundsen, a Norwegian explorer who successfully navigated the Northwest Passage on August 26, 1905… this Passage was clear enough of ice for a wooden sailboat, with a crew of seven, to successfully navigate it more than 100 years ago”.
So clear of ice was it that shortly after that he had to leave his ship at King’s point for the winter and sled overland to send a telegram to tell the world that he had traversed the passage and was clear of the archipelago! He resumed his journey the following summer. Of course he’d had to complete the passage piecemeal over three seasons, in contrast to yachts travelling from Alaska to Newfoundland (or vv) in a single summer these days.
stevengoddard says:
June 15, 2010 at 10:19 am
This is what the mountains above the National Snow and Ice Data Center look like this morning, covered with lots of fresh snow. View from the north.
__________
Thanks for that Steve…we are indeed quite fortunate to live in the beautiful State of Colorado…aren’t we!
R. Gates,
I love summers in Colorado. As a cyclist, the past few winters have had too much ice on the road though. I gave up on cycling for more than four months this winter.
NCEP is now forecasting freezing Arctic temperatures into July.
http://wxmaps.org/pix/temp2.html
Steven Goddard
“It appears that the precision of the newer maps is much greater than their accuracy. Better to use a low precision map which is matched correctly with its accuracy.
This useful set of animations would seem to reinforce the argument I have made several times on these Arctic ice threads, that higher imaging resolution does not necessarily translate to better detection of trends. Although as R Gates repeatedly shows its easy to be dazzled by such technical parameters in a nerdish sort of way. As you demonstrate, high resolution can introduce spurious phenomena which militate against accurate determination.
phlogiston says:
June 15, 2010 at 11:39 am
Steven Goddard
“It appears that the precision of the newer maps is much greater than their accuracy. Better to use a low precision map which is matched correctly with its accuracy.
This useful set of animations would seem to reinforce the argument I have made several times on these Arctic ice threads, that higher imaging resolution does not necessarily translate to better detection of trends. Although as R Gates repeatedly shows its easy to be dazzled by such technical parameters in a nerdish sort of way. As you demonstrate, high resolution can introduce spurious phenomena which militate against accurate determination.
___________
Or, as the high resolution satellite image that I gave a link to displayed– that the high resolution concentration data was pretty much right on target, and the lower resolution version missed the finer detail, and when it comes to Arctic Sea ice and so many other things in science, the devil is indeed in the details!
Stevengoddard says:
Given that, I can’t see how multi-year ice can get significantly thicker than new ice – apart from snowfall on the surface.
And, as ice-covered water loses heat a lot slower than open water, ice thickness must be influenced far more by the speed, direction and temperature of the sea currents beneath the ice than by the air temperature above it.
Hypnos says:
Ah yes, science by consensus.
Many of us are old enough to remember the ’70s, and I can tell you that there was a lot more to it than just a Newsweek article.
I forgot to add: how did they explain the ‘short-term cooling trend’?
“Hypnos says:
[…some revisionistic statement about the 70ies…]”
Cool nickname, Hypnos! Hail…
..the…
…Hypnotoad..
This is what Stephen Schneider looked like in the 70ies:
This is what Schneider looks like today:
The first video states that Schneider said in an interview “In 70, 71 i was more worried about cooling” so Hypno Toad might be right: The alarmist cause might have switched somewhere in the mid 70’s from cooling to warming, giving “warming” an opportunity to gain the pole position in that grand game of counting peer-reviewed papers we colloquially know as “science”.
This fellow Barber has quite a following of trolls and appears to be their new Messiah. Hardly surprising that they would need a new Messiah, since their previous spiritual leaders have all recently been proven to have feet of clay, big time.
I was nearly caught up enough in the religious fervour to click one of the links to his many gospels being pressed upon us, until I read a post referring to his many student assistants.
No change there then. Just another freeloader on the gravy train justifying his existence.
And by the way, this lot of trolls are extremely discourteous in some of their postings – whilst prepared to tolerate their points of view, I find their manners boorish and tiresome.
Dr Barbers presentation is an absolute treasure. It’s a must see for skeptics like me.
It seems that the recovery from the little ice age continues unabated.
stevengoddard says:
June 15, 2010 at 11:29 am
NCEP is now forecasting freezing Arctic temperatures into July.
http://wxmaps.org/pix/temp2.html
Hm, I see the anomaly map at the bottom shows mostly red (positive) in the Arctic, so temperatures will be above average.
Dang! The first video is a part of this:
and it’s from 1978 – so the imminent Dr. Stephen Schneider, grandmaster of global climate alarmism, didn’t switch from cooling to warming before 1978. Ok, Hypnos, i think your scecpticalscience link is a severe distortion of the facts.
Xi Chin says:
June 15, 2010 at 1:36 am
I really wish that each article would start with an abstract, or executive summary.
Well this particular article in its entirity consists of about 4 dozen sentences and a whole load of pretty pictures (with captions) – an executive summary would be a significant fraction of that.
Articles on WUWT are not 200 pages of turgid waffling (thankfully) where executive summaries are required to prep you for how much of your life you’re going to be wasting by reading it.
jakers
I didn’t realize that there is a lot of sea ice in central Alaska.
This is not a challenge or accusation, I’m deeply skeptical but …I wonder could someone explain to me how the six polar images at the start of this article, from ten, twenty and thirty years ago all use exactly the same format/background etc. I would have expected there to have been some change or modification just to the style, colouring or layout. How were these images generated? Thanks.
DirkH, I really don’t get your point.
Someone states scientists in the ’70s were predicting an ice age. I show that as false, given that most scientists in the ’70s were predicting warming.
That is not to prove any kind of truth by consensus. I am not saying the majority of scientists predicting warming were right (even tho they proved to be right). I am saying the claim “Scientists were predicting an ice age in the ’70s” is demonstratably false because most of them were predicting the exact opposite.
You post some videos about one scientist changing his mind. So what? That goes to his credit. He refined his theory and discovered he was wrong. In fact, in 1977 he said: “we just don’t know enough to chose definitely at this stage whether we are in for warming or cooling— or when.” Sounds to me like proper science.
http://stephenschneider.stanford.edu/Publications/PDF_Papers/Schneider1977.pdf
So, my point is: the claim that a majority of climate scientists predicted an incoming ice age is the ’70s is false.
If you want to counter it, you need to find a majority of climate scientists in the ’70s (the period given by Skeptical Science is 1965-1978) claiming an ice age was upcoming. One will not do. Two won’t either. It’s that simple.
Interesting to look at the Laptev Sea from sat pics vs. the cryo concentrations. They have mostly greens and blues, and the sat image doesn’t seem to jive with that.
http://arctic.atmos.uiuc.edu/cryosphere/NEWIMAGES/arctic.seaice.color.000.png
http://ice-map.appspot.com/?map=Arc&sat=ter&lvl=7&lat=73.190674&lon=-137.618661&yir=2010&day=161
Thoughts?
Of all the comments I’ve read to this, this one made me chuckle the most (so far):
“By that, I assume you meant the excess CO2 that may have been put in the atmosphere by human activties over the past few hundred years…for certainly, CO2 plays a big role in providing a nice warm planet, and without it, the ice in the Arctic would be covering the whole planet in very short order. So yes, CO2 has very much to do with what goes on in the Arctic, both this September, and every single day.”
Trust in the real science of geology and natural cycles, not in the dodgy scientific theories of grant-obsessed, government employees seeking to preserve comfortable lifestyles by peddling alarmist nonsense to the gullible masses. Correction: not so gullible masses – the tide of public opinion on AGW is moving steadily in the direction of sanity, not stupidity.