By Steven Goddard
The topic this week is verification of data sources. NSIDC reports :
At the end of the month, extent fell near the level recorded in 2006, the lowest in the satellite record for the end of May
That sounds bad! Let’s see how 2010 compares with ten, twenty and thirty years ago :

Ice looks healthier than 10 years ago

Ice looks healthier than 20 years ago

Ice looks healthier than 30 years ago
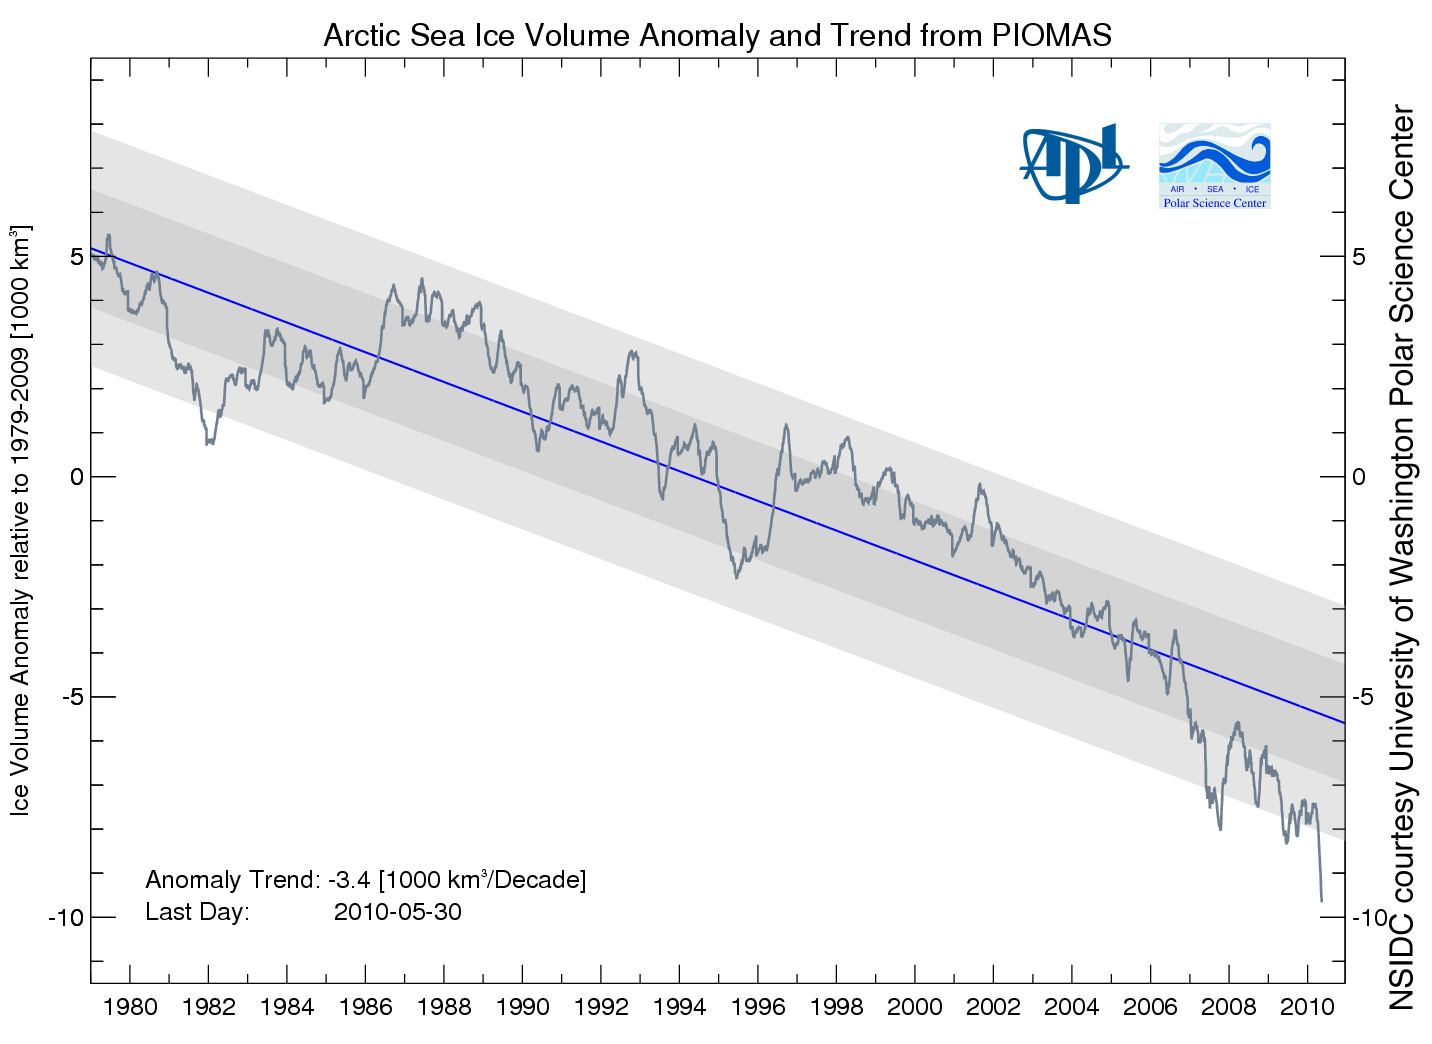
Then NSIDC discussed my favorite graph from PIOMAS, showing a record low anomaly of Arctic ice volume.

PIOMAS shows an anomaly nearly 50% greater than 2008. If that is correct, then surely we will have a record minimum this summer. However, the PIOMAS data seems inconsistent with PIPS2 data, which shows thicker ice covering a much larger area in 2010. My guess is that PIOMAS is looking at only a small region of the Arctic interior.
Next data source to look at are the Arctic Ice Concentration maps. UIUC has archived lower resolution maps since the start of the satellite record, such as the one below for June 11, 2010.

Their newer maps appear to show a lot more detail.
")
Note that the newer map shows a lot of low concentration ice in the Beaufort Sea (green, yellow, light pink.) Let’s see how that compares with a current satellite photo.

I must be missing something, because I don’t see much of that low concentration (green) ice in the satellite photo. The two videos below compare satellite vs new and old concentration maps. New comparison first :
The old concentration maps correlate much more closely with the satellite photo.
You can also see in the video below how erratic the bands of yellow and green are in the newer maps. They appear one day and disappear the next.
In the low colour version of the video, it appears that they may be having trouble differentiating between cloud cover and low concentration ice. We see large areas of open water switching to saturated ice overnight, and vice-versa.
It appears that the precision of the newer maps is much greater than their accuracy. Better to use a low precision map which is matched correctly with its accuracy.
Moving on, Barrow Sea Ice is starting to show first signs of thinning. By June 16, 2007 the ice had already broken up.
.
http://seaice.alaska.edu/gi/observatories/barrow_sealevel/brw2010/BRW_MBS10_overview_complete.png
Temperatures in the Arctic have continued below normal and below freezing for the last few weeks.
")
http://ocean.dmi.dk/arctic/meant80n.uk.php
NCEP is forecasting below freezing temperatures for much of the Arctic Basin during the next week.

This week, the sun reaches its highest point in the sky. Next week it starts its decline towards winter.
Now, the really interesting stuff. Arctic Basin sea ice volume (calculated from PIPS maps) remains close to the 2006 track, and well above the last three years

Area is slightly below 2006 and 2009.

Thickness is nearly identical to 2006 and 2007.

Conclusion : 2010 minimum extent is on track to come in just below 2006. With the cold temperatures the Arctic is experiencing, the likelihood of a big melt is diminishing.
NSIDC shows extent lower than 2007. The modified NSIDC map below shows where they believe the gaps are (in red.)

On the surface, this appears to disagree with my measurement above that Arctic Basin ice area is greater than 2007. The difference is that I am only considering regions that have perennial ice – i.e my PIPS calculations assume that there is no summer ice in Hudson Bay or the Barents Sea, and that they are a “don’t care” for estimating minimum extent. You can see in my PIPS ROI (Region of Interest) maps for June 14 below, that there is excellent agreement between PIPS and NSIDC. 2007 had less ice in the Chukchi and Laptev Sea, and more in the Beaufort Sea.

PIPS June 14, 2010

PIPS June 14, 2007
The modified NSIDC image below shows ice loss since June 3.

The modified NSIDC image below shows ice loss since early April.

And finally, the modified NSIDC image below shows regions which have below normal ice extent.

My analysis indicates the highest late summer extent since 2006. In discussing, please remember that the regions in red above normally have no ice in September. They don’t figure in to the summer minimum.
Lucia already has a “betting” pool. I believe her long-range one is closed, but later there will be a mid-range bet and a short-range bet.
Julienne
As always, thank you for the very helpful explanations!
Steve from Rockwood
Water which is insulated from the air by two metres of ice and a foot of snow, will scarcely know the difference between -33C and -30C air temperatures.
stevengoddard says:
June 15, 2010 at 4:48 am
BillD
“Rotten multi-year ice.” That is a new term. Where can I find a boat that cruises through four metre thick ice? Too bad the Titanic didn’t have that technology.
Steve;
Anyone who wants to understand what’s happening with the arctic sea ice should probably look at Dr. Barber’s presentation. My undertanding is that the multi-year sea ice is melting from below and breaking into chunks that ships can readily go through. Barber and his team and the ships crew were also very surprised to see swells penetrating miles into what was considered multiyear ice. This means that there were numerous gaps in this long term ice. His presentation is on the order of 40 minutes,with many photos and diagrams as well as graphs of data and I only watched it once. The point is that their ship was only supposed to be able to penetrate solid ice < 2 m thick, but there readily sailed through ice that was 4 m or more thick because it was broken into chunks. Presumably, the icebergs that the Titanic ran into were much more substantial than last year's sea ice. Since the ship's crew and a scientists with about 30 years of experience in the arctic were very suprised by the condition of the "multiyear ice", one would assume that the conditions that they observed were not routine. Barber and his graduate students are working on journal publications, but we need to wait for the peer-reviewed works.
Oslo says:
June 15, 2010 at 6:33 am
@BillD:
Did Professor David Barber try cruising at high speed through the ice in 1979 as well? Or in 2001? 2009? Or did he just try this last year, thinking that this must be unusual?
For this method to have any validity whatsoever, he should made this trip every year over a 20-year period, with the same speed, same ship, following the same route.
And even then, this doesn’t seem like a very scientific method to me: cruising at high speed through “rotten” ice one year, and drawing sweeping conclusions about the state of the arctic from this little trip.
Oslo:
My understanding is that his ship was in the actic for several months and that he has conducted similar criuses over the last thirty years. He was showing data and photos of conditions that he and others have not reported in the past. I assume that the peer reviewed journal articles will be more rigorous in documenting change, than this plenary lecture, aimed at showing something new.
Joe Lalonde says:
June 15, 2010 at 5:01 am
No, Saskatchewan and Manitoba are not close to the Arctic, especially not any of the parts that actually see agriculture. And Alberta’s little skiffs of snow toward the end of May are not in any way unusual. Annoying, yes, but not unusual.
Alberta, Saskatchewan and Manitoba are all part of the zone that saw lots of precip and cooler overall temps as a result of El Nino, which is also not unusual. In fact, we (I’m in Alberta) look forward to the crappiest, coldest weather in the rest of the continent, that’s when we get the best weather (warmer is better… no matter what some people think).
stevengoddard says:
June 15, 2010 at 8:43 am
Steve from Rockwood
Water which is insulated from the air by two metres of ice and a foot of snow, will scarcely know the difference between -33C and -30C air temperatures.
Right, under those conditions it won’t grow any thicker so there’ll still be less ice to melt in the summer!
Peter Miller says:
June 15, 2010 at 8:35 am
Julienne
You sound like you may know what you are talking about.
Which is better for estimating ice volumes and thicknesses – PIOMAS or PIPs2 (or 3 or 4)? Both use defense satellites to gather their basic data – yet once ‘interpreted’ both produce very different results. Or is this just a simple case of comparing apples with oranges?
———————–
Peter, since I haven’t actually done the comparisons between the two models (and validated them with observations of ice thickness) I can’t say for sure which one is better. I know PIOMAS was validated from 2003-2007 using ICESat ice thickness fields as well as sea ice concentrations from SSM/I and at least during those years, the model performed well. I don’t know what years/data sources PIPS2.0 was validated against.
Any comparisons between the two models should be done using the same fields and over the same spatial region. I’m not sure from the discussions on here if that has been done by Steve or anyone else.
R. Gates says: “I have much more to say about your update, but I think this provides an early quick rebuttal. But as always, a nicely put together post and one that I couldn’t disagree with more!”
I think it certainly is OK to favor a high resolution image over a low resolution but I don’t think I would call it a rebuttal until you provide a high resolution image of 2007 also.
Better technology does not discover a “new” anomalies in comparison to old technology, it discovers new detail and whether it is an anomaly or not isn’t known.
What Steve is doing here is roughly applying a ground truthing to the new data interpretations in comparison to the old. It may well be he lacks the resolutions necessary to do that that others may have but apparently you lack that also so it really isn’t a rebuttal at all.
We have seen unusual steps in datasets occurring frequently in our temperature records and almost always they can be traced to changes in data collection methods or equipment. It becomes a real problem when you have confirmation biases at work where anomalies in one direction are more suspect than they are when in the “right” direction. From this effect alone its pretty clear many of our climate records reflect some level of inaccuracy from this. Unfortunately, there may not be an easy way to resolve this as this kind of new interpretation can be forwarded right into the ice minimum, generate a new record low ice measure despite a complete lack of evidence that what is being seen in the newer higher resolution technology wasn’t there all along.
Thanks Steve for producing this. I can see it isn’t the final word on the matter but will be expecting a real response, not just more new angle shots of leads in the ice pack.
Bill D,
I completely agree with your assessment and I think it is indeed a must watch for anyone who actually wants to understand the science behind current sea-ice conditions in the arctic. Many of the people here have their minds made up about arctic sea ice but those who actually feel they can learn should look up the plenary lecture.
The fact that Goddard is making commentary which suggests that what barber has to say isn’t important begs the question of whether the purpose of all these analysis of sea ice on this site is really to inform the viewers or whether it has another purpose.
I will give Goddard the benefit of the doubt on this one but ignoring the commentary of an actual true expert in studying sea-ice because what he has to say is not what you want to hear is not doing justice to the true state of the science
BillD
Walt Meier tells me that before sea ice starts forming, the water below it has to reaching the freezing point down to a depth of several tens of metres. That makes Barber’s explanation rather unpalatable.
Anyway, water on the Pacific side is running below normal.
Peter Miller says:
“Which is better for estimating ice volumes and thicknesses – PIOMAS or PIPs2 (or 3 or 4)? Both use defense satellites to gather their basic data – yet once ‘interpreted’ both produce very different results.”
Agreement between the two, and to the measured data of IceSat, is actually pretty good. That is if, unlike Steve, you calculate the volumes properly:
http://img808.imageshack.us/img808/6980/pipsvspiomasvsicesat.png
http://ocean.dmi.dk/arctic/meant80n.uk.php can show temperatures above 80N for 2007 too.
kadaka (KD Knoebel) says:
June 15, 2010 at 6:01 am
Why not take a look at the phantom thin ice?
http://ice-map.appspot.com/?map=Arc&sat=ter&lvl=7&lat=74&lon=-139&yir=2010&day=165
And for my 2 cents worth, in the huge arctic basin a fleet of icebreakers becomes quite insignificant.
Steve Goddard says:
“Water which is insulated from the air by two metres of ice and a foot of snow, will scarcely know the difference between -33C and -30C air temperatures.”
I’m not so sure. If a winter shows daily higher averages of a few degrees – even under very cold conditions – the rate of ice growth will be lower. As Phil points out (thanks Phil) there is a relationship between temperature and ice growth.
But I see your point. Summer ice extent varies more greatly than does winter extent, suggesting that summer temperatures are more important in determining minimum ice extent and the approaching summer temperatures appear very close to “normal”.
If you separate short term (year over year) from longer term (the downward trend from 1979) variations in minimum ice extent, the short term variations seem much higher than the error estimates given for ice extent predictions. So a year to year variation of 1.5 million sq km might be considered normal and we should expect a 4.0 – 6.5 million sq km range.
The real question is the downward trend from 1979. Is it part of a longer periodic trend or a worrisome sign of impending doom?
Julienne
As mentioned in the article, I’m not sure what region PIOMAS uses. I’m guessing it is a relatively small area close to northern Greenland – because that is the only place where their numbers make sense.
I’ve been following the individual sea ice areas along with low level wind vectors and oceanic current SST’s. There is nothing unusual about the melt patterns I see. Those that are under ice retaining conditions show average extent/area. Those that are under the influence of wind and currents show predictable extent and area patterns. You absolutely cannot have a conversation about ice extent, area, volume, and thickness data without taking into account – conditions on the ground. Those conditions are available. If you keep tabs on them regularly, Arctic conditions will not prove anything other than Arctic ice responds to wind and currents, neither of which are related to CO2.
As in:
http://www.aari.nw.ru/clgmi/forecast/show_drift.asp?fign=0&lang=0
http://polar.ncep.noaa.gov/sst/ophi/color_anomaly_NPS_ophi0.png
http://www.aquatic.uoguelph.ca/oceans/ArticOceanWeb/Currents/frontpagecur.htm
With just these three weather and SST maps, along with a basic understanding of Arctic currents, one can make a very good educated guess regarding where extent/area has decreased, and where it has not.
‘Polar Heat Bringing Harder Winters by Stephen Leahy’ from IPS website (Jun 15, 2010):
“Barber says an ice-free summer may be just three or four years away, when icebreakers will no longer be needed to navigate the region.”
http://www.ipsnews.net/news.asp?idnews=51826
and…
‘Reports of Record Arctic Ice Melt Disgracefully Ignore History’ by Noel Sheppard (September 9, 2007):
“Roald Amundsen, a Norwegian explorer who successfully navigated the Northwest Passage on August 26, 1905… this Passage was clear enough of ice for a wooden sailboat, with a crew of seven, to successfully navigate it more than 100 years ago”.
http://newsbusters.org/blogs/noel-sheppard/2007/09/09/reports-record-arctic-ice-melt-disgracefully-ignore-history
In view of Steven Goddard’s analysis, I am a bit pressed to accept the notion that the arctic will be ice free by 2014.
In the 1970’s, an impending ice age was all the rage by climate scientists – now it’s global warming and rapidly increasing in sea levels… unprecedented in earth’s history. What next?…
from ‘New Study Says Global Warming May Be Signal of Impending Ice Age
http://www.redstate.com/jeffdunetz/2010/03/04/new-study-says-global-warming-may-be-signal-of-impending-ice-age/
and, ‘Earth on the Brink of an Ice Age’
http://english.pravda.ru/science/earth/106922-0/
Smokey,
What part of “why is Antarctic sea ice increasing? There are several contributing factors. One is the drop in ozone levels over Antarctica. The hole in the ozone layer above the South Pole has caused cooling in the stratosphere (Gillet 2003). This strengthens the cyclonic winds that circle the Antarctic continent (Thompson 2002). The wind pushes sea ice around, creating areas of open water known as polynyas. More polynyas lead to increased sea ice production (Turner 2009).
Another contributor is changes in ocean circulation. The Southern Ocean consists of a layer of cold water near the surface and a layer of warmer water below. Water from the warmer layer rises up to the surface, melting sea ice. However, as air temperatures warm, the amount of rain and snowfall also increases. This freshens the surface waters, leading to a surface layer less dense than the saltier, warmer water below. The layers become more stratified and mix less. Less heat is transported upwards from the deeper, warmer layer. Hence less sea ice is melted (Zhang 2007).”
did you not understand? Because if you like I can explain these concepts to you so that maybe it is easier to understand.
Also, for the record, Antarctica is not gaining ice in general. It is losing land ice extensively (Chen et al. 2009, Velicogna… Rignot… Cazenave… Allison et al. ) and gaining sea-ice in regions away from the west antarctic ice sheet.
For future discussions of glaciological events, be more concise and be prepared to read the core literature.
Finally, i’m not a big RC reader. Too much climategate defensiveness these days.
Steve,
I always enjoy your articles. Thank you.
With all the points/counterpoints made about thickness, extent, minimums, averages, and means, fortunately there is one thing we call all agree on: No matter what happens in the arctic this September, it won’t have anything to do with CO2. We could just as accurately look to the outcome of the World Cup as a driver of sea ice extent. 🙂
And I forgot to mention solar parameters:
“A comment about the seasonal cycle of solar radiation
The following description of the seasonal cycle of solar radiation based on gridded global radiation fields has been drawn from the data section of the Arctic Climatology Project Arctic Meteorology and Climate Atlas.
The field of global radiation for March shows a primarily zonal pattern, that is, one in which radiation decreases with latitude. This occurs because in March, the amount of solar radiation at the top of the atmosphere decreases sharply with increasing latitude. From April through August, latitudinal variations in solar radiation at the top of the atmosphere are less pronounced, so that cloud cover plays a strong role in determining the flux reaching the surface. Consequently, radiation patterns from April through August are very asymmetric. Fluxes are lowest over the Atlantic sector, where cloud cover is greatest. Fluxes peak over central Greenland from May through August. In large part, this illustrates the tendency for the high central portions of the ice sheet to be above the bulk of cloud cover. The highest fluxes are found in June because radiation at the top of the atmosphere peaks in June. Note for June the rather high fluxes over the central Arctic Ocean. This is largely explained in that cloud cover over this region is comparatively limited. From July onwards, radiation fluxes decline. September shows a zonal pattern, which as with March, arises from the strong latitudinal variation in solar flux at the top of the atmosphere for this month.”
http://nsidc.org/arcticmet/factors/radiation.html
Phil. says:
June 15, 2010 at 7:09 am [ … ]
…
You took the wrong bait, Phil. Check out Robert’s 4:44 am post, which I had responded to.
This is what the mountains above the National Snow and Ice Data Center look like this morning, covered with lots of fresh snow. View from the north.
Oslo,
Before you criticize the work of Canada’s Research Chair in Arctic System Science perhaps you should learn a bit more about him and his work
http://web.mac.com/barber1818/D.G.Barber/Welcome.html
If you think that he doesn’t know what he’s talking about then I believe you should read some of his publications and research work and then you will become more acquainted with non-blogosphere science and will actually learn to appreciate the mans work. I don’t think even Goddard or Watts would be naive enough to criticize this man’s knowledge on arctic system science. There is not a person on this forum and barely any in the world who have this kind of knowledge so give him a little respect. When an expert speaks, listen.
Of all the comments I’ve read to this, this one made me chuckle the most (so far):
“No matter what happens in the arctic this September, it won’t have anything to do with CO2..”
___________
By that, I assume you meant the excess CO2 that may have been put in the atmosphere by human activties over the past few hundred years…for certainly, CO2 plays a big role in providing a nice warm planet, and without it, the ice in the Arctic would be covering the whole planet in very short order. So yes, CO2 has very much to do with what goes on in the Arctic, both this September, and every single day.