By Steven Goddard
The topic this week is verification of data sources. NSIDC reports :
At the end of the month, extent fell near the level recorded in 2006, the lowest in the satellite record for the end of May
That sounds bad! Let’s see how 2010 compares with ten, twenty and thirty years ago :

Ice looks healthier than 10 years ago

Ice looks healthier than 20 years ago

Ice looks healthier than 30 years ago
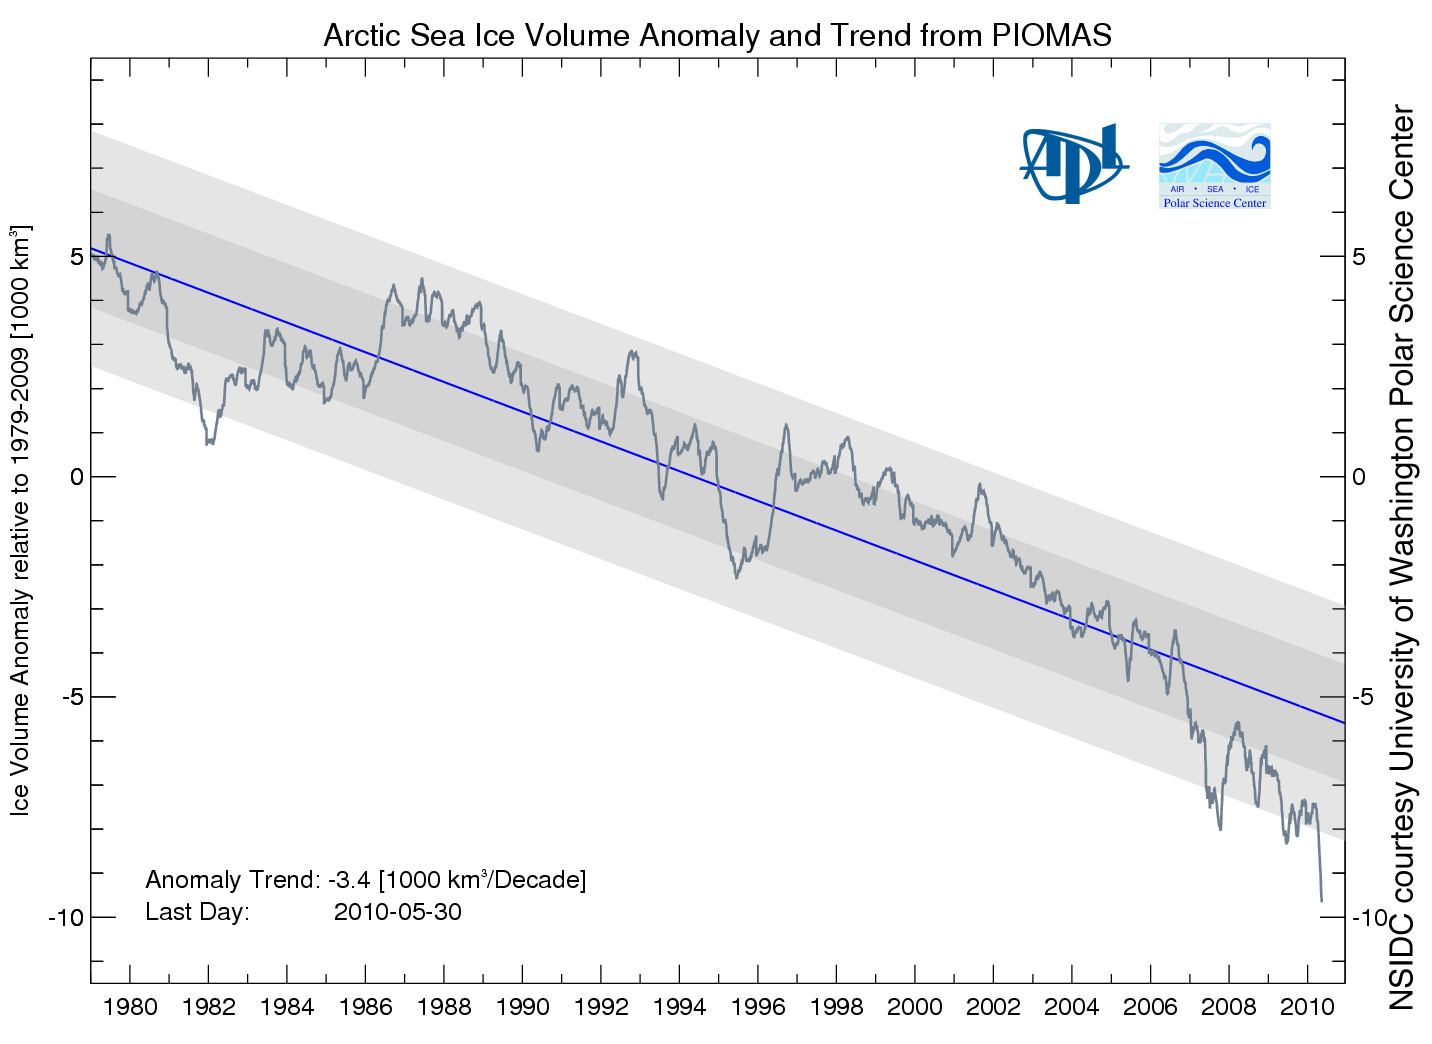
Then NSIDC discussed my favorite graph from PIOMAS, showing a record low anomaly of Arctic ice volume.

PIOMAS shows an anomaly nearly 50% greater than 2008. If that is correct, then surely we will have a record minimum this summer. However, the PIOMAS data seems inconsistent with PIPS2 data, which shows thicker ice covering a much larger area in 2010. My guess is that PIOMAS is looking at only a small region of the Arctic interior.
Next data source to look at are the Arctic Ice Concentration maps. UIUC has archived lower resolution maps since the start of the satellite record, such as the one below for June 11, 2010.

Their newer maps appear to show a lot more detail.
")
Note that the newer map shows a lot of low concentration ice in the Beaufort Sea (green, yellow, light pink.) Let’s see how that compares with a current satellite photo.

I must be missing something, because I don’t see much of that low concentration (green) ice in the satellite photo. The two videos below compare satellite vs new and old concentration maps. New comparison first :
The old concentration maps correlate much more closely with the satellite photo.
You can also see in the video below how erratic the bands of yellow and green are in the newer maps. They appear one day and disappear the next.
In the low colour version of the video, it appears that they may be having trouble differentiating between cloud cover and low concentration ice. We see large areas of open water switching to saturated ice overnight, and vice-versa.
It appears that the precision of the newer maps is much greater than their accuracy. Better to use a low precision map which is matched correctly with its accuracy.
Moving on, Barrow Sea Ice is starting to show first signs of thinning. By June 16, 2007 the ice had already broken up.
.
http://seaice.alaska.edu/gi/observatories/barrow_sealevel/brw2010/BRW_MBS10_overview_complete.png
Temperatures in the Arctic have continued below normal and below freezing for the last few weeks.
")
http://ocean.dmi.dk/arctic/meant80n.uk.php
NCEP is forecasting below freezing temperatures for much of the Arctic Basin during the next week.

This week, the sun reaches its highest point in the sky. Next week it starts its decline towards winter.
Now, the really interesting stuff. Arctic Basin sea ice volume (calculated from PIPS maps) remains close to the 2006 track, and well above the last three years

Area is slightly below 2006 and 2009.

Thickness is nearly identical to 2006 and 2007.

Conclusion : 2010 minimum extent is on track to come in just below 2006. With the cold temperatures the Arctic is experiencing, the likelihood of a big melt is diminishing.
NSIDC shows extent lower than 2007. The modified NSIDC map below shows where they believe the gaps are (in red.)

On the surface, this appears to disagree with my measurement above that Arctic Basin ice area is greater than 2007. The difference is that I am only considering regions that have perennial ice – i.e my PIPS calculations assume that there is no summer ice in Hudson Bay or the Barents Sea, and that they are a “don’t care” for estimating minimum extent. You can see in my PIPS ROI (Region of Interest) maps for June 14 below, that there is excellent agreement between PIPS and NSIDC. 2007 had less ice in the Chukchi and Laptev Sea, and more in the Beaufort Sea.

PIPS June 14, 2010

PIPS June 14, 2007
The modified NSIDC image below shows ice loss since June 3.

The modified NSIDC image below shows ice loss since early April.

And finally, the modified NSIDC image below shows regions which have below normal ice extent.

My analysis indicates the highest late summer extent since 2006. In discussing, please remember that the regions in red above normally have no ice in September. They don’t figure in to the summer minimum.
As I said in a comment upthread, the first bunch of graphs do not assess all the sea ice.
That’s in bold from the link to the first graph. PIOMAS state that their assessment is “pan-Arctic”, and of “total Ice volume”
Their list of data sets cover the Arctic well beyond ‘a relatively small area close to northern Greenland’, and “PIOMAS has been extensively validated through comparisons with observations from US-Navy submarines, moorings, and satellites.”
Have you contacted PIOMAS to verify your speculation?
Pls check for my post in the spam filter. I think it doesn’t like the PIOMAS links. Thank you.
Reply: Please do not waste time with requests such as this. The spam filter is checked regularly. ~ctm
Hypnos says:
June 15, 2010 at 10:51 am
“It would help the skeptic cause not to constantly repeated widely confuted factless claims that are little more than urban legends. It makes skepticism sound like 9/11 conspiracism.”
Perhaps this was my point… the general public is inundated with ‘scientific’ views, and their understanding of what they read or hear will be heavily influenced by those who promote their ‘science’ through MSM. And who in the 70’s would not believe a documentary hosted by Mr. Spock? After all, he had the backing of ‘real science’! Do any modern examples come to mind?
“BillD says:
June 15, 2010 at 9:14 am
Oslo:
My understanding is that his [Barber’s] ship was in the actic for several months and that he has conducted similar criuses over the last thirty years. He was showing data and photos of conditions that he and others have not reported in the past. I assume that the peer reviewed journal articles will be more rigorous in documenting change, than this plenary lecture, aimed at showing something new.”
The arctic is mighty big BillD. Where did Mr. Barber go with his little boat that was supposed to only be able to crack 2 meters of ice but instead cracked 2 meters? Did he go all over the place? Did he sail the exact same route on the same days with the same boat all those times he has supposedly been in the arctic over the years? Did he go in the 1880s too? Or in 1950? or 1960? is his observations really abnormal?
Mr. Barber immediately comes over as an alarmist trawling for new grants. His methods and the way he draws conclusions from more or less anecdotal “evidence” seems a tad unscientific too me.
Hypnos says: June 15, 2010 at 2:30 pm
“If you want to counter it, you need to find a majority of climate scientists in the ’70s (the period given by Skeptical Science is 1965-1978) claiming an ice age was upcoming. One will not do. Two won’t either. It’s that simple.”
How about a “few dozen experts”? Does that still count a majority consensus?
barry
If PIOMAS is correct, we certainly should expect to see a huge meltdown this summer.
Think about it. Ice volume is at a record low. Ice extent is at a record low. And even the multi-year ice is thoroughly rotten. Record temperatures in the Beaufort Sea. Warmest May on record for planet earth. Warmest year on record for planet earth. El Nino. Polar Bears drowning. Penguins drowning. Penguins drinking Coke with Polar Bears. How bad can it get??????
I can’t imagine why anyone who trusts the experts, wouldn’t go out and bet a lot of money on a record minimum. Seems like a done deal, based on the wealth of informative comments coming from the leading experts.
“And Brutus is an honorable man”
Mark Anthony
Layne Blanchard says:
June 15, 2010 at 10:03 am
With all the points/counterpoints made about thickness, extent, minimums, averages, and means, fortunately there is one thing we call all agree on: No matter what happens in the arctic this September, it won’t have anything to do with CO2. We could just as accurately look to the outcome of the World Cup as a driver of sea ice extent. 🙂
The Ice Ages were caused by Milankovitch cycles – that was the climate driver, for that time period. (In fact, they are still operating, but on very long time scales, overshadowed recently by the CO2 climate forcing.):
http://en.wikipedia.org/wiki/Milankovitch_cycles
As the Earth’s climate descended into an Ice Age, or climbed out of one, each single summer still had variable weather – but the overall trend was forced by the climate driver. Who cares what the snowfall in “Sweden” was for one particular year as the ice sheets formed ?
Same thing with the vanishing Arctic summer sea ice:
http://nsidc.org/images/arcticseaicenews/20091005_Figure3.png
The climate driver is known (CO2 buildup), and increasing. The details are “weather noise”. Who cares if the Arctic is ice free in summer 2018, or 2022, or 2028 ?
You don’t have to know the exact day, month and year Kobe Bryant retires to predict it will be before he turns 50.
Paul McCulloch,
Piers Corbyn sees general cooling coming too over the next ~30 years and staying cooler than now for ~100 years.
Paul McCulloch,
Henrik Svensmark says global warming is over:
“enjoy global warming while it lasts……In fact global warming has stopped and a cooling is beginning. No climate model has predicted a cooling of the Earth – quite the contrary. And this means that the projections of future climate are unreliable,”
http://wattsupwiththat.com/2009/09/10/svensmark-global-warming-stopped-and-a-cooling-is-beginning-enjoy-global-warming-while-it-lasts/
“Freezing”
If you take the Surface temp of Ice, or the Sea Surface temp :
It is ALWAYS freezing.
If we needed it to be above Freezing for there to be melting, Melting would NEVER HAPPEN.
You have to look at the amount it is ABOVE AVERAGE to get an Idea, and until the last week, it has been FAR above average virtually continuously
see: uah Arctic Ocean air temp
(last 5 months’ anomaly: + 3.2 December, 1.6, 2.92, 2.53, MAY = +2.68 degrees C.) http://vortex.nsstc.uah.edu/data/msu/t2lt/uahncdc.lt
This is a few 1000 feet up, but it gives an idea.
As to why melting off is a problem
1. It dries out the Plains States (& I mean a sand-dune DESERT)
2. IF and ONLY IF, it happens ALL IN 1 YEAR — with a HUGE El Nino, RECORD TEMPS, etc. and yet a high Ice extent to start with, THEN we might get Ocean Current Shutdown
= 300 mph Winds
= ALL structures above ground Destroyed
= We all DIE.
.. THIS year offers such a chance – – which is why I am worried.
Oh, & Milankovich cannot be the Ice Age Cause — it is a 108,000 year cycle — wrong: Ice ages have a 101,000..
Many favor a Jupiter interraction but Interplanetary dust was found to be only 4% less when in the plane of the Orbit (PS, yet I remember a “Zap” of Shoemaker-Levy — frankly, THAT explains the Sudden Ice AAge ends to me).
stevengoddard says:
June 15, 2010 at 4:38 pm
If PIOMAS is correct, we certainly should expect to see a huge meltdown this summer….. Think about it. Ice volume is at a record low. Ice extent is at a record low. And even the multi-year ice is thoroughly rotten. Record temperatures in the Beaufort Sea. Warmest May on record for planet earth. Warmest year on record for planet earth….. I can’t imagine why anyone who trusts the experts, wouldn’t go out and bet a lot of money on a record minimum.
They won’t put their money where their mouth is.
He also probably had the advantage of satellite-based pictures of the ice ahead of him.
The latest odds on this year being icier than last are 43% at https://www.intrade.com
Amino Acids in Meteorites says:
June 15, 2010 at 5:54 pm
Sounds like a great opportunity for the Science Doubters.
Bet early, bet often.
I think it would be great if a few knowledgeable WUWT participants like Pamela and Lucy were given administrators privileges and allowed to “mine” the threads here for the best stuff, including portions of comments, edit them (inside brackets), and fashion them into a loose-jointed summary of the points made here.
[Wholeheartedly agree. Not that it means anything. ~dbs]
Only Anu would refer to honest skeptics as “science doubters.”
He’s having fun trolling for RealClimate.
Anu says:
June 15, 2010 at 7:43 pm
You can lead a horse to water, but you can’t make him drink.
Record contraction in the Arctic, opposite phenomenon + in the Antarctic.
Never heard of global climactic hopscotch?
I highly reccomend it. Been happening for over 2 years now.
It’s not a time to goad others to gamble, it’s a time to prepare.
PS: Here’s the link to the thread on Lucia’s site where one can “bet” in monopoly money (“quatloos”) on Arctic ice extent. I bet 3 quatloos on 5.1^6 km^2, because this would be annoying to both sides. It would fail to continue the recovery (being a bit less icy than 2009), but it would also fail to meaningfully continue the decline. It would go mostly sideways.
http://rankexploits.com/musings/2010/sea-ice-weekly-average-summer-minimum-longish-range-forecast/
Well, you made my day — thanks!
When I was studying climatology in the early 1970s I recall no talk of warming; the cooling trends of the previous 3 decades had convinced many in the literature, and my profs, that another ice age was on its way, and it was mostly our fault. Aerosols and particulates from our industrial activities were to blame. Dr. Schneider went so far as to explain that CO2 could never overcome the effect of all that increased high atmosphere reflectivity.
And somehow our erstwhile commenters above leapt from Amundsen to the 2000s, entirely ignoring the RCMP motorized schooner St Roch, which went West to East in 1940-41 then East to West in three months over summer of 1944, the first vessel to do so. The St Roch is on display at the Vancouver Maritime Museum.
Smokey says:
June 15, 2010 at 7:49 pm
Only Anu would refer to honest skeptics as “science doubters.”
I have a special category for you, Smokey.
It rhymes with “appropriate”.
I have a special category for you too, Anu.
It’s just missing a letter.
rbateman says:
June 15, 2010 at 8:10 pm
You can lead a horse to water, but you can’t make him drink.
OK then.
Record contraction in the Arctic, opposite phenomenon + in the Antarctic.
Never heard of global climactic hopscotch?
Never.
There’s a reason people are argumentatively interested in “Arctic Sea Ice News” and Antarctica won’t be on their radar for another 60 years:
http://nsidc.org/monthlyhighlights/august2009.html
http://earthobservatory.nasa.gov/IOTD/view.php?id=42456&src=eoa-iotd
The Arctic meltdown is the “canary in the coal mine” – since you like animal sayings.
It doesn’t matter if 99 out of 100 clueless people you know don’t care about the Arctic summer ice disappearing – once it does, or close to it, the people that make the decisions that affect the world will be moving on to phase 2 – what to do about Global Warming.
I’ll miss these blogs when they’re gone.
Smokey says:
June 15, 2010 at 9:05 pm
I have a special category for you too, Anu.
It’s just missing a letter.
knowledeable ?
intellignt ?
cnning ?
Don’t give up so easily – here, try this:
http://mw2.merriam-webster.com/
Once you learn to spell, all those sciencey papers will be easier for you to read.
Who knows, maybe one day when you grow up, you’ll make an informed citizen…
Anu
In Hawaii, the leaders met regularly to decide how to stop those awful volcanic eruptions.
They recognized that a sacrifice had to be made, and threw thousands people into the volcano. Far fewer deaths than the number which will be killed by similarly useless carbon taxes.
Steven,
With all of the crap and vitriol you are receiving here, you struck a vein that must have been deeply revered as part of believer’s deeply held beliefs.
Robert says:
June 15, 2010 at 5:38 am
On May 19, 2007, a French sailor, Sébastien Roubinet, and one other crew member left Anchorage, Alaska, in Babouche, a 7.5 m (25 ft) ice catamaran. The goal was to navigate west to east through the Northwest Passage by sail only. Following a journey of more than 7,200 km (4,474 mi), Roubinet reached Greenland on September 9, 2007, thereby completing the first Northwest Passage voyage made without engine in one season.
—–
On the point of the Catamaran I would have to believe, as previously posted, that this vessel could manage the ice without water, and so, should not be considered in this discussion.
Of more relevance would be the open passages of the 1940’s and the 1900’s when wooden vessels made the NW passage. So to Robert, are you afraid to ask about the natural variability of arctic ice?