Guest post by Steven Goddard
In his recent article, NSIDC’s Dr. Meier answered Question #9 “Are the models capable of projecting climate changes for 100 years?” with a coin flipping example.
1. You are given the opportunity to bet on a coin flip. Heads you win a million dollars. Tails you die. You are assured that it is a completely fair and unbiased coin. Would you take the bet? I certainly wouldn’t, as much as it’d be nice to have a million dollars.2. You are given the opportunity to bet on 10000 coin flips. If heads comes up between 4000 and 6000 times, you win a million dollars. If heads comes up less than 4000 or more than 6000 times, you die. Again, you are assured that the coin is completely fair and unbiased. Would you take this bet? I think I would.
Dr. Meier is correct that his coin flip bet is safe. I ran 100,000 iterations of 10,000 simulated random coin flips, which created the frequency distribution seen below.

The chances of getting less than 4,000 or greater than 6,000 heads are essentially zero. However, this is not an appropriate analogy for GCMs. The coin flip analogy assumes that each iteration is independent of all others, which is not the case with climate.
[Note: Originally I used Microsoft’s random number generator, which isn’t the best, as you can see below. The above plot which I added within an hour after the first post was made uses the gnu rand() function which generates a much better looking Gaussian.]

Climate feedback is at the core of Hansen’s catastrophic global warming argument. Climate feedback is based on the idea that today’s weather is affected by yesterday’s weather, and this year’s climate is dependent on last year. For example, climate models (incorrectly) forecast that Arctic ice would decrease between 2007 and 2010. This would have caused a loss of albedo and led to more absorption of incoming short wave radiation – a critical calculation. Thus climate model runs in 2007 also incorrectly forecast the radiative energy balance in 2010. And that error cascaded into future year calculations. Same argument can be made for cloud cover, snow cover, ocean temperatures, etc. Each year and each day affects the next. If 2010 calculations are wrong, then 2011 and 2100 calculations will also be incorrect.
Because of feedback, climate models are necessarily iterative. NCAR needs a $500 million supercomputer to do very long iterative runs decades into the future. It isn’t reasonable to claim both independence (randomness) and dependence (feedback.) Climate model errors compound through successive iterations, rather than correct. How could they correct?
Speaking of Arctic ice cover and albedo, the sun is starting to get high in the sky in the Arctic, and ice extent is essentially unchanged from 30 years ago. How does this affect climate calculations?

GCMs are similar to weather models, with added parameters for factors which may change over time – like atmospheric composition, changes in sea surface temperatures, changes in ice cover, etc. We know that weather models are very accurate for about three days, and then quickly break down due to chaos. There is little reason to believe that climate models will do any better through successive iterations. The claim is that the errors average out over time and produce a regionally correct forecast, even if incorrect for a specific location.
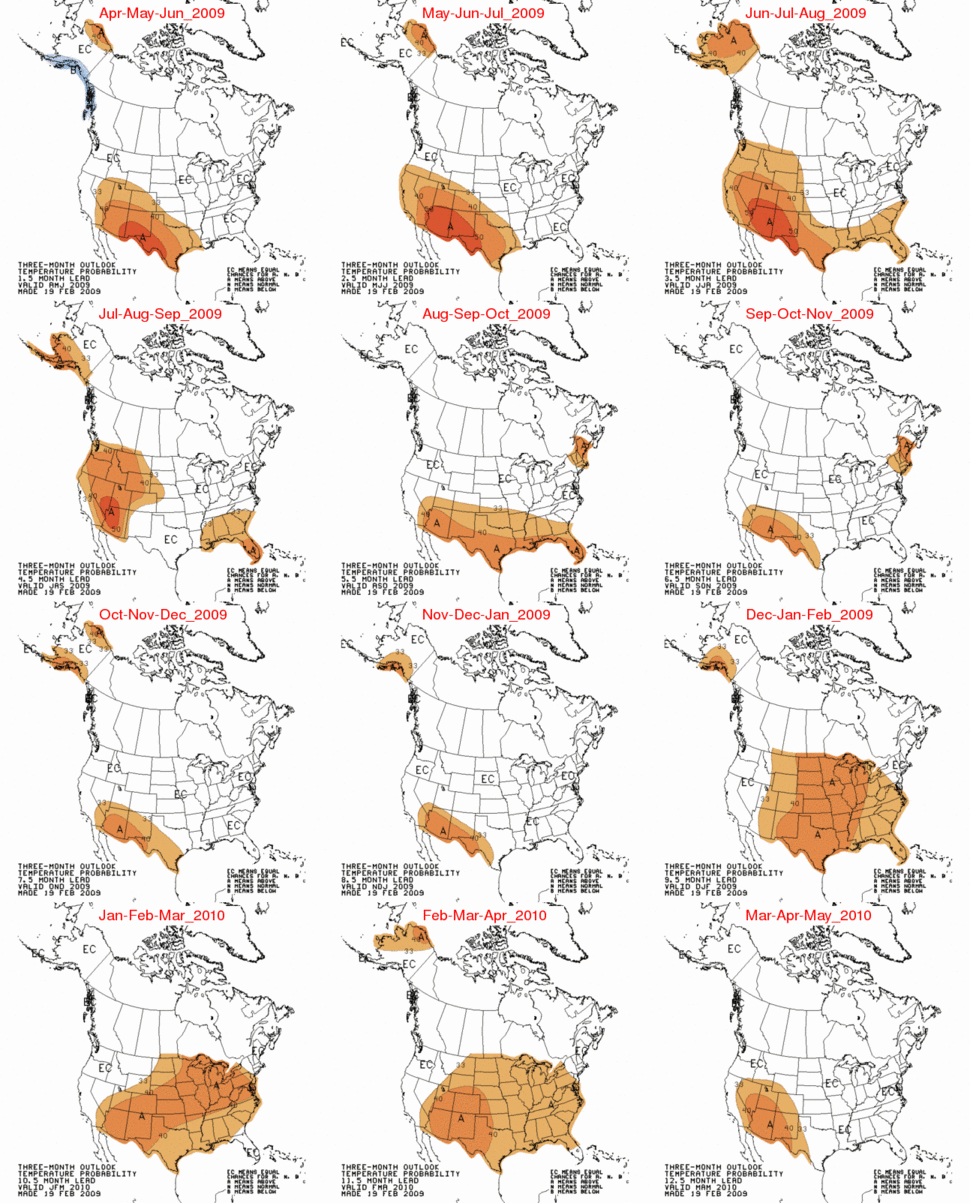
A good example of how inaccurate climate forecasts are, is shown in the two images below. NOAA’s Climate Prediction Center issued a long range forecast for the past winter in February, 2009. Brown and orange represents above normal temperatures, and as you can see they got most of the US backwards.

NOAA CPC’s long range forecast for winter 2009-2010

NOAA’s reported results for winter 2009-2010
The UK Met Office seasonal forecasts have also been notoriously poor, culminating in their forecast of a warm winter in 2009-2010.
The Met Office climate models forecast declining Antarctic sea ice, which is the opposite of what has been observed.


NSIDC’s observed increase in Antarctic sea ice
Conclusion : I don’t see much theoretical or empirical evidence that climate models produce meaningful information about the climate in 100 years.
However, Willis claims that such a projection is not possible because climate must be more complex than weather. How can a more complex situation be modeled more easily and accurately than a simpler situation? Let me answer that with a couple more questions:1. You are given the opportunity to bet on a coin flip. Heads you win a million dollars. Tails you die. You are assured that it is a completely fair and unbiased coin. Would you take the bet? I certainly wouldn’t, as much as it’d be nice to have a million dollars.2. You are given the opportunity to bet on 10000 coin flips. If heads comes up between 4000 and 6000 times, you win a million dollars. If heads comes up less than 4000 or more than 6000 times, you die. Again, you are assured that the coin is completely fair and unbiased. Would you take this bet? I think I would.
Discover more from Watts Up With That?
Subscribe to get the latest posts sent to your email.
If the met office used a coin flip to predict the weather for the last 10 years they would have been more right 4-6 times correct than 1 in 10. LOL
I get it. he is right!!!!!!!!!!!!!!!!
If it is easier to accurately model climate 100 years ahead than it is 10 years ahead – as apparently CAGWers believe – then is it not logically inescapable that it must be even easier to do it 1,000 years ahead and then an absolute doddle 1,000,000 years ahead. Although none of us will be around to actually check the veracity of the last claim 1,000,000 years from now, I hope that there isn’t anyone who would consider it to be anything but utterly absurd. So, if climate models are not accurate in the short term, nor in the extremely long term, why should anyone think that they improve somewhere in between?
Dirk H posted this:
“I think Wren won’t like this video:
especially from :51 to 1:22″
———–
I hope the guy on the video is not a pastor of a church (it at least appears he is associated with some form of church), as he makes a huge lie toward the end of the video, claiming that global temperatures have “not even gone up a fraction of a degree” since 1988. In fact they’ve gone up at least 3/10 of a degree, and the last I checked, that was a fraction of a degree. Do people believe this kind of nonsense just because it is put out by something with the name of “ministries” attached to it?
Paul M. Parks (19:59:40) :
The code does produce the same output on every invocation, and would even if I called the srand() function. Then it would just produce slightly different output depending on the seed it started with.
Each time rand() is called, the seed changes – one billion times (10,000 * 100,000) in this case.
Bob Koss (20:36:27) :
The Microsoft rand() function is not technically “defective” it just seems to have a short repeat cycle and possibly some other unwanted deterministic behaviour. If you look closely at the gnu output, it also shows some non-random patterns.
DirkH (19:55:29) :
“Wren (19:35:55) :
[…]
Anyway, how do adjustments relate to my point about short-term and long-term temperature trends?”
You were linking to an article with a chart that scatterplots CO2 concentration against temperature. This chart omits the time dimension. BUT, as OVER TIME upwards adjustments have been made in GISS, this conveniently helps to create a SPURIOUS correlation. So there, on a plate for you. Ein Schelm, der böses dabei denkt.
====
That’s not what I’m talking about regarding the short- and long terms. I will explain what I mean, but you will have to refer back to Steve’s chart
Steve’s chart shows GISS temperatures from 1890 to a current year with a regression line through the series to represent the trend over the entire 100+ years. Suppose back in 1890 you had projected this trend. As you can see from the chart, you would have been wrong about most of the year to year changes in temperature even though you got the long-term trend right.
So about 10 years or so into that 1890-2009 projection, skeptics would have been saying DickH your temperature projection sucks. How do you expect to forecast for a Century when you can’t even get next year right? But you would have had the last laugh if you and your critics weren’t dead by then.
There’s really no need to model this with a simulation, it’s readily computable if you don’t mind dealing with some really large number. One feature of the language Python is that when numbers start getting too big for the registers on the underlying machine, Python changes to extended precision.
To solve the puzzle, the easiest way to approach it is by computing the probability of getting heads 0-3999 times. That will also be the probability of getting heads 6001-10000 times. if that’s “p”, 2*p is the probability of dying, 1-2*p is the probability of winning.
I wrote a little Python program for that:
Does it work? Let’s try some simple cases:
If we flip a coin 5 times, the probability of getting 0, 1, 2 heads is 1/2,
as is the probability of 3, 4, or 5 heads:
$ python binodd.py 5 2
Odds of up to 2 out of 5 are 1:2
Getting no heads is one chance out of the 32 permutations:
$ python binodd.py 5 0
Odds of up to 0 out of 5 are 1:32
And getting up to 5 heads is an absolute certainty:
$ python binodd.py 5 5
Odds of up to 5 out of 5 are 1:1
Back to our test, the odds of getting 0 to 3999 heads out of 10000 flips:
$ python binodd.py 10000 3999
Odds of up to 3999 out of 10000 are 1:172542638129728354324544909641063289590541370504525129218969625689320496886879530815228312
The odds are dying are 1:086271…151. So yeah, I’d go for it.
Oh, one more check – the graph above (the believable one) shows 100 chances out of 100,000 flips to get at least 4900 (a bit less) heads, 4883 is the actual:
$ python binodd.py 10000 4883
Odds of up to 4883 out of 10000 are 1:101
I like to use 1 in a million as a threshhold for certain risky activities (like crossing the street), that would be 4762:
$ python binodd.py 10000 4755
Odds of up to 4755 out of 10000 are 1:1992858
(Remember there are equal odds at the other side of the bell curve, so one
in two million here, one in two million there is two is two million.)
Since it is my life, and we’re only talking a million bucks, I’d like a bigger buffer, one in a billion is:
$ python binodd.py 10000 4694
Odds of up to 4694 out of 10000 are 1:2030843522
DirkH (19:38:47) :
Why do you think that Los Alamos and Livermore have usually had the most powerful supercomputers on the planet?
It was pretty difficult to digitize the output of radioactive decay into input for a computer program in 1947.
I used to work with one of the authors of this paper.
https://docs.google.com/viewer?url=http://www.lanl.gov/history/hbombon/pdf/00285876.pdf
Wren (18:37:22) :
Looks like the graph you linked agrees with mine. I don’t see any indication of non-linearity which would lead me to believe climate sensitivity is greater than the extrapolation of that line. In fact, sensitivity should decrease somewhat at higher levels of CO2.
Wren (18:37:22) :
One more thing – crutemp vs. CO2 has a considerably lower slope than gistemp.
Smokey
Noelene (21:07:14) :
davidmhoffer
I enjoyed it too. Very funny. It captures how stupid some scientists are,or just venal, to back any science Jones, Briffa or Mann espouses>>
Glad you enjoyed it. Time and inspiration permitting, I might make it longer and throw some characertistics of certain skeptics into it as well. Willis insisting on figuring out how the thermostat works while complaining that his chip stack is logarithmic, Anthony claiming the cards must pass certain landing standards or be discarded. I even figure on Al Gore walking in just some oil tycoon starts handing out big grants, shouting aha! I knew it and then going silent when all the checks goto CRU scientists. Tomorrow perhaps.
In the meantime, If I made a couple of people laugh today, then I had a very good day.
Digsby (21:43:11) :
If it is easier to accurately model climate 100 years ahead than it is 10 years ahead – as apparently CAGWers believe – then is it not logically inescapable that it must be even easier to do it 1,000 years ahead and then an absolute doddle 1,000,000 years ahead. Although none of us will be around to actually check the veracity of the last claim 1,000,000 years from now, I hope that there isn’t anyone who would consider it to be anything but utterly absurd. So, if climate models are not accurate in the short term, nor in the extremely long term, why should anyone think that they improve somewhere in between?
===
The “do nothings” on CAGW have an implicit forecast of no change in global temperature or a forecast of no change that man could do anything about, depending on which “do-nothing” you ask. These forecasts are based on wishful thinking rather than climate models.
Bob Koss (20:36:27) :
You can download a free version of VC Express and try the code (posted above) for yourself. No need to speculate about it what Microsoft might or might not be doing.
Tom in Texas (14:58:44) :
If climate models are better predictors for a 100 year span than a 1 year span, does that mean they can get it exactly right for 3010?
====
Nope. Not exactly right for 3010 or any other year. But the model’s projection should be more accurate than a projection of no change.
RockyRoad (14:46:10) :
Don’t know about a ten degree drop in Colorado, but this past winter seemed to go on endlessly. Probably is not over yet.
Can a more complex situation be modeled more easily and accurately than a simpler situation?
I am still with Meier in saying, in the way he means, that YES, very often it it is easier. Consider crowd behaviour. When exiting a stadium during a fire alarm its harder to predict what an individual will do than it is to predict what the crowd will do. Likewise with windblown sand grains and sand dunes, with the brownian motion of a gas molecule and a gases tendency through its motion to fill a container,..etc.
And, likewise, it seems easier to predict the general frequency of storm fronts hitting Melbourne over a winter than it is of predicting whether one will hit on 1 July — and these days we can even predict the increase or decrease depending on Indian ocean dipole etc.
There is always greater complexity in the scale, or level, below the one in which we are working – this acutally makes the ‘simpler’ situation more complex. Mandelbrot is very good in discussing these scaling issues, and while they are somewhat arbitary, and there are emergent effects across them, this does not mean that the answer to our question is aways ‘NO’.
I would be the last to say that existing GCM can predict +100 years, but that is not the specific point that Meier is bringing into dispute with his example, and thus much of what Goddard says about feedback and model performance is irrelevant.
DirkH (19:49:01) :
“Wren (19:08:25) :
[…]
Looks… pretty bad for Hansen.
=====
Are you kidding? That evaluation is outdated. Actual temperatures are catching up to Hansen’s projections, already reaching his Scenario C projection and closing in on his Scenario B projection.”
Scenario C was assuming that CO2 emission rise stopped in 2000. This has not happened in reality so we can discard that one.
And in case you have missed it we just had an El Nino so we have a temperature spike. Like in 1998, this will be a short-lived effect. Or as we hobby climatologists say, a minor short-term issue.
=====
And the 2000-2009 decade was warmer than the 1990-1999 decade despite that 1998 El Nino, wasn’t it? Warmer still will be the 2010-2019 decade.
RockyRoad (11:52:08) :
The CPC projection for next winter is very similar to last year’s forecast.
http://www.cpc.ncep.noaa.gov/products/archives/long_lead/gifs/2010/201002temp.gif
So far, their April-June forecast from that same page is inverted.
Generating random numbers is at the crux of our work on stochastic boundary layer dispersion modeling. If anyone needs a good random number generator in their code check out Numerical Recipes: http://www.nrbook.com/a/bookcpdf.php
The online version is a bit dated now, but the code is the same.
There are excellent descriptions of the weaknesses and strengths of various methods.
Within the realms of probability.
The coin toss.
Gary Oldman and Tim Roth are excellent in this film. Really funny.
C. Shannon (13:39:20) : @Pwl, Wouldn’t it be: 50-(x/2), x, 50-(x/2)?
Yes, I also caught the mistake… I rewrote it on another post as this:
I flipped a coin once and it landed on it’s side standing up on a hard wood floor! So it’s not 50-50 heads or tail, it’s 50-x, x*2, 50-x odds where x*2 is the chance that the coin will and on it’s side and stay standing!
Glad to see someone checking for mistakes. If only the Real Climate Deniers would admit their lies, damned lies and statistical follies.
Digsby (21:43:11) :
“So, if climate models are not accurate in the short term, nor in the extremely long term, why should anyone think that they improve somewhere in between?”
Because that is our experience with a wide variety of systems. Short term behavior is typically very difficult to predict, due to limits on computational loads and data sampling requirements. Long term behavior is difficult to predict, because random events accumulate, generally increasing variability as a fractional power of time. But, in the mid-term, for which a valid model is available and whose signal to noise ratio is large compared to the short term variability, we can successfully project behavior. Example applications include navigation of air and naval vessels, and economic modeling.
The key to the above, you will note, is “for which a valid model is available”.
Way to miss the point.
It was an analogy to explain how a complex scenario can be easier to model than a simple one. It was illustrating that asserting the complexity of modelling single weather events compounds to make climate even more difficult and complex to predict is logically unsound. Saying that climate is not like coin flipping doesn’t exactly rebut his point. Taking short term weather events and saying that averaged predictions for long tem trends didn’t predict them doesn’t rebut his point either.
I can’t believe you bothered to include *2* plots of distribution curves from rand generation…
And comparing observed ice trends with projections and saying they don’t match is a bit silly when the projections *don’t really start to decline* in the antarctic for another five years. Perhaps you should overlay the two graphs, no?
Microsoft’s predictible “random number generator”…
http://www.theregister.co.uk/2007/11/13/windows_random_number_gen_flawed/
davidmhoffer (15:43:40). Thank you so much. It is good to laugh!
R. Gates (21:57:40) : Concerning your claim of a “lie.” The video was made in summer of 2008. According to UAH (and others), the summer of 2008 was no warmer than the summer of 1988. Yes, anomalies have risen since summer of 2008, but he was being taped in the summer of 2008 and not make predictions in 2010. I would agree that his approach is not the most scientific-pleasing method, but your charge is even more off base.