Guest post by Steven Goddard
In his recent article, NSIDC’s Dr. Meier answered Question #9 “Are the models capable of projecting climate changes for 100 years?” with a coin flipping example.
1. You are given the opportunity to bet on a coin flip. Heads you win a million dollars. Tails you die. You are assured that it is a completely fair and unbiased coin. Would you take the bet? I certainly wouldn’t, as much as it’d be nice to have a million dollars.2. You are given the opportunity to bet on 10000 coin flips. If heads comes up between 4000 and 6000 times, you win a million dollars. If heads comes up less than 4000 or more than 6000 times, you die. Again, you are assured that the coin is completely fair and unbiased. Would you take this bet? I think I would.
Dr. Meier is correct that his coin flip bet is safe. I ran 100,000 iterations of 10,000 simulated random coin flips, which created the frequency distribution seen below.

The chances of getting less than 4,000 or greater than 6,000 heads are essentially zero. However, this is not an appropriate analogy for GCMs. The coin flip analogy assumes that each iteration is independent of all others, which is not the case with climate.
[Note: Originally I used Microsoft’s random number generator, which isn’t the best, as you can see below. The above plot which I added within an hour after the first post was made uses the gnu rand() function which generates a much better looking Gaussian.]

Climate feedback is at the core of Hansen’s catastrophic global warming argument. Climate feedback is based on the idea that today’s weather is affected by yesterday’s weather, and this year’s climate is dependent on last year. For example, climate models (incorrectly) forecast that Arctic ice would decrease between 2007 and 2010. This would have caused a loss of albedo and led to more absorption of incoming short wave radiation – a critical calculation. Thus climate model runs in 2007 also incorrectly forecast the radiative energy balance in 2010. And that error cascaded into future year calculations. Same argument can be made for cloud cover, snow cover, ocean temperatures, etc. Each year and each day affects the next. If 2010 calculations are wrong, then 2011 and 2100 calculations will also be incorrect.
Because of feedback, climate models are necessarily iterative. NCAR needs a $500 million supercomputer to do very long iterative runs decades into the future. It isn’t reasonable to claim both independence (randomness) and dependence (feedback.) Climate model errors compound through successive iterations, rather than correct. How could they correct?
Speaking of Arctic ice cover and albedo, the sun is starting to get high in the sky in the Arctic, and ice extent is essentially unchanged from 30 years ago. How does this affect climate calculations?

GCMs are similar to weather models, with added parameters for factors which may change over time – like atmospheric composition, changes in sea surface temperatures, changes in ice cover, etc. We know that weather models are very accurate for about three days, and then quickly break down due to chaos. There is little reason to believe that climate models will do any better through successive iterations. The claim is that the errors average out over time and produce a regionally correct forecast, even if incorrect for a specific location.
A good example of how inaccurate climate forecasts are, is shown in the two images below. NOAA’s Climate Prediction Center issued a long range forecast for the past winter in February, 2009. Brown and orange represents above normal temperatures, and as you can see they got most of the US backwards.

NOAA CPC’s long range forecast for winter 2009-2010
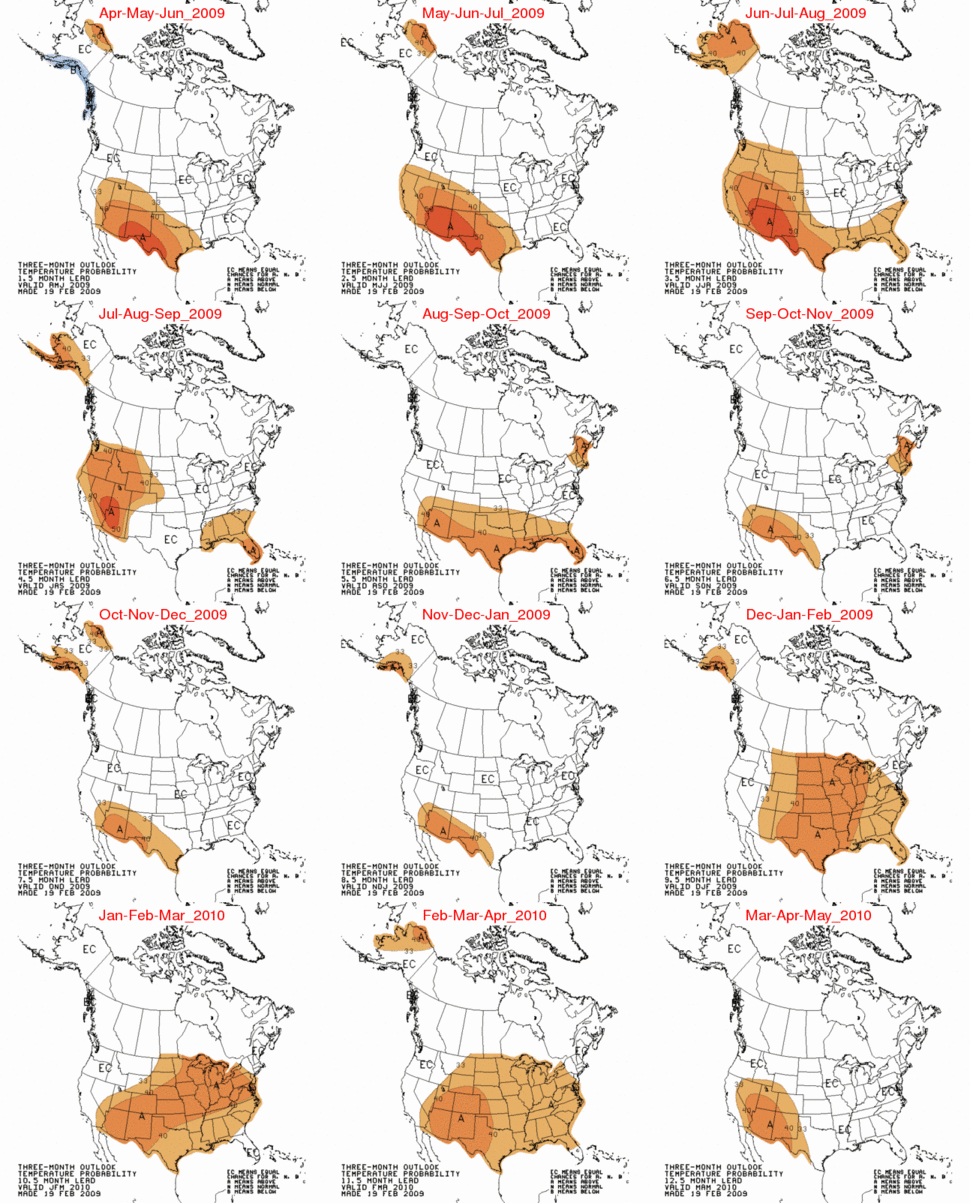

NOAA’s reported results for winter 2009-2010
The UK Met Office seasonal forecasts have also been notoriously poor, culminating in their forecast of a warm winter in 2009-2010.
The Met Office climate models forecast declining Antarctic sea ice, which is the opposite of what has been observed.


NSIDC’s observed increase in Antarctic sea ice
Conclusion : I don’t see much theoretical or empirical evidence that climate models produce meaningful information about the climate in 100 years.
However, Willis claims that such a projection is not possible because climate must be more complex than weather. How can a more complex situation be modeled more easily and accurately than a simpler situation? Let me answer that with a couple more questions:1. You are given the opportunity to bet on a coin flip. Heads you win a million dollars. Tails you die. You are assured that it is a completely fair and unbiased coin. Would you take the bet? I certainly wouldn’t, as much as it’d be nice to have a million dollars.2. You are given the opportunity to bet on 10000 coin flips. If heads comes up between 4000 and 6000 times, you win a million dollars. If heads comes up less than 4000 or more than 6000 times, you die. Again, you are assured that the coin is completely fair and unbiased. Would you take this bet? I think I would.
Re the difference between tossing a computer “coin” and a real coin, a real coin might have a bias, and its runs might centre on, for example, 5,394 rather than 5,000. But you’ll still get a Gaussian (unless it is so biased that you get almost no examples of one side or the other and you are pushed up against a “wall”, thus deforming the symmetric shape). So no, for a real and unknown coin, I would not take the bet.
Steve Goddard says:
Really? Here is a prediction for you: The climate here in Rochester will be at least 20 C colder next January than it is this July.
Much of your post rests on a false analogy between predicting things such as weather this summer will be colder or warmer than normal and predicting future climate in response to forcings. While predicting warmer or colder than average seasons may seem like a climate prediction, it is still basically an initial value problem. The prediction of the future climate 100 years from now in response to a significant change in radiative forcing is a boundary value problem and is much more analogous to predicting the seasonal cycle (as I talked about above).
Admittedly, with the seasonal cycle things are easier in the sense that we have better past data to go on…and can more quickly verify future predictions. Nonetheless, the fact that this can be successfully modeled basically undermines your notion that there is somehow an inherent unpredictability in climate that makes any such prediction impossible.
Kirk A (11:50:49) :
Your coin flip distribution is conspicuously symetrical…
Kirk, look up “Central Limit Theorem”. Or if you prefer, the binomial distribution (for large numbers of trials). In any experiment in which any given random variable, regardless of how it is distributed, is sampled a large number of times, the resulting sum is essentially normally distributed (i.e., the classical bell-shaped curve). As the number of trials goes to infinity the error in this approximation goes to zero. After 50 or so trials it is considered VERY good. After 10,000, the error is infinitesimal.
The only really silly thing about Mr. Goddard’s experiment (besides using a poor random number generator initially) is that it wastes CPU cycles performing 100,000 x 10,000 = 1,000,000,000 digital coin flips (bet that took a while!). He should have simply plotted the appropriate binomial variable to get the same curve.
DirkH (13:51:04) :
“Wren (13:27:02) :
[…]
Hansen’s projections made back in the 1980’s are looking better and better. No wonder he won an award for his contributions to climate modeling.”
Oh, that’s funny. Let’s look.
http://climateaudit.org/2008/01/16/thoughts-on-hansen-et-al-1988/
Looks… pretty bad for Hansen.
=====
Are you kidding? That evaluation is outdated. Actual temperatures are catching up to Hansen’s projections, already reaching his Scenario C projection and closing in on his Scenario B projection.
“Wren (18:37:22) :
[…]
http://moregrumbinescience.blogspot.com/2009/03/does-co2-correlate-with-temperature.html
Regarding your first chart, notice how the line through the GISS temperature historical series usually doesn’t touch the actual values. It does a poor job of describing short-term changes in temperature, but a good job of describing changes over 100+ years.”
The history of the various GISS temperature adjustments of course doesn’t harm this correlation as they have mostly been upwards…
“RockyRoad (13:35:24) :
[…]
The US becoming a completely socialist/marxist nation–a recent study showed that countries that did so (and this wasn’t a future projection, prediction, or prognostication; it was based on case studies) saw an immediate 40% drop in GDP.”
USA GDP/capita in 2006: 43468 USD
Let’s see. Switch to socialism: minus 40%. 60% of 43468 are 26080.8 USD.
USA GDP/capita in 1994: 26247 USD
So the introduction of socialism will warp you back to 1994.
Numbers are from
EarthTrends (http://earthtrends.wri.org) Searchable Database Results
=====
Is that a promise ?
Equating coin flips with climate calculations over long time periods is obviously false. Coin flips are truly random, each flip being a unique event independent of what went before and with no influence on the next flip. Climate predictions for next year are strongly influenced by this year, and will strongly influence the next year. If there is a small error, say 10%, the cumulative effect over time would make the results meaningless. Add to that the fact that interactions and amplitudes are to a large extent just guesses, and were established with the desire to show that CO2 is a problem. The idea that all the errors cancel each other out is wishful thinking.
With the large number of parameters in a climate model, some of which have large influence on temperatures over multi year periods, climate models should, I would think, go through some wild gyrations over various time periods. The year to year, decade to decade variations would likely exceed long term climate changes in a model that incorporates a significant number of forcings.
The forcings that caused the last ice age were clearly dominant, and we are due for another ice age. Do any of the models show an ice age? If they don’t, shouldn’t they.
Wren (19:08:25):
“Actual temperatures are catching up to Hansen’s projections, already reaching his Scenario C projection and closing in on his Scenario B projection.”
That’s like your stock market argument. With your market analogy, inflation was the unstated variable [and the 14 years of no real stock appreciation is about the same as Phil Jones’ 15 years of no real temperature increase].
With Hansen’s predictions, the natural temperature rebound from the LIA that is still going on is the unstated variable.
James Hansen used the Texas Sharpshooter Fallacy [shoot a hole in a barn door, then draw a bullseye around it] when he made his three separate predictions.
Now, his sidekicks pick the least wrong scenario as an example of how he was almost right. Of course, almost right = wrong.
DirkH (19:10:59) :
“Wren (18:37:22) :
[…]
http://moregrumbinescience.blogspot.com/2009/03/does-co2-correlate-with-temperature.html
Regarding your first chart, notice how the line through the GISS temperature historical series usually doesn’t touch the actual values. It does a poor job of describing short-term changes in temperature, but a good job of describing changes over 100+ years.”
The history of the various GISS temperature adjustments of course doesn’t harm this correlation as they have mostly been upwards…
====
Really? I wonder how they missed that last La Nina induced temperature spike that UAH and RSS recorded. Wouldn’t that have been reason for an upward adjustment?
Anyway, how do adjustments relate to my point about short-term and long-term temperature trends?
“Steve Goddard (16:06:53) :
[…]
People who need extremely good random number generators (like thermonuclear weapons designers) require huge supercomputers to generate the needed randomness.”
No, Steve, computer power doesn’t help you much here, but a simple method for perfect randomness is to get input from a physical process like radioactive decay, so let a Geiger Counter or some other random source (noise from Zener diodes is also good) influence your random number generator and you break out of any cyclicity.
If you need high quality randomness with exact reproducibility, record your physical process’s signal on a large harddisk and use the recording to influence the random number algorithm.
Of course you can also just record physical noise and use that as the random source – this is called a one-time pad.
The immanent cyclicity of even the simplest random number algorithms can be arbitrarily expanded by using longer internal words. For instance, using 8 bits of internal state will make your sequence repeat after at most 256 steps; 16 bits gives a potential maximum of 2^16 or 65536, 32 gives you about 4 billion, 64 gives you 4 billion squared…. Together with a little unpredictability from radioactive decay you’re as safe as you want from quick repetitions (just modify your internal state each time the Geiger Counter clicks, for instance by toggling a bit of the state.).
Of course, expanding the word size will slow down the random number generation but as you see, a doubling of the word size doubles the x in 2^x where 2^x defines the cycle length of the random sequence (in the absence of an extra physical input).
“Wren (19:22:19) :
[…]
So the introduction of socialism will warp you back to 1994.
Numbers are from
EarthTrends (http://earthtrends.wri.org) Searchable Database Results
=====
Is that a promise ?”
No, it’s a prediction. Just introduce socialism and verify it.
But be warned: AFTER the initial 40% reduction in GDP you will find out that your GDP will now shrink further. That’s another prediction. Venezuela is just testing this hypothesis.
Smokey (19:26:53) :
Wren (19:08:25):
“Actual temperatures are catching up to Hansen’s projections, already reaching his Scenario C projection and closing in on his Scenario B projection.”
That’s like your stock market argument. With your market analogy, inflation was the unstated variable [and the 14 years of no real stock appreciation is about the same as Phil Jones’ 15 years of no real temperature increase].
With Hansen’s predictions, the natural temperature rebound from the LIA that is still going on is the unstated variable.
James Hansen used the Texas Sharpshooter Fallacy [shoot a hole in a barn door, then draw a bullseye around it] when he made his three separate predictions.
Now, his sidekicks pick the least wrong scenario as an example of how he was almost right. Of course, almost right = wrong.
====
Well, you got me on that one. I will admit I haven’t given any though to using the CPI to take the rising cost of living out of average global temperature.
BTW, I am invested in a S&P 500 index fund that has lost a little over the past 10 years even without an adjustment for inflation. Fortunately, I don’t have a lot in it.
“Wren (19:08:25) :
[…]
Looks… pretty bad for Hansen.
=====
Are you kidding? That evaluation is outdated. Actual temperatures are catching up to Hansen’s projections, already reaching his Scenario C projection and closing in on his Scenario B projection.”
Scenario C was assuming that CO2 emission rise stopped in 2000. This has not happened in reality so we can discard that one.
And in case you have missed it we just had an El Nino so we have a temperature spike. Like in 1998, this will be a short-lived effect. Or as we hobby climatologists say, a minor short-term issue.
“Wren (19:35:55) :
[…]
Anyway, how do adjustments relate to my point about short-term and long-term temperature trends?”
You were linking to an article with a chart that scatterplots CO2 concentration against temperature. This chart omits the time dimension. BUT, as OVER TIME upwards adjustments have been made in GISS, this conveniently helps to create a SPURIOUS correlation. So there, on a plate for you. Ein Schelm, der böses dabei denkt.
@Steven Goddard: Your sample code in a comment above does not call the srand() function, so with C runtime libraries that use a pseudo-random generator the output will very likely be the same on every run. Seeding the random number generator with, for example, the return value of the time() function will generate a slightly more random output, though of course still nowhere near true randomness.
Wren (19:22:19) :
“Is that a promise ?”
So. That shows you’re arguing not from science, you’re arguing CAGW with a political goal in mind.
Just so we know you’re not being a hypocrite, let’s see you get by on 40% less income. You go first, OK? Show the proletariat how it’s done.
And donate your money to WUWT, so we can verify that you’re not just telling the rest of how we have to live our lives with 40% less.
Walk your talk.
I think Walt needs to study this for a better nderstanding of global climate:
http://www.21stcenturysciencetech.com/Articles%202005/ComingPresentIceAge.pdf
Excerpt:
We are now in an ice age and have been for about the
past 2 million years. Over the past 800,000 or so
years, the Earth’s climate has gone through eight distinct
cycles of roughly 100,000-year duration. These cycles are
driven by regular periodicities in the eccentricity, tilt, and precession
of the Earth’s orbit. In each of the past eight cycles, a
period of glacial buildup has ended with a melt, followed by a
roughly 10,000-year period—known as an interglacial—in
which relatively warm climates prevail over previously icecovered
northern latitudes.
30 years is only weather 😉
Steve,
One last comment and then I’ll bow out.
Is it likely that MS would put out two programs five years apart with the same defective commonly used function? I expect they would have been swamped with complaints when the first program was issued. That they would then not fix it seems to be quite a stretch considering my even older program handles it correctly.
Let’s ask Meier if he would put ALL his money in a new hedge fund run on exactly the same lines as Long-Term Capital Management, which is the exact parallel to climate models.
(If anybody has forgotten, LTCM looked great for four years, then went bust.)
DirkH (13:51:04) :
“Wren (13:27:02) :
Hansen’s projections made back in the 1980’s are looking better and better.
………………………………………………………………………………………………………………….
DirkH,
I think Wren won’t like this video:
especially from :51 to 1:22
davidmhoffer
I enjoyed it too. Very funny. It captures how stupid some scientists are,or just venal, to back any science Jones, Briffa or Mann espouses.
R. Craigen (19:00:56) :
Kirk A (11:50:49) :
“Your coin flip distribution is conspicuously symmetrical…”
Kirk, look up “Central Limit Theorem”.
It is simpler than that. The number of heads plus the number of tails must equal 10,000 in every run.
…..I’m reminded of a climate scientist one time who said, “My model is right. It’s the real world that’s wrong”.
Dave Legates, John Christy, and Sallie Baliunas give some thoughts on climate models:
The coin tossing is a red herring. Walt Meier said:”Now of course, weather and climate are different than tossing a coin.” Agreed, way different.
Walt Meier said: “Whereas coin flips are governed largely by statistical laws, weather and climate are mostly governed by physical laws.”
The coin flips are governed by physical laws. There aren’t any statistical laws. Probability is just a mathematical structure to replace vague concepts like “luck” and “chance”. He is right that often the large scale is easier than the minute scale because we can just deal with averages. Recall that Einstein was quite upset when he found determinism failed (quantum mechanics), so we can’t fault Walt too much for clinging to the belief that climate is simpler than weather because the weather averages out. Yet that belief has not been proven (nor has it been proven to be chaotic).
DirkH (19:38:47) :
“Steve Goddard (16:06:53) : […]
People who need extremely good random number generators
Several years ago I wrote a book on machine coding for IBM’s AS/400 machine. One of the chapters was about how to generate a ‘truly’ random number [without attaching new and special hardware]: http://www.leif.org/as400/mlp022.doc The details are of course machine specific, but the approach is not.