
A few days ago I wrote in State of the Sun for year end 2008: all’s quiet on the solar front – too quiet that “No new cycle 24 predictions have been issued by any solar group (that I am aware of ) in the last couple of months.” Coincidentally and shortly after that, NASA’s David Hathaway updated his solar prediction page here. He’s made a significant backtrack over previous predictions, and now for the first time he is claiming cycle 24 will be less than cycle 23, not greater.
Kudos to our WUWT resident solar physicist Leif Svalgaard for his foresight. He has been saying for many months that cycle 24 would be significantly reduced, and not greater than 23.
Here is Hathaway’s most familiar graphic, which has an active sun in the background. Perhaps it is time to update that background to something more reflective of the times…..oh wait, read on.
Click for a larger image
Here in this graphic, from Klimadebat.dk we can see how much has changed since Hathaway’s last prediction update in October 2008:
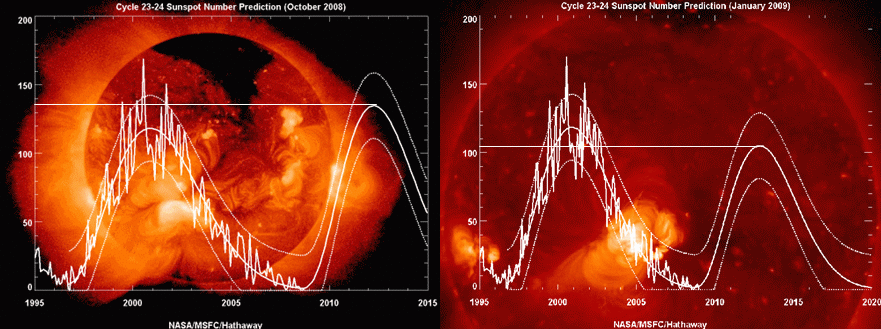
Click for a larger image
Note that Hathaway did indeed change background graphics from October to January. Its just not quite the smooth and nearly featureless ball we see today.
Courtesy of Mike Smith, here is the March 2006 prediction graphic:

Click for larger image
Hathaway’s predicted Cycle 24 maximun in March 2006: 145
Hathaway’s predicted Cycle 24 maximun in October 2008: 137
Hathaway’s predicted Cycle 24 maximun in January 2009: 104
I’d say that represents a sea change in thinking, but the question now is: How low will he go?
I was looking for a substantial quote from Hathaway in his prediction page, but it appears he is being quite conservative in his language, focusing mostly on methodology, not the prediction itself. I don’t blame him, he’s in a tough spot right now.
Meanwhile we’ve had an entertaining episode with the most recent Cycle 24 transient sunspot/sunspeck that appeared briefly yesterday then disappeared almost as fast as it appeared. See the area on the lower right of the sun:

In response to my query asking if he concurred with my assessment of it being an SC24 speck, (he did) Leif wrote to me: “Seems that it has received even a region number 11010. Somewhat ridiculous.”
Then about 12 hours later: “And SWPC has withdrawn the number. No numbered region after all.”
It will be interesting to see which organization counts this event, or not, in the month end tally. Up until this point, we had 25 consecutive spotless days. Now we have more, or not.
h/t to Frank Lansner for the Klimatdebat.dk graphic link and a bunch of other commenters who made note of the Hathaway page
Is it just me, or does the uptrend seem to be quite steep?
Reality may be on the low end of even the new lower estimate.
REPLY: I thought the same thing, that the uptrend may not be possible to achieve. So far he’s overshot everything about SC24, so it would not be surprising to see the trend prediction off the mark also. – Anthony
I looked on NOAA’s site and they are still officially counting it as a spot.
Honestly there are at least 3 other areas on the image that could count as a spot if they lower the standards to that level.
http://www.spaceweather.com/images2009/07jan09/jan7sunspot_2.jpg?PHPSESSID=640cbl8muottt2n17h1nu9g6e6
What is Bill Livingston’s measure of the magnetism of those last spots showing?
====================
Doesn’t four misses in a row say your science and models may be doggy?
For those interested,
Here are some links to the work of Dr Theodor Landscheidt on Solar and Climate cyclles:
Landscheidt papers
http://landscheidt.auditblogs.com/papers-by-dr-theodor-landscheidt
http://bourabai.narod.ru/landscheidt/swinging.htm
http://bourabai.narod.ru/landscheidt/cycles.htm
http://bourabai.narod.ru/landscheidt/cyclic.htm
http://bourabai.narod.ru/landscheidt/rotation.htm
http://bourabai.narod.ru/landscheidt/creative.htm
http://bourabai.narod.ru/landscheidt/predictable.htm
http://plasmaresources.com/ozwx/landscheidt/pdf/Mini-Crash_in_Tune_with_Cosmic_Rhythms_3_p_1989.pdf
http://bourabai.narod.ru/landscheidt/relationship.htm
http://bourabai.narod.ru/landscheidt/golden.htm
http://bourabai.narod.ru/landscheidt/solarwind.htm
http://www.john-daly.com/sun-enso/sun-enso.htm
http://www.john-daly.com/solar/temps.htm
http://www.john-daly.com/po.htm
http://www.john-daly.com/theodor/solarnao.htm
http://www.john-daly.com/theodor/pdotrend.htm
http://www.john-daly.com/sun-enso/revisit.htm
http://www.john-daly.com/solar/US-drought.htm
http://bourabai.narod.ru/landscheidt/new-e.htm
http://www.john-daly.com/theodor/DecadalEnso.htm
He is not correct in the first place, why would he be right in the last place?
Specs not counted here
http://www.swpc.noaa.gov/ftpdir/indices/DSD.txt
NOAA is currently listing 01/07/09 as a big fat “0” in the SS field. http://www.swpc.noaa.gov/ftpdir/indices/quar_DSD.txt
Also of interest is the flat-line of the 10.7cm radio flux:
69,70,70,69,69,69,69. A line that flat on a cardiac monitor would be a
call for resuscitation. All the “Flares” fields remain zeros, too. Is the
patient sleeping, or comatose?
SIDC Belgium continued the ALL QUIET alert begun on Jan. 02. six days
and counting on that, also.
Question–Does anyone know how long and when the longest ALL QUIET
on record was?
Thnx
Just cleaned my screen and lots of specks disappeared.
I e-mailed spaceweather.com webmaster yesterday. I told them I could not see the sunspot. I also told them they were propogating misleading information and creating animosity among those they serve and who rely on accurate science information.
The significance here is that the more of this kind of misleading data they post then the more difficult and time consuming it will be to correct public policy which is going to be needed to react to the sun’s activity and hence save lives.
The worst scenario arising from thier antics is that advances in genetic bioresearch in crop production will be delayed which could in the end help crop production in changing growing conditions.
Tim L (08:30:23) :
“He is not correct in the first place, why would he be right in the last place?”
What about: a perpetual trial and error?
TerryBixler,
Sorry, Didn’t mean to step on your toes. You got that one in on me
while I was composing.
Is NASA an State owned Corporation?… (Critica ad hominem? 🙂 )
The way I read Dr. Hathaway’s forecasts before he seemed to me to be basing his prediction of cycle 24 on solar magnetic properties of cycle 23. The gist of it was something like “historically, when the properties of a cycle have been X, then the strength of the following cycle has been Y”. You will also note that he has also been predicting an extremely weak cycle 25 based on cycle 23 indicators that seem to forecast activity two cycles hence (e.g. the magnetic “conveyor belt”). What has changed is the length of cycle 23. Dr. Hathaway had no way of predicting the length of cycle 23 and so now that the minimum has continued longer than previously predicted, he has a new indicator that apparently takes priority over the other criteria.
I believe from my reading that a cycle after a long cycle is generally weak and a cycle after a short cycle is generally strong. So now that cycle 23 has lasted this long, my guess is that he now has a hard indicator to go with to reliably predict a weaker cycle 24. He couldn’t do that before based on “hunch” or “suspicion” or what he “believed” would happen, he had to wait until he had some solid basis for changing the prediction which he apparently now has. That says two things. First, he doesn’t seem to be playing hunches and is waiting for solid data. Second, he and his colleagues do not appear to have a way of telling what is actually going on (as if anyone does) and must use what amounts to statistical past behavior in order to predict future behavior. Sort of like a technical chart watcher might do with the stock market.
In summary, it appears that his earlier forecasts were based on the information he had at the time. The current forecast is changed due to new information that takes time make itself apparent. It would seem that what has been learned is that cycle length might be an overriding indicator of the magnetic properties he was using previously.
Also note that as far as I know he still hasn’t changed his forecast that cycle 25 will be extremely weak based on certain properties of cycle 23.
I think the steep curve implies that the Sun somehow has an event memory and will attempt to play “catch up” so as to bring things back to “normal”. Such an assumption shows bias in the person making it overruling any understanding of the underlying physical dynamics involved.
The potential July/August minimum is dying on the vine. Meteorologists move over, there’s a new standard in futility for prognostication! Bet you thought this day would never come.
No not the Lions.
I’m just an outsider looking in, but it seems to me that we may be living in interesting times. A question though: What is the error margin of the peak of cycle 24 as predicted by Hathaway? Is it -squinting at graph- 2013 (+/-1.5years)?
I have the greatest confidence in De Jager’s prediction: 2014 @ur momisugly 65±17 . I saw him explaining his method of prediction during a climate conference last November in Amsterdam.
http://www.cdejager.com/sun-earth-publications/
kim (08:15:02) :
What is Bill Livingston’s measure of the magnetism of those last spots showing?
Just talking with him. No recent measurements because of no spots. He missed this one too.
Sunspotter (08:45:33) :
Question–Does anyone know how long and when the longest ALL QUIET on record was?
Some 400 days back in ~1810
and possibly years in the 1650-1700s
Repeatedly “adjusting” a “forecast” is not forecasting at all as the predictive value is nil. Looked at with a generous eye, the only glimmer of science left is Hathaway somewhat modifying his “hypothesis” in light of recalcitrant data.
This constant tweaking certainly suggests that the underlying model is fatally flawed. Just as is the case with, inter alia” the IPCC’s ” most recent forecasts for global temperatures, polar sea ice and sea level rise.
HAHAHAHA….too funny…no way the two could be related!
Claim: Low solar activity and Little Ice Age was correlation was merely ‘coincidence’
http://co2sceptics.com/news.php?id=2489
The ramp up to maximum is generally faster than the tail off to minimum.
oh noes!!!! another thing to worry about…
Astronauts threatened by cosmic rays as sun becomes less active
http://www.dailymail.co.uk/sciencetech/article-1108983/Astronauts-threatened-cosmic-rays-sun-active.html
I just wanted to observe that if Livingston and Penn are correct that 2015 will be the point at which visible spots cease to be (for a time) then any conventional curve cannot reach a very high amplitude before sinking to that zero point.
In fact, the only curve that would make sense to get the number to zero by that point would have an amplitude of far fewer than max SSN 50 for Solar Cycle 24.