Coal Creek, Colorado Coop Observing Station Cooling The Last Decade

reposted from ICECAP

By Dr. Richard Keen, University of Colorado

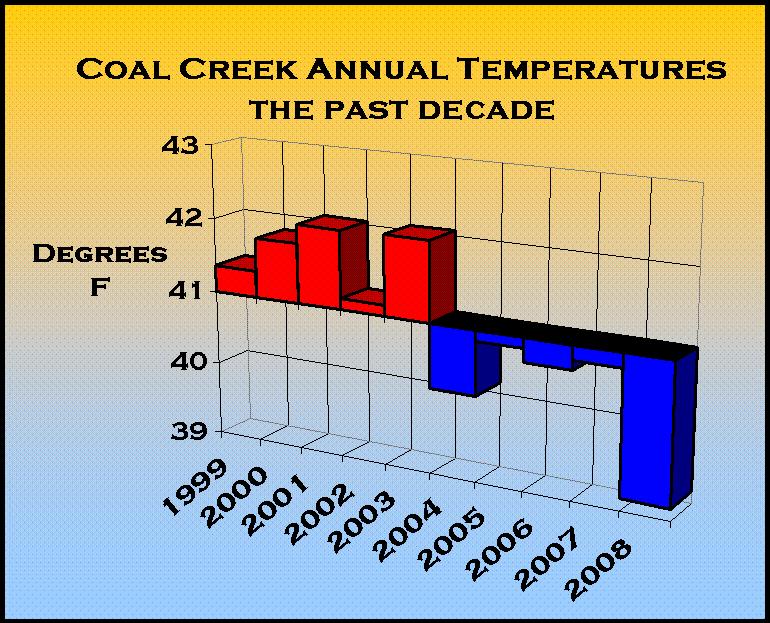
I’m the NOAA co-op observer for Coal Creek Canyon, Colorado, elevation 8950 feet, in the foothills NW of Denver.  Here is a graph of average temperatures for the past ten years.  2008 is by far the coldest year in the past decade, with an average of 39F.

image

See larger image here.

That’s full 3 degrees F colder than 2003.  Each of the past five years is colder than any of the previous five years.

This is only one station of the thousands in the NOAA co-op network, but I thought I’d show you the data before it’s adjusted and homogenized by the usual suspects.

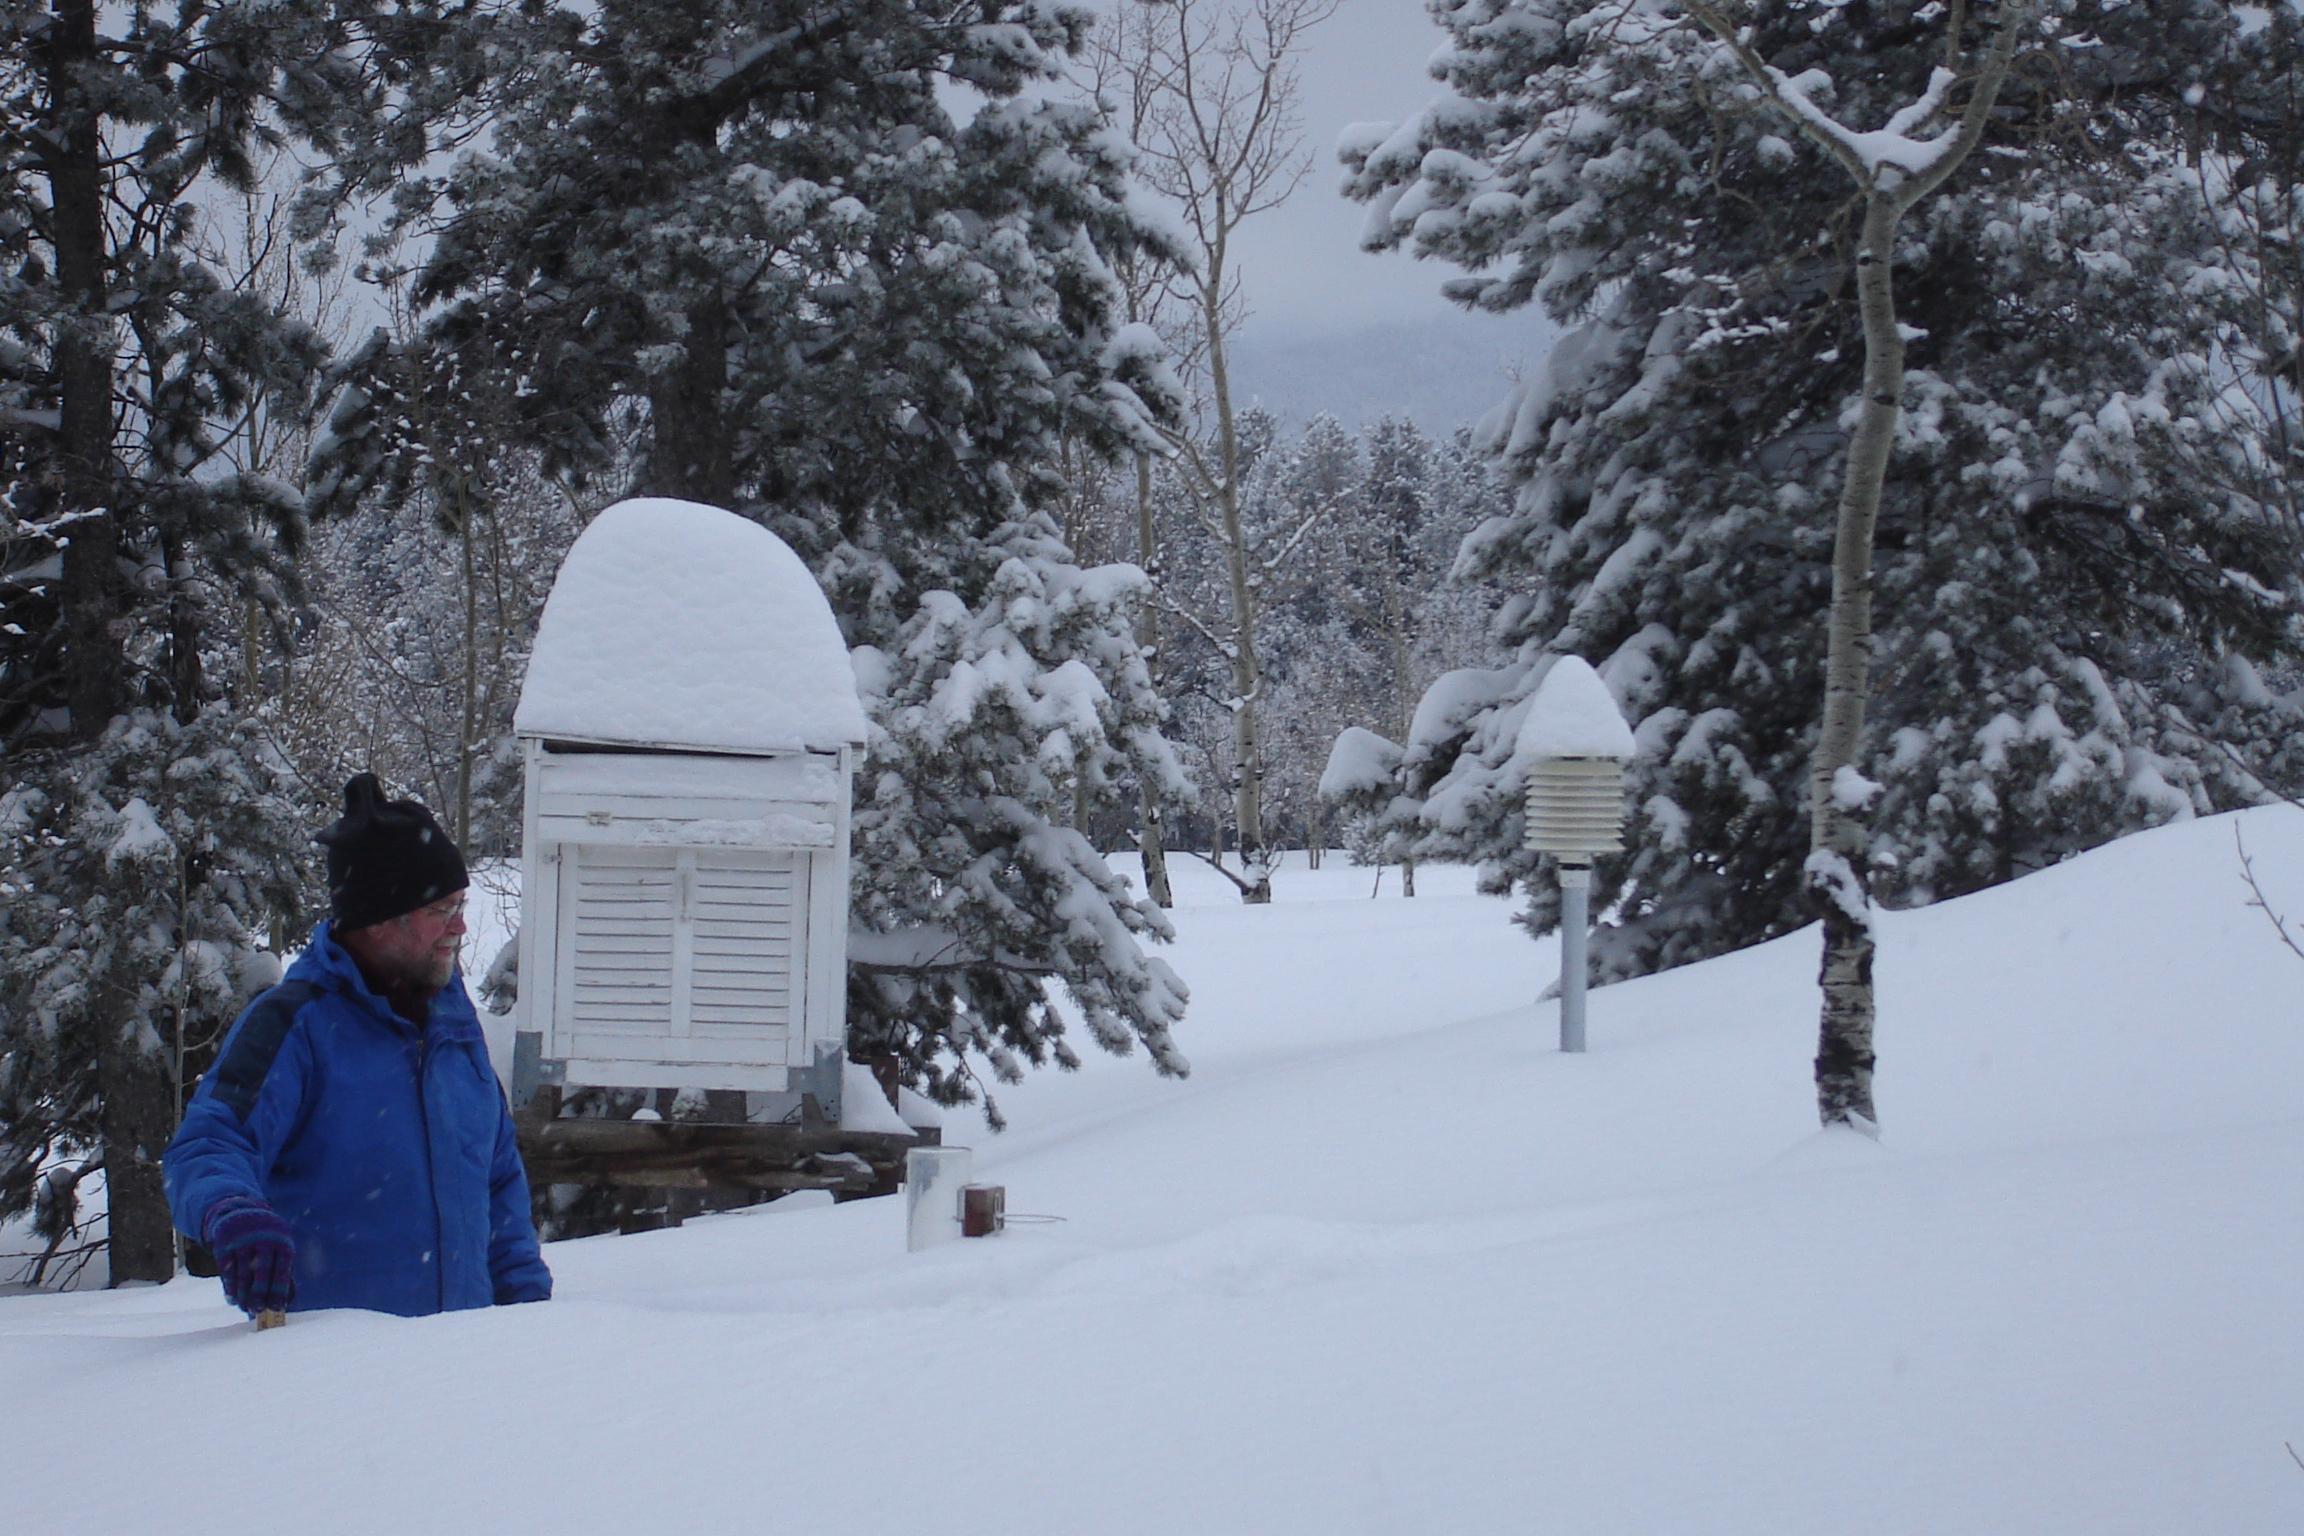
Here’s a photo of the station in January 2007, in the midst of a record round of snow storms in Colorado.

image

See larger photo here.

0 0 votes
Article Rating
163 Comments
Oldest
Newest Most Voted
Inline Feedbacks
View all comments
Jeff Alberts
January 7, 2009 7:56 pm

The only problem with this being posted by the observer of record is that the alarmists will accuse him of cooking the books before they’re cooked by others.

ak
January 7, 2009 8:02 pm

didn’t really think you couldn’t scrape up any less significant data than your previous post, but you managed to do it. good luck with the weblog awards. 🙂
REPLY: Insignificant in your view, which apparently is only global. We however don’t view individual or regional issues as insignificant as they make up the whole record, and individual examination of these stations is what we do. If you don’t like it, then please don’t dwell here simply to cast snark. – Anthony

Robert Bateman
January 7, 2009 8:06 pm

How very interesting. The temps start dropping on the descent into the mushy SC24 from the peak of SC23. As if the change occured then.
Just like the temps of the 1590’s in Europe got horridly colder for that decade, prior to the runup to the Maunder and the Little Ice Age.
The shoe fits.
The pattern repeats.

Graeme Rodaughan
January 7, 2009 8:13 pm

Would it be possible to get the post adjusted data for this site and compare?

Tim F
January 7, 2009 8:29 pm

This is a great article–many thanks to Dr. Keen. In the interest of forwarding citizen science could anyone post how the yearly average is calculated for a station. Is it simply the arithmetic mean of the daily average/365? How many readings are sufficient for a daily average?
Thanks

Sean Ogilvie
January 7, 2009 8:43 pm

Writing from Georgia, it looks positively balmy out there!
Question: Is it policy to remove the snow? I would think that it would make a difference.

Brooklyn Red Leg
January 7, 2009 8:49 pm

[sarcasm]Oh come on! Of course its showing its colder. They built it where there was SNOW! How can anyone expect an accurate reading of all this global warming when there is snow everywhere. Its OBVIOUS that the snow is masking all this warming and that the temperatures would be much higher if they weren’t.[/sarcasm]

jc
January 7, 2009 8:56 pm

Out of curiosity, isn’t snow on top of the instrument kind of bad for taking good temperature measurements?

Patrick Henry
January 7, 2009 9:12 pm

It is interesting that there are are several prominent organizations a few miles away in Boulder, who keep insisting that the climate is getting warmer. Apparently some people don’t get out of their computer models very often.
Seems to come with professional territory.
The Met Office said yesterday: “We may be going through probably the coldest spell since 1996, but it is probably a bigger medium-term problem that we are going to see some very hot summers
http://www.guardian.co.uk/uk/2009/jan/08/summer-aid

Pamela Gray
January 7, 2009 9:17 pm

Showing? Somethings showing? Oh how embarrassing. That happens when its colder.

Pamela Gray
January 7, 2009 9:30 pm

Now where did that apostrophe go? I am always losing that damned thing.

January 7, 2009 9:50 pm

No wonder you get cold readings. Look at all the snow on top of the shelter cooling it.

Tim Jenvey
January 7, 2009 9:53 pm

Not sure about how or where to post this. This is my first time so be gentle,
I happened to look at the Arctic Sea ice web site: http://nsidc.org/data/seaice_index/images/daily_images/N_timeseries.png
It appears a little odd as I remember the 2008 line never crossed the 2007 line last year. Well, it now does. Any thoughts from anyone?

Patrick Henry
January 7, 2009 10:08 pm

Wolf Creek Ski Area in Colorado has already received 20 feet of snow this winter.
http://www.wolfcreekski.com/snow.asp
Meanwhile, Boulder climate experts predict the demise of the ski industry, due to a lack of snow.
http://www.iht.com/articles/ap/2008/12/16/sports/SKI-Disappearing-Snow.php

Neil Crafter
January 7, 2009 10:10 pm

ak (20:02:36) :
didn’t really think you couldn’t scrape up any less significant data than your previous post, but you managed to do it. good luck with the weblog awards. 🙂
Are you saying that all station records are insignificant or just this one because it doesn’t suit your mindset?

Jim B in Canada
January 7, 2009 10:12 pm

“didn’t really think you couldn’t scrape up any less significant data than your previous post, but you managed to do it. good luck with the weblog awards.”
ak you seem to miss the point of this site, we are not big pretty picture “science” here. I for one don’t care about a science screw up in a popular movie or tv show, or how religion is evil (how is that even science?) . I really don’t care.
I CARE about the infrared properties of white wash vs latex paint, and how an improperly placed air conditioner can raise a MMTS weather station .12 degree F, and exactly what is the diameter difference between a sun spot or a sun speck, and exactly how many days has the solar wind speed density been under 9.98 p/cm^3.
The people who frequent Wattsupwiththat, climateaudit, climatesci.org are proud to be called Dorks, Nerds, and Geeks, because we breath the minutiae of science, because in the end, that’s where all real science is done.
Now if you don’t mind I’m going to go read up on ocean heat thermal dynamics and the proper methodology to measure tree ring chronologies.
Have a nice day 🙂

Pamela Gray
January 7, 2009 10:28 pm

ArCtic ice is something like caring for a toddler in an open park. Or like herding cats caught in a kennel.
Temperatures plunge unevenly as the winter season begins and waters begin to freeze. Ice floats, and it’s a bit chunky and soft around the edges. Wind blows (from pressure variants) and pushes ice, sometimes to warmer waters, sometimes to colder waters. Never the same from day to day. Currents underneath carry it to and fro as well. Jet stream influences wind patterns that circle the Arctic. It will grow, just like cats having babies, but you still won’t be able to herd it. During the melt season, seasonal tilt of the Earth and the Sun’s rays do the rest.

robert gregg
January 7, 2009 10:33 pm

I am surprised he has a 4″ plastic precip gauge instead of a
Standard 8″ gauge. With that much snow it seems his readings for total precip may be too low.

January 7, 2009 10:40 pm

From the Anchorage sea-ice desk
…JANUARY YEAR GROUP ANALYSIS AND OUTLOOK…
ICE EDGE LOCATIONS IN THE BERING SEA ARE 30 TO 40 PERCENT ABOVE
NORMAL. ACTUAL ICE EDGE POSITIONS THIS YEAR ARE 60 TO 100 NM SOUTH OF
THE SAME TIME LAST YEAR. ICE IN COOK INLET IS 25 TO 35 PERCENT ABOVE
NORMAL AND EVEN GREATER IN KACHEMAK BAY.

THE YEAR GROUP FOR JANUARY IS 1975 FOLLOWED BY 2000. BOTH OF THESE
YEARS WERE DURING LONG PERIODS OF LA NINA CONDITIONS IN THE PACIFIC.
THIS YEAR WE ARE ALSO IN A LA NINA THAT IS EXPECTED TO CONTINUE INTO
THE SPRING. LA NINA WINTERS ARE USUALLY COLDER THAN NORMAL IN ALASKA.
SEA ICE CONDITIONS IN JANUARY 2000 WERE SLIGHTLY MORE SEVERE THAN IN
2009 AND SLIGHTLY LESS ADVANCED IN THE BERING DURING 1975.
THE BERING SEA AND COOK INLET WILL HAVE EXTREME ICE SEASONS THIS YEAR
WITH MUCH GREATER THAN NORMAL ICE AREAS. EXPECT THE ICE EDGE TO REACH
POSITIONS NEAR AND BEYOND THE BERING SHELF SEVERAL TIMES THROUGH
FEBRUARY AND INTO EARLY MARCH. ICE WILL MOVE IN AND OUT OF SAINT PAUL
WITH PASSING WEATHER SYSTEMS. ICE WILL SURROUND SAINT GEORGE AT
TIMES FROM LATE JANUARY THROUGH FEBRUARY. ICE WILL ALSO DEVELOP AND
RETREAT THEN RE-DEVELOP ALONG THE BERING SIDE OF THE ALASKA PENINSULA
THROUGH EARLY FEBRUARY.
ICE WILL CONTINUE IN LOWER COOK INLET INTO APRIL AND UPPER COOK INLET
THROUGH APRIL. ICE THICKNESS IN COOK INLET WILL GROW UP TO 30 TO 36
INCHES FOR AREAS NORTH OF KALGIN ISLAND BY EARLY FEBRUARY.
KCOLE 2009

Robert Bateman
January 7, 2009 10:40 pm

Neither did the sea ice shrink to the 2007 levels this year, as imaged.
Don’t know about Russia this winter, but Canada, Alaska and N. Europe are getting blasted with severe cold.
That’s gotta do some serious freezing out in the Arctic Ocean.
Data Fudge anyone?

L.K.
January 7, 2009 10:54 pm

To all who think snow on top of the “housing” will makesa difference in an annual measurement…why not try an actual experiment?
Get two thermometers, and put one of them in tupperware.
Put them both in your freezer, and put ice on top of the tupperware.
Is there a difference? 😉

crosspatch
January 7, 2009 10:58 pm

Unusually intense pressure gradients have (according to the ice people) caused unusually strong Southerly winds East of Greenland preventing ice from expanding in that area in the usual fashion.
Its weather.

Pamela Gray
January 7, 2009 11:00 pm

Tom, you just posted eye candy. Ice edges. I lurv ice edges.

the_Butcher
January 7, 2009 11:37 pm

New Zealand is burning at the moment with temperatures of +40C +

King of Cool
January 7, 2009 11:54 pm

Tim Jenvey (21:53:07) :
Not sure about how or where to post this. This is my first time so be gentle,
I happened to look at the Arctic Sea ice web site: http://nsidc.org/data/seaice_index/images/daily_images/N_timeseries.png
It appears a little odd as I remember the 2008 line never crossed the 2007 line last year. Well, it now does. Any thoughts from anyone?

Because the daily extent chart now shows the winter of 2006 to 2007 (dashed green line) not 2007 to 2008. NSIDC say that the graph will continue to show 2007, which went on to reach the lowest summer minimum in the satellite record.
I think this is the chart that you recall:
http://i251.photobucket.com/albums/gg311/johnnyrook1/SeaiceextentDecember202008NSIDC.png

Glenn
January 7, 2009 11:55 pm

Patrick Henry:
“Wolf Creek Ski Area in Colorado has already received 20 feet of snow this winter.
http://www.wolfcreekski.com/snow.asp
Meanwhile, Boulder climate experts predict the demise of the ski industry, due to a lack of snow.
http://www.iht.com/articles/ap/2008/12/16/sports/SKI-Disappearing-Snow.php
They have an excuse:
http://www.google.com/hostednews/ap/article/ALeqM5ieNs1iJBpTVuD3_nG9ZB8sqffFEAD95IQD680

davidc
January 7, 2009 11:59 pm

Brooklyn Red Leg (20:49:31)
I love it. Like “you measured the temperature in your house but didn’t put the thermometer in the oven??? Don’t you know that’s the hottest place in the house??? The most important place??? (How can people who aren’t peer reviewed climate scientists be this stupid?)”

davidc
January 8, 2009 12:08 am

ak,
So we’ve got global warming, Coal Creak is on the globe so why is it colder? There could be plenty of reasons, but you don’t say.

January 8, 2009 12:09 am

the_Butcher:
NZ may be *ahem* ‘burning’ [40 deg C = 104 deg F], but remember that NZ is in the Southern Hemisphere, so this is the equivalent of July 7th in the NH. A local heat wave of 40 degrees occurs fairly routinely some time in mid-summer. Let’s look at the NZ temp again next week.
In other predictions, I confidently predict that someone will remind folks from now until Monday not to get complacent, but to vote every 24 hours: click
The link makes it super easy! Just click & vote. Thanks. You are truly a good person. Collect your 100,000 carbon offsets here.

Michael
January 8, 2009 12:32 am

I have seen the work you have been doing on locations of weather stations Anthony so you won’t be surprised to know that most of those in capital cities of Australia are located at airports. Either civilian or at RAAF sites. Here are the locations kindly brought to you in one diagram by the Bureau of metrology. Just click on the orange dot to see a picture of each location.
http://www.bom.gov.au/climate/change/reference.shtml#rcsmap

Norm in the Hawkesbury
January 8, 2009 1:16 am

Thanks Michael (00:32:56)
I looked at that page yesterday but didn’t click on those links just ran my cursor over some to find the location name. What most non-Australian citizens (and those who live in the major cities and never get out of the suburbs) should realise is that the airports where most of these BOM instruments are located are pretty timid affairs. Rather than calling them airports they should be reclassified as places where an occasional aeroplane might land or take off. See Oodnadatta Airport BOM site for instance 😉 Notice how they are fenced off? That stops the dingos p%$sing on them and cause a break in the drought 🙂
More OT after three days in the high 30’sC today we dropped to 26C. Currently 16C (8:15pm) wi a dreich haar blanketing the gloomy gloming. Summers delayed while GW reappears for a couple of days.

January 8, 2009 1:17 am

L.K.
I would guess that a lot of snow on top of the shelter would decrease minimum night time temperature as the top is insulated against the cold night sky. Similarily, maximum day time temperature is lowered. During winter the former probably dominates, but I can’t tell if it is significant.
Best,
avfuktare vind

January 8, 2009 1:18 am

Sorry,
“increase minimum night time temperature” it should have been!

January 8, 2009 1:21 am

Dear Dr. Keen,
it may help to include the years 1997 and 1998 in your graph, then one could see, whether the 1997 El Nino left a fingerprint also at your station.

Steven Horrobin
January 8, 2009 1:40 am

Re Arctic sea ice:
Crosspatch is correct. The situation in the UK is that due to an intense High over Northern Europe and Scandinavia, southerly winds have predominated in Scotland, while North Easterlies have predominated in England, leaving England FAR cooler than Scotland for the past month at least. This has drawn cold air away from the Atlantic side of the Arctic, while drawing warm Atlantic air North over Greenland etc.
As to Tim Jenvey’s query, I have one of my own- why is it that the comparator line in the nsidc daily chart has flip-flopped between 2006-7, as it was some months ago, then 2007-8, for several months until recently, and now apparently has returned to the 2006-7 line?
See: (current)-
http://www.nsidc.org/data/seaice_index/images/daily_images/N_timeseries.png
(Oct 2008)- http://www.nsidc.org/images/arcticseaicenews/200812_Figure2.png
I do find this odd, and the cynic in me wonders if the comparator is chosen to intuitively suggest the “lowest” apparent current value.

Paul Shanahan
January 8, 2009 2:04 am

Light hearted off topic;
looks like Wind Turbines are also starting to affect Aliens…
http://www.thesun.co.uk/sol/homepage/news/ufos/article2108149.ece

bluffing
January 8, 2009 2:07 am

Mike wrote
No wonder you get cold readings . Lokk at the snow on top of the shelter cooling it . LOL
No wonder you didnt get reply Joe

The Science
January 8, 2009 2:08 am

Le sigh. New Zealand is not burning up at 40C. It was one suburb in Christchurch on one day. The rest of us are at a nice 25-30C.
Summer is nice.

January 8, 2009 2:28 am

Cooling at “Coal Creek”? I assume then that all that nasty black coal at Coal Creek has been left in the ground, otherwise there is no way there would be cooling there?
Yes, NZ is in the middle of summer. I am sitting almost on top of the equator and wore a jumper today. 23oC is pretty cold in these parts.
BTW – thank you Michael for the Aussie weather stations web page link. That will make a great theme for some sight seeing.

Spathirin
January 8, 2009 3:13 am

ak, I’m not sure how this is irrelevant. Any chance of clearing this up?

TerryS
January 8, 2009 3:17 am

Steven Horrobin (01:40:50) :

As to Tim Jenvey’s query, I have one of my own- why is it that the comparator line in the nsidc daily chart has flip-flopped between 2006-7, as it was some months ago, then 2007-8, for several months until recently, and now apparently has returned to the 2006-7 line?

It is consistent (kind of) in that they are always comparing with 2007. In the lead up to the start of the melt (which we are in now) you would be more interested in comparing with the 2006-2007 rather than the end of 2007-2008.
During the melt the comparison is just with 2007.
During the recovery they compare it with the end of 2007 and beginning of 2008.
If they are going to compare this year with 2007 then they have to flip from comparing the recovery phase (2007-2008) to comparing the melt phase (2006-2007) at some point.

Freddie S.
January 8, 2009 3:36 am

Hey butcher,
I just checked the NZ temps on world weather, the Max. for today was 29C, how did you measure the temp?
Regards, Freddie in the Swiss mountens, freezing my *** off.

Bryan Quigley
January 8, 2009 3:40 am

“New Zealand is burning at the moment with temperatures of +40C”
Not sure what planet you’re on but down here temperatures are all around the mid to late 20’s at the moment. Maximum recorded temperature in Auckland so far this month is 27C, Wellington official max is 21C.
BQ.

January 8, 2009 3:46 am

When the snowfall is WAIST DEEP, I’ll give the guy a break on some snow accumulating on top of the instrument ‘shacks’….
Interesting graph…the daily dose of ‘the world is ending due to man-made climate change’ is almost a conspiracy. Thanks to you (Anthony) and others, we have evidence to tell the alarmists ‘not so fast’…
Thanks for keeping me informed…
~Michael
http://www.cookevilleweatherguy.com

Kevin B
January 8, 2009 4:19 am

OT, but for the wind turbine story fans out there this one is quite interesting.
It seems that others in the universe are not so keen on the things either.
(I should point out that Lincolnshire has been under a high pressure zone for the last two weeks or more so the blades were probably not turning that quickly.)

JimB
January 8, 2009 4:21 am

“L.K. (22:54:42) :
To all who think snow on top of the “housing” will makesa difference in an annual measurement…why not try an actual experiment?
Get two thermometers, and put one of them in tupperware.
Put them both in your freezer, and put ice on top of the tupperware.
Is there a difference? ;-)”
But that’s only half of the experiment…
You then need to take the same two thermometers, AND ice covered tupperware out side in the sun and take another measurement.
Is there a difference?…I think so now.
JimB

Daniel C. Smith
January 8, 2009 4:29 am

Anthony
I’m sure you have seen the amazing letter James Hansen and his wife have written to President Elect Obama and his wife. From the beginning, where he addresses them as “Barack and Michelle” it is a case study in unapologetic megalomania. I have long suspected that he has several loose screws rattling about under his dome; now I’m convinced. What he doesn’t know about economics can hurt the rest of us if his suggestions are adopted. It doesn’t say much for the rigor he fails to use with the rest of his work. I’d love to see a post by you or one of your contributors on this.
REPLY: The letter has gotten wide coverage elsewhere, I find it so fawning and distasteful that I’ve chosen not to cover it here. – Anthony

Steve M.
January 8, 2009 4:45 am

hmmm, this is odd. I tried to search for this weather station on gisstemp website to get the raw and homogenized data. Here’s a result of stations withing 243km of Denver, CO:
http://data.giss.nasa.gov/cgi-bin/gistemp/findstation.py?lat=39.78&lon=-104.87&datatype=gistemp&data_set=2
Not a single station has data newer than 2007??? Is this correct? What happened to all these stations? Do they report just once a year? Or have they all stopped reporting?

Steve Keohane
January 8, 2009 4:46 am

Avfuktare vind vindsavfuktare (01:18:32) the sides of the Stevenson Screen have open slats, it’s ventilated. Unless the snow completely buries it, there won’t be a significant difference.
Patrick Henry: I lived in the Loveland/Ft. Collins area for twenty years and never heard of Coal Creek. Google maps says it is SW of the Springs, but I assume Dr. Richard Keene knows if he is NW of Denver or not. Can you tell me where this is?

MarkW
January 8, 2009 4:53 am

Just a guess, but I would expect the snow to slow the rate at which the box warms. Especially once the air temperatures get above freezing. There’s also the worry that if the air temperatures get to be just below freezing and the sun melts some of the snow, refreezing water could block the slats on the side, reducing air flow through the unit.

MarkW
January 8, 2009 4:53 am

On the other hand, I suspect that snow on top of this unit is nothing unusual.

John Laidlaw
January 8, 2009 5:11 am

Re: the_Butcher (23:37:32)
So New Zealand is experiencing high temperatures? In summer? Wow. Think you may be confusing weather with climate…
The record was set thusly:
Rangiora, South Island, 42.4°C, 7th of February 1973. Just under 35 years ago.

John Laidlaw
January 8, 2009 5:12 am

*RATS!* “Just under *36* years ago”. It’s early for me, sorry… :).

ak
January 8, 2009 5:31 am

@Anthony, i came here looking for good counterpoints to my own belief – that humans are affecting our environment, and one consequence of that will be warming of the earth. i believe that good arguments can be made. if this blog’s aim is simply to deal with individual stations, then that’s fine. it just seems that you are trying to make larger inferences to the globe from individual data points – the NCDC post was temperatures for 2% of the earth’s surface over 10 years, now it’s a single point over 5.
i half expect a recount of last weekend in austin, tx to show up here. it was 80 one day and the two days later i was having to wear a sweater and a hat. maybe it’s just been the past couple posts, but i was looking for stronger arguments. that being said, i’m not going to give up on you just yet, and i may post snark when i feel it’s warranted. 🙂
“So we’ve got global warming, Coal Creak is on the globe so why is it colder? There could be plenty of reasons, but you don’t say.” -davidc
i’m not disputing the data, but your comment doesn’t make much sense, for instance people say the US economy is in bad shape right now, but i just got a job, so i say it’s good! my getting a job doesn’t make the economy any better than it already is, nor does the fact that thousands of people are losing their jobs mean that my paycheck doesn’t benefit me.
REPLY: Perhaps you’ve missed what we do. See http://www.surfacestations.org This blog has had a long history of looking at individual stations, and we are collecting quality control data on the entire USHCN network, something that has never, ever, been done before. Yes we’ve had the old “but the USA is only 2% of the landmass” argument tossed at us thousands of times…so what?
If I stopped to listen to critics who tossed out the same objections you have, we’d not be anywhere in the project. But we are now more than halfway done in surveying the 1221 USHCN network.
The USA has the lions share of weather stations, and “supposedly” has the best network. We can’t do the entire world at once, so we are focusing on the USA (and it’s data set) to see just how well the premise holds up. So far it hasn’t done very well. However, the impact that the survey has had already is being felt worldwide, and has resulted in many useful findings. NOAA has even made an effort to fix some of the worst stations. For example I just got word that they moved Detroit Lakes away from the swamp and air conditioners. 😉
Be critical, point out flaws, we’ll learn from those as we have been doing all along. However, I’m going to continue to examine and showcase individual stations here, regional trends, global trends, short trends, long trends, and yes, even single station trends, plus anything else I and my readers find interesting. If the content does not suit you, read elsewhere. – Anthony

Gary
January 8, 2009 5:37 am

That station looks to be out of compliance with standard siting criteria. The trees are too close. Shading and elevated humidity probably skew the temperatures a bit. That might be tolerable for a comparison of temps at this one location over the years, but not so good for comparison to other stations. I might trust it to estimate local skiing conditions, but not much else. FWIW, this station isn’t in the USHCN and has only been active since 1993.

January 8, 2009 5:48 am

looks like the WUWT margin has increased 🙂
http://2008.weblogawards.org/polls/best-science-blog/

Steven Horrobin
January 8, 2009 5:55 am

Of course, it may well be that the legitimate point that is being made that a significant freeze up may be succeeded by a huge melt. However it is somewhat of an odd way to make the point. If suddenly skipping back a year is legit, why not fifteen or twenty?

Steven Horrobin
January 8, 2009 5:59 am

Whether it is weather that has held off the freeze North of Iceland should become clearer soon, as the North European high has shifted South, and weakened, presaging the usual round of intense winter lows across the North Atlantic, which should bring air from Northern Canada across Greenland, cooling the whole area a lot. So the hypothesis predicts significant ice growth in the areas North and East of Iceland over the coming month to six weeks. Let’s see…

Steven Hill
January 8, 2009 6:10 am

I bet they were grilling hotdogs next to that collection site in the past! It can’
t be cold, the people calling us ASS said it’s not.

Steven Horrobin
January 8, 2009 6:15 am

Also Sprach der Sessel!

Steven Horrobin
January 8, 2009 6:16 am

(I meant me)

Gary Palmgren
January 8, 2009 6:17 am

I see there are trees close the the thermometers. I’ve always wondered about the proper siting for the temperature gauges in a forested region. Shouldn’t they be located in the forest? The site rating for this post is irrelevant as it was stable over the last 10 years with no artificial heat sources.
It’s kind of hard to keep the thermometer clear of snow when it snows a foot overnight. Would you use heater to keep it snow free? 😉

Bruce Cobb
January 8, 2009 6:21 am

Eyeballing the graph, it looks to be about a 1.5F drop over the 10-year period, or about the same amount as the global warming the past century. By itself, not all that significant, but when added to the growing evidence of cooling, then yes, certainly it is at least noteworthy, “ak”. No UHI effect, either, so the temperature record would seem to be far more accurate than other locations.
It would be nice to know if the snow on top of the housing has any significant effect, and/or if removing the snow is standard procedure or not.
Well, need to fire up the snowthrower, to clear a bunch of “global warming” off my driveway. Ski season here in NH is off to a flying start (last year’s was a record-breaker).

Editor
January 8, 2009 6:24 am

Dr. Richard Keen:

That’s full 3 degrees F colder than 2003. Each of the past five years is colder than any of the previous five years.

From the graph, I’d say 2007 was warmer than 2004. Did you mean to say “Each of the past five years was colder than the year five years before?” E.g. 2007 was colder than 2002.
Ah, or did you mean “Each of the years from 2004 to 2008 was colder than each of the years from 1999-2003?” That’s a more meaningful comparison.

Josh
January 8, 2009 6:24 am

I’ve lived in Breckenridge, CO since Fall 2005. The first three winters were frigid, snowy and long-lasting and this winter is looking the same. Breckenridge just had one of its snowiest Decembers on record. Beaver Creek just had its snowiest winter on record. When I was in Crested Butte last February the snow was a settled eight feet deep in town. I’ve had so many powder days I can’t even remember all of them. Snow levels are not rising. Temperatures are not rising. The winters are starting in October and ending in June. I don’t think the ski industry needs to fear manmade “climate change”.

Chris D.
January 8, 2009 6:31 am

Dr. Keen or Anthony,
I didn’t find Coal Creek in the Surfacestations gallery (nor a placeholder). Would this station qualify for inclusion in the gallery (record of sufficient duration)? Also, how free of microsite bias would you say this station is, and has been, over the duration of the record? I see it’s on a slope, but assume that’s fairly representative of the general area. Thanks for the post!
REPLY: It is not a USHCN station, simply a COOP station. The reason it is not USHCN is duration of record. – Anthony

rhodeymark
January 8, 2009 6:34 am

I read somewhere that igloos, made of snow, must be torn down when they start icing as the interior temperature drops, and the insulator effect is lost. That would make me tend to think that AVV is correct and the powder snow on the station is insulation against nighttime lows.

Chris D.
January 8, 2009 6:35 am

P.S. – Yes, I realize the duration of the record doesn’t matter for the purpose of this thread since the thread is only talking about a decade worth of history.
It’s always nice to hear from a station observer. I wonder what sort of instruction they are given about what to do about icecicles covering the slats, snow on the roof, etc.

hotrod
January 8, 2009 6:38 am

Interesting observations there in Coal Creek Canyon.
I live just a few miles north east of that area and also have seen a general trend for colder weather over the last few years in mid winter. For some time it was rare to see seriously sub zero temps during the winters but the last few years we have gone back to a more normal winter cycle that occasionally dips into the -10 to -15 deg range.
Your post got me to browsing around and I found the following site that allows you to pull up median monthly temps for states going back 100 years.
The Colorado Data shows no significant trend over the past 108 years of data.
The trend line is nearly flat from 1910 to 1990 then a slight upward trend from 1990 to 2005 followed by a sharp dip over the last 3 years, 2009 data is not available yet.
Here is the data for the last 50 years, temps are in deg F, these are state mean temps for the state of Colorado.
2008, 19.9
2007, 18.3
2006, 29.5
2005, 30.1
2004, 25.5
2003, 31.6
2002, 25.2
2001, 24.1
2000, 29.3
1999, 30.0
1998, 27.8
1997, 24.0
1996, 23.9
1995, 26.2
1994, 26.2
1993, 23.1
1992, 22.9
1991, 20.8
1990, 25.9
1989, 23.4
1988, 18.3
1987, 24.2
1986, 31.2
1985, 21.1
1984, 18.7
1983, 27.1
1982, 23.6
1981, 30.4
1980, 23.6
1979, 14.1
1978, 22.7
1977, 20.9
1976, 22.9
1975, 22.0
1974, 18.8
1973, 18.8
1972, 23.9
1971, 25.4
1970, 24.3
1969, 27.9
1968, 22.2
1967, 26.1
1966, 19.9
1965, 27.6
1964, 22.7
1963, 16.5
1962, 18.3
1961, 24.3
1960, 21.4
1959, 24.6
1958, 24.6
Hopefully I made not typo’s in transcribing the data from that web application.
Larry

hotrod
January 8, 2009 6:39 am

Sorry I forgot the source page:
http://www.ncdc.noaa.gov/oa/climate/research/cag3/cag3.html
Larry

Steve Keohane
January 8, 2009 7:01 am

Hotrod, Anthony, anyone.. Where the heck is Coal Creek Colorado?
REPLY: Here is a Google Maps link to the station lat/lon
http://maps.google.com/maps?q=39.8958,-105.3847&oe=utf-8&client=firefox-a&ie=UTF8&ll=39.896041,-105.384979&spn=0.608981,1.455688&t=h&z=10&iwloc=addr
BTW your question prompted my search which serendipitously led me to a previously unknown NOAA resource for COOP stations. Thanks for being the catalyst. – Anthony

bsneath
January 8, 2009 7:04 am

King of Cool (23:54:10) : “Because the daily extent chart now shows the winter of 2006 to 2007 (dashed green line) not 2007 to 2008. NSIDC say that the graph will continue to show 2007, which went on to reach the lowest summer minimum in the satellite record.”
How can there be any credibility with climate data? It is no longer scientific, rather it is manipulated, without explanation. No objective scientist would adjust a graft without, at a minimum, notifying the viewer of the change made and the reasons why. This is incredulous. It has been politicized beyond all recognition. It is POO-BAR!
Hansen and his cohorts will soon learn the wisdom of Abe Lincoln:
“You can fool some of the people all of the time and all of the people some of the time but you cannot fool all of the people all of the time.”
Common sense (as in….it is really cold out there) is telling the general population that perhaps they should put into question the dire warnings of climate change “experts”. The momentum behind this opinion change is building very quietly since mainstream media embraces AGW.
I saw the same thing happen during Clinton’s first term. The Liberals took charge, massive federal programs and controls were proposed and if you read the newspapers or watched TV news, you would have thought the general population was completely supportive. But the true feelings of the public came out at the mid-term elections when the Democrats were soundly defeated.
I cannot predict weather or climate change, but I will predict that we will soon witness “deja vu all over again” as the climate models continue to vary from reality and the so-called experts are forced into ever greater and thus more obvious data manipulation in an effort to justify their politically, financially & emotionally driven belief systems.
It should be fun theater. Many thanks to AW, SM, Drudge and many others for “keeping it real”!

kim
January 8, 2009 7:05 am

Kevin B (04:19:04)
I wonder if the light might be the rising sun reflected off the blade.
========================================

Patrick Henry
January 8, 2009 7:07 am

Emergency teams are trying to restore power to thousands of homes in the south of France after the worst blizzard conditions in two decades.
http://news.bbc.co.uk/2/hi/europe/7817124.stm

Patrick Henry
January 8, 2009 7:08 am

The Met Office warns of more dangerous hot weather, as Britain suffers it’s coldest winter in 30 years.
http://www.guardian.co.uk/uk/2009/jan/08/summer-aid

bsneath
January 8, 2009 7:09 am

btw – I meant to write “graph” not “graft” in the above comment….. but on second thought, maybe not.

Patrick Henry
January 8, 2009 7:12 am

Steve,
Coal Creek Canyon is in the mountains between Golden and Boulder.

Pamela Gray
January 8, 2009 7:23 am

Regarding ice growth, you must take into account where it already is stable, and where the soft edge is, ocean currents (warm and cold) in and out of the area, surface winds, and jet stream, as well as pressure gradients and air temperature. Ice growth is a function of all of this.

George M
January 8, 2009 7:31 am

A couple of minor details about the shelter. It has an interior baffle below the roof, and the space between is ventilated, allowing it to approach exterior air temperature. So, the effect of the snow on top is greatly reduced. Also, the lower edge of the roof extends away from the sides enough to generally prevent melt from clinging to the louvers.
And a major detail. Anyone else priced one of those things? Nearly a $Grand with the legs and other accessories.

Steve Keohane
January 8, 2009 7:40 am

Patrick, thank you. Google Earth and Maps has a Coal Creek, Colorado SW of Florence, SSW of Denver. After delivering lumber from Walden to Kansas, and Denver to Cheyenne during the 70s, I thought I knew N. Colorado pretty well. Yet one of the best things about this great state is after 35 years of hiking, camping and fishing it; there is always somewhere new to explore.

Roger Sowell
January 8, 2009 7:48 am

With all the comments on record snow, here is one from California’s official water department. They measure snow in the Sierra mountains to predict how much water will be available after the spring melt.
“DWR Announces Snow Survey Results
The Department of Water Resources (DWR) first snow survey of the 2008/2009 winter season indicates snow water content is 76 percent of normal for the date, statewide. This time last year, snow water content was 60 percent of normal statewide. While this year’s water content is higher than last, winter storms arrived late. It is too early to tell whether improved figures will translate into a better water year than the state experienced last year, when winter storms ended early leading to California’s driest spring on record. (12/30/2008)”
The snow survey was from one location on December 30, 2008, near Lake Tahoe.
source: http://www.water.ca.gov/news/
Roger E. Sowell
Marina del Rey, California

Adam Sullivan
January 8, 2009 7:50 am

Obviously Dr. Keen is not much of a scientist. We all now know that real scientists work with corrected data and not the stuff actually observed. Any high school chemistry student knows – you have to screw around with the data to get the result the teacher wants.
Dr. Keen – Did you pass high chemistry?
/sarcasm

robert gregg
January 8, 2009 7:59 am

Pat Henry is correct, Coal Creek Canyon is near Golden. The NCDC has been receiving month data from it since November, 1993. The observer sheets do not give an observer name but the data collected is very thorough. There is a Coal Creek town located south of Canon City with a population of around 200 people.

Jon
January 8, 2009 8:06 am

Interesting confirmation from other valid stations in proper locations. I wonder if this is truely a ‘cooling’ trend or a ‘normalizing’ trend. Granted, the planet is cooler than the mid evil warm period, but that was also abnormal. If we go back to ’50s to ’80s temps that would really be considered ‘normal’ ..

Jeff Alberts
January 8, 2009 8:25 am

davidc (00:08:21) :
ak,
So we’ve got global warming, Coal Creak is on the globe so why is it colder? There could be plenty of reasons, but you don’t say.

It’s as I’ve been saying all along. Some places have gotten warmer, some cooler, some remained the same. Nothing “global” is happening here. Taking the temperature at numerous points, taking a mean, and calling it a “global temperature” is meaningless.

Jeff Alberts
January 8, 2009 8:37 am

It’s always nice to hear from a station observer. I wonder what sort of instruction they are given about what to do about icecicles covering the slats, snow on the roof, etc.

Umm, it’s just “icicles”. “Icecicles” are something you get from the Ice Cream Man 😉

Ed Scott
January 8, 2009 8:38 am

The hazards of global warming.
—————————————————–
12 deaths blamed on snow and cold across Europe
http://www.breitbart.com/article.php?id=D95IFM200&show_article=1

Bruce Cobb
January 8, 2009 8:48 am

ak (05:31:09) :
@Anthony, i came here looking for good counterpoints to my own belief – that humans are affecting our environment, and one consequence of that will be warming of the earth. i believe that good arguments can be made.
First of all, everyone knows that humans affect our environment, so just put that ridiculous little strawman argument of yours away, and concentrate on your belief in AGW. This particular thread is about the evidence for cooling. Sure, it’s at one location, and over “only” a decade, but there have numerous reports here, and in the news about extreme cold and snow contraindicating the alarmist cries of global warming, such as this
Have you even bothered looking at some of the other posts? Look around, and you will see many posts which deal more directly with climate, and with AGW. Stick around, read some of the previous posts which might be of more interest, and ask questions. But, I suggest you put away the snarkiness and misplaced contempt you have shown so far. That will not get you very far here.

Keith W
January 8, 2009 8:59 am

JUNEAU, Alaska – Ted Johnson planned on using a set of logs to a build a cabin in Alaska’s interior. Instead he’ll burn some of them to stay warm.
Extreme temperatures — in Johnson’s case about 60 below zero — call for extreme measures in a statewide cold snap so frigid that temperatures have grounded planes, disabled cars, frozen water pipes and even canceled several championship cross country ski races.
Alaskans are accustomed to subzero temperatures but the prolonged conditions have folks wondering what’s going on with winter less than a month old.
National Weather Service meteorologist Andy Brown said high pressure over much of central Alaska has been keeping other weather patterns from moving through. New conditions get pushed north or south while the affected area faces daily extremes.
“When it first started almost two weeks ago, it wasn’t anything abnormal,” Brown said. “About once or twice every year, we get a good cold snap. But, in this case, you can call this an extreme event. This is rare. It doesn’t happen every year.”
Temperatures sit well below zero in the state’s various regions, often without a wisp of wind pushing down the mercury further.
Johnson lives in Stevens Village, where residents have endured close to two weeks of temperatures pushing 60 below zero.
The cold has kept planes grounded, Johnson said. Food and fuel aren’t coming in and they’re starting to run low in the village, about 90 miles northwest of Fairbanks.
Johnson, whose home has no heater or running water, said he ventures outside only to get more logs for burning and to fetch water from a community facility. He’s been saving the wood to build a cabin as a second home, but that will have to wait a few years now because the heat takes precedence.
“I’ve never seen it this cold for this long,” he said. “I remember it 70 below one time, but not for a week and a half.”
In Anchorage, Alaska’s largest city, residents are used to lows of about 10-degree temperatures in January — not 19 below zero, which is what folks awoke to Wednesday morning.
Temperatures finally settled to about 10 below at midday, but that was cold enough to cancel races in the U.S. Cross Country Ski Championships.
Skiers won’t compete unless it’s warmer than 4 below zero, but the numbers have ranged between 10 below and 15 below.
That has led to four days of canceled or postponed competition with organizers hoping to get a set of races under way on Thursday, the event’s final day.
Meanwhile, in Juneau, the state’s capital is enjoying balmy weather by comparison with lows in the single digits.

Sunspotter
January 8, 2009 9:08 am

A conundrum has been puzzling me lately. All these “surface stations”
are elevated, and so, are in fact measuring atmospheric temp.
If we really want to know what’s going on with the Earth, shouldn’t we
also be measuring the temp. in the surface? At, say, a depth of
2-1/2 to 3cm? Just a thought.

crosspatch
January 8, 2009 9:11 am

“weather” is a single day or maybe even a single season when maybe a stubborn weather system sets in and the result is an anomalously warm or cool season. The thing that is interesting here is that the temperatures are *annual averages* over a period of several years. Forget the picture of the snow for a moment and focus on the graph. The annual average temperatures for 5 years running have been cool. *That* is not weather.
A cool day or week or month will get swamped out in the averages. A cool year can be a blip among many and only causes a wiggle in a smoothed average over time. But when you have several years in the same direction end to end, that is what is called a trend and now we start to get into “climate” rather than “weather”.
The graph is significant because CO2 is “well mixed” in the atmosphere and “Global Warming” is supposed to be, well, global. The same CO2 that would cause overall warming in Omaha should also cause overall warming in Coal Creek. If the atmosphere itself is warmer, than the entire atmosphere should be warmer.
What we see here is yet another indication that there is no “global warming” and that the warming we saw in the 1990’s was temporary and probably a natural cyclical event.

crosspatch
January 8, 2009 9:21 am

Also, greenhouse warming should raise average temperatures by decreasing nighttime lows. CO2 would prevent heat from being radiated into space at night. It should have its greatest impact in winter when nights are longer than days. It would have still greater impact at higher latitudes where night is much greater than day in length. CO2 would not be expected to increase daytime high temperatures much because in addition to blocking IR from the Earth being radiated to space, it would also block IR from the sun reaching the surface. So turning your face to the sun on a sunny day would feel a little less warm. It would act to moderate the difference in temperatures and mostly increase the lows. Greenhouse warming should make record low temperatures more and more of a rarity. That isn’t happening.
Also, since the CO2 would absorb IR from both sun and Earth, the atmosphere that is absorbing all that heat should show a heat anomaly. It isn’t.
The bottom line is that observations are showing rather conclusively that Hansen’s hypothesis if human caused global warming due to increased CO2 from the burning of fossil fuels simply isn’t happening. There really is no additional argument needed. It simple isn’t there. His models show a system that does not reflect what is happening on Earth and no amount of argument or equations or adjustment can change the fact that the properties that would *have* to be true in order for the hypothesis to be true simply do not exist.

Ed Scott
January 8, 2009 9:22 am

The hazards of global warming.
———————————————————
Global Warming Horror Flick Put on Ice
How embarrassing is it when you produce a horror movie based on global warming and when the time comes to release it, the planet is experiencing some of the coldest weather in decades? Such is the case with The Thaw starring Val Kilmer. Filmed in Canada last summer, it should be ready for release by now but even though the trailer has been produced, no specific release date has been announced. Perhaps the producers realize how much of a laughingstock this movie would become if a movie based on the premise of global warming were released when their potential audience is freezing.
The Thaw Trailer

Nelthon
January 8, 2009 9:30 am

The graph is significant because CO2 is “well mixed” in the atmosphere and “Global Warming” is supposed to be, well, global.

That’s a horribly simplistic misunderstanding of how climate works.

John W.
January 8, 2009 9:53 am

the_Butcher (23:37:32) :
New Zealand is burning at the moment with temperatures of +40C +

According to the New Zealand Meteorological Service, the highest forecast high for today is 29C in Christchurch. I’m going to pass on the opportunity to be snarky. You are the second person (that I’ve noticed) in as many days to fabricate abnormally high temperatures (yesterday’s fabricator hailed from Sydney). This is dumb: it’s boringly easy to locate an accurate source of weather information and expose the fabrication. I won’t infer any motive on your part, but you should be aware that you completely discredit yourself as a contributor to the discussion.

crosspatch
January 8, 2009 10:05 am

Nelthon, true, it is overly simplistic but over a period of several years it has to be true. It would be impossible for the entire atmosphere to trap heat and, over a period of many years, a place not become warmer.
Sure, a place can be cooler for a day or a season or even a single year. But overall global atmospheric warming *must* show overall global atmospheric warming … else it isn’t overall global atmospheric warming.
Now what *is* happening are a lot of local areas of warming due to land use changes, irrigation, cultivation, urbanization, deforestation, etc. And that can cause misleading results. If I have 10 stations scattered around a given area and all 10 of them are near areas of growing urban development, I can create what looks like “global” warming when in reality I have 10 spots of local warming.
NOAA did the same thing when they dropped literally thousands of rural stations from the monthly averages (stations where daily data is still available). What was left were a greater proportion of urban stations and (surprise!) temperatures shot upwards at the same time the rural stations were dropped.
But overall, if the entire atmosphere is warmer, there would be no escaping rising temperatures over the long trend. One might get a cool year, but one should never see a generally cooling trend lasting several years and particularly so the farther one gets from the equator.

Craig D. Lattig
January 8, 2009 10:15 am

Nelthon (09:30:47) :
The graph is significant because CO2 is “well mixed” in the atmosphere and “Global Warming” is supposed to be, well, global.
That’s a horribly simplistic misunderstanding of how climate works.
True….
Almost as simple as “CO2 is causing Global Warming!”…which we all hear on a frequent basis….
I think most of us understand the points that crosspatch is making…if he is keeping it simple, it is so a poor ole biologist can follow the conversation…cdl

Wondering Aloud
January 8, 2009 11:05 am

Nelthon
“That’s a horribly simplistic misunderstanding of how climate works.”
Want to try to give us an explanation of how climate works that isn’t just as bad or worse? How would you describe the entire idea that CO2 causes warming?
I am not saying the original post was not over simplified, I am pointing out the old pot calling the kettle…

Neil Crafter
January 8, 2009 11:11 am

Nelthon (09:30:47) :
The graph is significant because CO2 is “well mixed” in the atmosphere and “Global Warming” is supposed to be, well, global.
That’s a horribly simplistic misunderstanding of how climate works.
Well, that is the crux of their argument isn’t it? CO2 (especially the nasty, dirty man-made variety) is well mixed in the atmosphere and causes global warming, yet here is a location in our atmosphere that has (presumably) well mixed CO2 and yet global warming is not present, in fact it is clearly cooling at this location, despite the rise in CO2. How does the conventional AGW theory explain away this Nelthon?

January 8, 2009 11:23 am

NOAA: 2008 Temperature for U.S. Near Average, was Coldest Since 1997; Below Average for December
http://www.noaanews.noaa.gov/stories2009/20090108_decemberstats.html

Joseph
January 8, 2009 12:06 pm

crosspatch, is atmospheric CO2 really all that “well mixed”? Judging from the information coming from the JPL’s AIRS project, it sure doesn’t look that way to me.
http://airs.jpl.nasa.gov/story_archive/Measuring_CO2_from_Space/
http://www-b.jpl.nasa.gov/news/news.cfm?release=2008-189
It looks to me as though the distribution of CO2 in the atmosphere is just as variable as the distribution of heat or water vapor.

January 8, 2009 12:07 pm

Nelthon (09:30:47) :
“The graph is significant because CO2 is “well mixed” in the atmosphere and “Global Warming” is supposed to be, well, global.
That’s a horribly simplistic misunderstanding of how climate works.”
In the same way as my belief that 2 + 2 does not equal 5 indicates a horribly simplistic misunderstanding of how mathematics works.
This whole climate debate was started by people who foisted a horribly simplistic theory of climate change onto fellow citizens, trusting that our horribly simplistic minds would not recognize that colder + colder does not equal warmer.
You want simplistic? Go watch “An Inconvenient Truth” again.
dh

January 8, 2009 12:15 pm

Please help us set this guy straight. Vote every 24 hours!

Ed Scott
January 8, 2009 12:16 pm

ak
“…i came here looking for good counterpoints to my own belief – that humans are affecting our environment, and one consequence of that will be warming of the earth.”
————————————————————–
Explain how humans activities are warming the Earth.

Brendan H
January 8, 2009 12:58 pm

John W: “According to the New Zealand Meteorological Service, the highest forecast high for today is 29C in Christchurch.”
According to my morning paper, the official NZ high for yesterday (8 Jan) was around 36 deg C, in Christchurch. So while short of 40, it was still historically on the high side.
From memory, the highest officially recorded New Zealand temperature was around 42 deg C, so 40+ deg sounds like an exaggeration, but could be true in a local hot spot.
So what’s it to be today? Beach, BBQ, or just a beer in the shade? Those ol’ summertime decisions.

crosspatch
January 8, 2009 1:05 pm

Here’s the most important thing to my mind. If you follow the IPCC projections made in 2001, using the “middle” projection which they deemed most likely, we should now be seeing global average temperatures (smoothed) 0.28 degrees higher than they were in 2001 and trending upwards.
What we see today are temperatures (smoothed) 0.10 degrees cooler and trending downward. In fact, they have been in a steady down trend since the IPCC issued the projection. 2008 wasn’t “weather”, it wasn’t an odd blip, it wasn’t a spike. It is part of a regular trend downward that increased its downward slope in 2006.
It doesn’t matter if one believes Hansen’s hypothesis is plausible or not. We now have enough information to say that it is just plain incorrect and isn’t happening.

January 8, 2009 1:17 pm

81F in San Antonio right now (3pm), but…going down to 34F Sun. night.
Not unusual tho. A pleasant respite from winter.

Patrick Henry
January 8, 2009 1:23 pm

Summer temperatures in New Zealand today range from 38F up to 81F. Mostly in the 50s and 60s.
http://www.wunderground.com/cgi-bin/findweather/getForecast?query=new%20zealand&wuSelect=WEATHER

Brendan H
January 8, 2009 1:34 pm

Anthony: “Perhaps you’ve missed what we do. See http://www.surfacestations.org This blog has had a long history of looking at individual stations, and we are collecting quality control data on the entire USHCN network, something that has never, ever, been done before.”
On perusing the stations org site I notice that a quality rating (1-5) is given for the various stations, distinguishing between well maintained and sited stations and those not so well maintained and sited.
It would be interesting to compare the temperature records of the different stations according to their quality rating. Has any analysis been done in this regard?

Ed Scott
January 8, 2009 1:41 pm

Estimation of the Radiative Forcing
for CO2 Doubling
by Peter Dietze
http://www.john-daly.com/forcing/forcing.htm
“…observations did not support the exaggerated warming, the IPCC assumed, the discrepancy was an effect of aerosol cooling while other effects (e.g. amplification of solar forcing) were considered to be insignificant. Their exaggerated aerosol cooling and the gain in parameter variability was ideal to maintain a far too high CO2 climate sensitivity, thus compensating for missing solar forcing amplification and any other model discrepancies, just as required.”
“IPCC authors so far refused to disclose details about the modelling assumptions and computation of their core parameter, demanding us to believe in their results – which is an unprecedented offence against rules in public funded science, and the TAR again follows this line.”
“Even if most of the error sources in ground temperature series (not to forget ocean measurements) would be eliminated, the trend should still not be (mis)used as a “proof” for the correctness of the CO2 sensitivity parameter the IPCC model results were based on. The estimation of radiative forcing done here and previously in the solar fraction analysis show that the CO2 climate sensitivity has indeed to be reduced considerably, just resulting in a rather harmless (if not beneficial) warming till 2100 – when fossil reserves become rare and mankind may turn to bulk power production from thorium breeders and fusion reactors anyway.”
————————————————————-
Bottom line: The ratio of natural CO2 to man-made CO2 in the atmosphere is 5.76 to 1

crosspatch
January 8, 2009 1:57 pm

Mr Watts, you might want to change your recommendation for weblog awards Huffington Post voting based on this:

Arianna Huffington has now gone on the record as saying, “It was an error in judgment” publishing Harold Ambler’s

More here.

davidc
January 8, 2009 2:05 pm

From ak:
” “So we’ve got global warming, Coal Creak is on the globe so why is it colder? There could be plenty of reasons, but you don’t say.” -davidc
i’m not disputing the data, but your comment doesn’t make much sense, for instance people say the US economy is in bad shape right now, but i just got a job, so i say it’s good! my getting a job doesn’t make the economy any better than it already is, nor does the fact that thousands of people are losing their jobs mean that my paycheck doesn’t benefit me.”
Well, we’re talking about GLOBAL warming as the problem and (we’re told) only GLOBAL action to prevent to prevent GLOBAL contamination of the atmosphere by CO2 can be effective. The IPCC projections tell us that this is happening now, is continuing and will be catastrophic. The fact that it has been cooling in many parts of the world simply means that those projections are wrong if we take them at their word that this is GLOBAL. Now, if they want to revise their projections and say it will be warmer in some places but cooler in others, OK but unless they have something to say about where it will be cooler or hotter I think the reaction would be …um, we knew that already. But even if they could do it, the IPCC wouldn’t want to specify local changes in temperature because that would make obvious what they want to conceal: that even if we could engineer reduced global temperatures (I don’t think we can) many people (at least the populations of Northern Europe, Central Europe, most of North America) would be much worse off.

Philip_B
January 8, 2009 2:26 pm

Two Australians killed by advancing glacier.
http://www.news.com.au/story/0,27574,24890577-38196,00.html
Had they been killed by a retreating glacier, doubtless Global Warming would have been blamed.
A vertical or overhanging terminus, which is what killed these 2 unfortunate young men, is characteristic of a rapidly advancing glacier.

crosspatch
January 8, 2009 2:30 pm

“The IPCC projections tell us that this is happening now, is continuing and will be catastrophic.”
Uhm, no. None of the IPCC projections have come true and not a single thing they have projected have come to pass. Not one thing.
Also, CO2 is not a contaminant. CO2 levels were at all time record lows as far as I can tell before they started climbing again during the industrial era. The atmosphere is actually *recovering* to something closer to what CO2 levels have been through geological history. We have a ways to go yet, though, before levels are back up to something more “normal”. Maybe another 1000 ppm will be better for the plants and animals that eat them.

George E. Smith
January 8, 2009 2:49 pm

Dr Keen,
Where abouts is your barbecue, under all that “partly cloudy” ?
It looks like you have a nice job though. Should we send someone to dig you out; or can you hold your own for a while?
George

George E. Smith
January 8, 2009 2:56 pm

“” Tom Woods (22:40:21) :
From the Anchorage sea-ice desk
…JANUARY YEAR GROUP ANALYSIS AND OUTLOOK… “”
Tom, look under the Tab key on the left of your keyboard; push that one !
George

George E. Smith
January 8, 2009 3:04 pm

“” the_Butcher (23:37:32) :
New Zealand is burning at the moment with temperatures of +40C + “”
New Zealand has the same problem that Australia has; they are both on the crusty side of the pizza; and just when we are having good skiing weather in Colorado; the Kiwis and Aussies decide it is time to go to the beach.
So don’t worry about it; in a few months, when we set fire to California again, you Mates down there can go skiing; well the Kiwis can; the Aussies don’t have any mountains; so they have to go skiing with the the man in the gray suit in Sydney Harbor.

Mike Bryant
January 8, 2009 3:04 pm

“So what’s it to be today? Beach, BBQ, or just a beer in the shade? Those ol’ summertime decisions.”
The beach is nice, just watch out for those rising sea levels. BBQ, uh, no making CO2, not nice to habitability… Beer? Excellent, enjoy it now before Global Warming makes it available only to the elite. 🙂

George E. Smith
January 8, 2009 3:21 pm

“” ak (05:31:09) :
@Anthony, i came here looking for good counterpoints to my own belief – that humans are affecting our environment, and one consequence of that will be warming of the earth. i believe that good arguments can be made. if this blog’s aim is simply to deal with individual stations, then that’s fine. it just seems that you are trying to make larger inferences to the globe from individual data points – the NCDC post was temperatures for 2% of the earth’s surface over 10 years, now it’s a single point over 5.
REPLY: Perhaps you’ve missed what we do. See http://www.surfacestations.org This blog has had a long history of looking at individual stations, and we are collecting quality control data on the entire USHCN network, something that has never, ever, been done before. Yes we’ve had the old “but the USA is only 2% of the landmass” argument tossed at us thousands of times…so what?
<>
If I stopped to listen to critics who tossed out the same objections you have, we’d not be anywhere in the project. But we are now more than halfway done in surveying the 1221 USHCN network. “”
So ak; are you trying to make a point that this “data” isn’t relevent, because it violates the Nyquist condition of sampled data systems ? If that is your point, then perhaps you can explain the basis on which you believe that Hansen’s GISStemp complies with the Nyquist theorem; given that it is widely accepted that GISStemp pretty much relies on the very sparse sampling network confined to the USA; did somebody say that is only 2% of the earth’s surface ?
Perhaps you could also explain how the AlGorythm used in “An Inconvenient Truth.” plotting Vostock Ice core data on pages 66/67 is a representative sample of the total global climate. Is it logical to base one’s beliefs on data from the coldest place on the planet?

E.M.Smith
Editor
January 8, 2009 3:26 pm

ak (05:31:09) :
@Anthony, i came here looking for good counterpoints to my own belief – that humans are affecting our environment, and one consequence of that will be warming of the earth. i believe that good arguments can be made. if this blog’s aim is simply to deal with individual stations,

AK, there are lots of posting here over several years. Some are global in perspective, some are detail oriented. Both matter. Each station and its quality matters. The whole picture matters. All of it’s here, just dig back through the history a bit.

George E. Smith
January 8, 2009 3:34 pm

“” Gary (05:37:29) :
That station looks to be out of compliance with standard siting criteria. The trees are too close. Shading and elevated humidity probably skew the temperatures a bit. That might be tolerable for a comparison of temps at this one location over the years, but not so good for comparison to other stations. I might trust it to estimate local skiing conditions, but not much else. FWIW, this station isn’t in the USHCN and has only been active since 1993. “”
Gary,
I’m curious; are you suggesting that Planet Earth excludes ALL locations, such as Coal Creek Canyon, when it computes just how much solar radiation to let in and how much total EM radiation it should allow to escape in order to set the gloabl climate.
I am sure that the planet correctly allows for the effects of Urban Heat islands, and it also properly accounts for all the official USHCN barbecues that Anthony has been chronicling here on this forum; so I don’t see why it would discriminate against Dr Keen’s good clean operation.
Can you give us the global co-ordinates for a pristine location that is properly situated at the current value of the GISStemp Anomaly, so we can google earth it, to see what the best places to live look like.
Well we know it isn’t Vostok Station; and it certainly isn’t an Iraqi desert; but I know for sure that Planet Earth includes all of those places in its AlGorythm for setting the temperature.

E.M.Smith
Editor
January 8, 2009 3:52 pm

Mike Bryant (15:04:52) :
Beer? Excellent, enjoy it now…

Hmmm… Beer contains CO2. I consume beer therefor I consume CO2. I pee out non-carbonated therefor I must be a carbon sink… 😎
I hereby offer to sequester one beer worth of CO2 inside my person for each dollar sent, via the expedient of drinking beer. Your carbon offsets will be sent when I sober up later… Beer may be sent directly in leu of $.
😉

Rod Smith
January 8, 2009 4:11 pm

Sunspotter (09:08:38) : A conundrum has been puzzling me lately. All these “surface stations” are elevated, and so, are in fact measuring atmospheric temp. If we really want to know what’s going on with the Earth, shouldn’t we also be measuring the temp. in the surface? At, say, a depth of 2-1/2 to 3cm? Just a thought.
The simple answer is that “surface temperature” is defined as the temperature at (as I remember) 60 inches above ground level.
Some synoptic stations report soil temperatures (or at least used to) which I always assumed are used for forecasting agricultural conditions.

Philip_B
January 8, 2009 4:31 pm

Most of New Zealand has never seen 40C temperatures. The exception is a small area of the South Island susceptible to Chinook-type winds.
The winds are caused by differences in adabatic lapse rates, which greenhouse gases have exactly zero effect on.

George E. Smith
January 8, 2009 4:54 pm

“” Philip_B (14:26:24) :
Two Australians killed by advancing glacier.
http://www.news.com.au/story/0,27574,24890577-38196,00.html
Had they been killed by a retreating glacier, doubtless Global Warming would have been blamed.
A vertical or overhanging terminus, which is what killed these 2 unfortunate young men, is characteristic of a rapidly advancing glacier. “”
Christmas of 2006, I took my family to NZ, mostly to tour the South Island very quickly, and we visited both the Fox, and the Franz Joseph Glaciers; which currently are advancing, but over the longer haul have retreated quite a bit. Well they come down to sea level at somewhere from -45 to -50 latitude; so what do you expect.
There were Danger Keep out signs at least 1/4 mile below the terminus which was quite overhung on both glaciers. Bits fall off (this was summertime), and sizable blocks of ice come bounding down the terminal morain which is quite sloped. So we crossed the terminus below the lowest ice blocks, and ascended on the other side canyon walls, high enough off the morain to not get hit by anything coming off the end.
This got us safely all the way to the face of the glacier, except off to the side, and with an overhanging rock cliff to stop higher altitude stuff that might come down the side.
We were thus able to take people pictures within 200 feet of the terminal face.
While we were taking such pictures; there were at least a half dozen Darwin Award contestants who were at least 100 feet inside caves that were at the bottom of the terminal face, and probably overhung by another 150 feet of tilted ice face outside the caves. Water drops falling from the very top of the glacier face landed at least 25 feet down stream of where these idiots were cavorting.
If that stuff came down on them, it would be another 50 years or more before anybody ever got another look at what was left of them.
There were guided tours that climbed up on top of the glacier for those more athletic than I am (I coulda done it; wife wouldn’t), but they climbed along rock canyon wall trails that were well clear of the glacier, till they were far above the terminal cliff.
Well the wealthy Europeans, who were down there to avoid the European winter global warming, could get a helicopter flight right to the upper reaches of the glaciers, where they might fall down a crevasse if they were lucky.
Having tried to win a Darwin award myself on at least three occasions, I can say that I am cured of those antics; and only go where the laws of physics prohibit such mayhem.

George E. Smith
January 8, 2009 5:06 pm

“” Rod Smith (16:11:57) :
Sunspotter (09:08:38) : A conundrum has been puzzling me lately. All these “surface stations” are elevated, and so, are in fact measuring atmospheric temp. If we really want to know what’s going on with the Earth, shouldn’t we also be measuring the temp. in the surface? At, say, a depth of 2-1/2 to 3cm? Just a thought.
The simple answer is that “surface temperature” is defined as the temperature at (as I remember) 60 inches above ground level.
Some synoptic stations report soil temperatures (or at least used to) which I always assumed are used for forecasting agricultural conditions. “”
Rod, I have always thought that to be strange myself.
During sunlit hours, it seems to me, that the very surface whether land or ocean, is most likely to be the hottest point in the solar path. On land it is essentially the terminus of the solar radiation, and in the ocean it is mostly deposited some metres deep but with a cooling temperature gradient below the surface.
During dark hours, the surface probably cools below the air in the bottom few feet (well that’s my guess). But the main heat sink would seem to be the very surface.
So the surface should stop the lion’s share of the incoming, and should be the highest thermal capacity source for the outgoing IR. The lower atmosphere can certainly radiate thermally, but the surface would seem to be the original source for the outgoing IR. Radiation from the atmosphere would cool the atmosphere because of its low heat capacity, and the surface would continuously resupply heat to the atmosphere as the surface cools at night.
So I find it difficult to comtemplate a thermal model of that part of the planet, without starting at the surface.
Maybe climatologists understand why they don’t do that; but I sure don’t.

hotrod
January 8, 2009 5:06 pm

Sunspotter (09:08:38) : A conundrum has been puzzling me lately. All these “surface stations” are elevated, and so, are in fact measuring atmospheric temp. If we really want to know what’s going on with the Earth, shouldn’t we also be measuring the temp. in the surface? At, say, a depth of 2-1/2 to 3cm? Just a thought.
Yes the agricultural extension agents use soil temperature data to tell farmers when to plant crops, that data is available.
Soil “earth temps” also rise other data integrity issues, the thermal behavior of the soil would be highly dependent on things like soil type (sandy, loam, saturated, dry) etc. so standardization of recording would be a night mare, especially in areas that are geothermally active, like just about every community in the Rockymountains which have the name xxxxsprings. Many are so named due to local hot springs.
A possible work around (not that it likely any time this century) would be to establish a “standard” earth surrogate like a 2 meter diameter concrete ball with the temperature int he center. That would filter out a great deal of the daily noise due to its thermal inertia.
Perhaps a better option would be to use a different metric than the raw temperature. Have any of the statistical folks here tried plotting a long term series of degree day numbers for long running stations? In the home heating and fuels industries degree day totals track very nicely with home heating energy usage and might give a different view of a long term trend. It would be reasonable to assume that if there was in fact a long term warming signal it would show up in a universal drift upwards in all stations cooling degree day numbers and a drop in heating degree day numbers.
Larry

tiny_H
January 8, 2009 5:06 pm

I just checked with one of the COOP observers around here, and they are told not to remove the snow on top of the MMTS unit… So the snow on top is correct… tiny…

Austin
January 8, 2009 5:18 pm

The McFarland event is still on schedule for next week for the US.

Tim C
January 8, 2009 5:51 pm

We have to thank the .au gov for some honesty so I am not going to brickbat.
Most sites look sensible. This one though… at least begs questions.
http://www.bom.gov.au/climate/change/map/stations/037051.shtml
GISS (RAW) shows a broken dataset and not to current, so I reckon there are in reality at least 3 sets.

davidc
January 8, 2009 6:10 pm

crosspatch (14:30:51) :
““The IPCC projections tell us that this is happening now, is continuing and will be catastrophic.”
Uhm, no. None of the IPCC projections have come true and not a single thing they have projected have come to pass. Not one thing.””
I am agreeing with that but I’m suggesting that people take seriously local temperature records to make up their own minds. The IPCC says that’s wrong, that you can’t conclude anything about a global temperature from your own local experience. One reason for them saying that is that it allows them to “control” the reported global temperature, not just by adjustments but with the weighting factors that need to be used to aggregate the local measurements into a global value (I don’t know how they do this, but it doesn’t make sense to just add the local temperatures and divide by the number of sites). What I’m saying is that if the IPCC are taken at face value, and “warming is global” then that claim is testable by an observation of a trend at any position on the globe, such as where you live. Of course, the IPCC says that what an individual observes is (global warming)+(local variation) and that their average is needed to cancel out all the unknown local variation. But if eveyone made their own observations and reached a collective opinion (say, by posting here, or by voting) then the local variations could be dealt with without the help of the IPCC algorithms.

Les Francis
January 8, 2009 6:30 pm

George E. Smith (15:04:00) :
“” the_Butcher (23:37:32) :
New Zealand is burning at the moment with temperatures of +40C + “”
New Zealand has the same problem that Australia has; they are both on the crusty side of the pizza; and just when we are having good skiing weather in Colorado; the Kiwis and Aussies decide it is time to go to the beach.
So don’t worry about it; in a few months, when we set fire to California again, you Mates down there can go skiing; well the Kiwis can; the Aussies don’t have any mountains; so they have to go skiing with the the man in the gray suit in Sydney Harbor.

George, here in Melbourne Australia at 1325 in the afternoon its 18C. Last week it snowed in the mainland southern mountains and in Tasmania.
mind you yesterday the top temperature in Melbourne was 18C while in the Gascoigne in northern Western Australia it was around 46C.
Australia’s mainland is roughly the same size as the lower 48.
There was a Australian Newscom report a couple of days ago that trumpeted Australia was in the grip of a heatwave. This was widely picked up in the world wide media. The truth was a lot different. Distortions and cheery picked temperature reports were used in that press release. All part of the Australian MSM daily dose of alarmism. The report was hammered in the local blogs.

freespeech
January 8, 2009 7:39 pm

Tamino is currently running a thread where he depicts fictitious data analysts cherry picking start/end points against a visually observable temperature trend and coming out with the wrong trendline. With this he hopes to discredit all who are skeptical of AGW. I pointed out that his fictitious data analysts may have been clever enough to note that the data points at the beginning of the series were not the same as the data points at the end of the series, that 2/3rds were no longer being collected and that they were predominantly from the side of the graph that would oppose the “visually observable” trend. Hence his data collectors would have been correct to point out that any trend from the data is unsafe, and if sensible corrections were made, the trend could indeed be the opposite of the poorly chosen data.
Needless to say, this bastion of the supposed scientific method deleted the post.
Perhaps it could be nominated as the best religion blog, since it seems it can’t brook any dissent, even when that dissent is based upon sensible scientific argument.

crosspatch
January 8, 2009 7:52 pm

“The IPCC says that’s wrong, that you can’t conclude anything about a global temperature from your own local experience”
While I would generally agree with that, there are a few other things to consider. I wouldn’t say one cold winter would mean much. But what that graph is showing is an annual average. Even one cold year wouldn’t mean all that much by itself, but here we have several consecutive years. If CO2 were driving climate warming at the rate supposed by Hansen et al, this would be an absolute impossibility. And while you could have warm year followed by a less warm year, to see *global* temperatures go *below* the long term average as we did earlier this year would be an absolute impossibility.
The point is that the climate response to CO2 is grossly overstated by IPCC’s projections and GISS’s models. CO2 is not causing any dangerous warming.
If we are going to spend billions of dollars in carbon mitigation, the onus is on the IPCC and GISS to show that there is even a reason for doing that. First they need to show that the climate is warming. Only their *models* say that it *should*. Direct observation shows that it isn’t. This means the model is incorrect and can not be used as a basis for spending even a penny. Climate were warming we could get into causes but it isn’t so there really is no need to even go there.
The onus isn’t on us to prove something isn’t happening. The onus is on IPCC to show that something *is* happening. So far we know that current temperatures are not unprecedented in this interglacial. We also know that the rate of temperature rise in the 20th century wasn’t unprecedented either. The 18th century saw much faster and greater climate change as we began the recover from the Little Ice Age than the 20th century saw as that recovery completed. We also know that the greatest amount of climate change in the 20th century was not in the second half of the century, but in the first half. The majority of years in the second half of the century saw cooling, not warming temperatures, globally.
Here is an important thing to consider. The chairman if the IPCC speaks two different messages depending on to whom he is speaking. When he speaks to the world he says global warming is horrible and the developed countries need to cut emissions. When he speaks to India, he says that warming will not be an issue. When developed countries mention that countries like India are the fastest growing source of CO2, he says that any mitigation efforts in India must be paid for by developed countries and any decrease in efficiency must be offset by payments made by the developed countries.
Basically they are using “global warming” as a mechanism for redistribution of wealth. Developed countries must put the breaks on economic growth while India, China and Brazil are allowed unbridled growth. Note that GDP is directly proportional to energy consumption with some wiggle room for changes in efficiency. Each increase in real GDP results in an increase in energy consumption. One can not produce something without consuming energy. Even if you are picking walnuts, you expend more energy when you pick more walnuts, use more fuel to transport them, etc. So if you can throttle energy consumption you can throttle economic growth.
The mechanism works like this. First you oppose nuclear power development in developed countries with all available resources at your disposal. This forces everyone into fossil fuel. Now you limit emissions from fossil fuel. CO2 and water vapor are the product of complete combustion of hydrocarbon. If you limit CO2 emissions, you are actually limiting economic growth. At the same time you offer no barriers to nuclear power deployment in China, India, and Brazil and you exempt them from CO2 emissions requirements. In other words, you put the brakes on developed economies and allow developing economies to ramp up full-tilt.
You make this more palatable to many in the developed countries by pretending such things as wind and solar are actually viable alternatives. The reality is that money poured into these “alternatives” actually add inefficiency and result in a more expensive and intermittent source of power that actually acts to further hamstring the economies of those who adopt them. These technolgies DO have their niche. They make sense in such places as remote areas where the grid does not reach or for small power purposes but as base load generation, they act as a rat hole into which more and more money is poured creating even more inefficiency. You end up with less power generated at higher cost and the supply is unreliable further hamstringing economic expansion in developed countries.
It is all about “spreading the wealth” in a very clever way.

Mike Bryant
January 8, 2009 8:18 pm

I’m pretty sure that the cooling that was happening in 1998 was being masked, and it was also hiding. I guess that whatever mask it had on is now being borrowed by the heat, and obviously that heat is now hiding wherever the cooling was hiding in 1998.
Or… maybe the earth just gets warmer and cooler… Nahhhhhh

Wondering Aloud
January 8, 2009 8:22 pm

Dismissing the importance of looking at the quality of the individual stations is a big mistake. The USHCN network was long referred to as the “gold standard” for temperature records. Now with 60% surveyed a significant majority are in category 4 and 5 which means they have a likely bias larger than the entire warming signal claimed for the last century +
While the project is not done,what the results so far strongly suggest is we may not even be able to elimanate the null hypothesis on temperature change. In other words we may not even be able to say with certainty that the observed waming of the 20th century isn’t entirely due to these various errors in the placement and maintenance of the various stations.
In addition the large number of sights that are changed in position, instumentation or just dropped off the list makes any talk of a trend less certain. I now understand what he meant when Richard Balling referred to it as perhaps a “figment of the data”.

ozzieaardvark
January 8, 2009 9:33 pm

Is anyone else as amused as I am by the comments regarding snow on top of a screen causing site bias? Do these folks make similar comments about A/C exhausts, airport tarmacs and BBQ grills? Just askin’. 🙂
OA

January 9, 2009 1:59 am

Crosspatch said
“The IPCC says that’s wrong, that you can’t conclude anything about a global temperature from your own local experience”
Can I remind WUWT bloggers that I am collecting links to national and regional temperature records-the longer the better.
Whilst observations from one country on a single day are merely interesting those from lots of different places over many years has considerable signficance. Links please
We already have;
Hadley CET to 1660
Armagh
Central Europe
Switzerland to 1860
44 stations in Germany
Finland
Russia
Holland
Denmark Faroe Greenland.
I will post these up as a general resource in due course.
This is in reaction to the oft quoted ‘global temperatures since 1850’ which are continually changing in location/equipment/methodology and started off in 1850 with 100 stations, many of them described as ‘unreliable’ Callendar based his 1938 seminal co2 document on observations from 200 stations.
This composite ‘1850’ data set is therefore best viewed as an interesting historical curio rather than a scientific data set on which the future of the worlds economy should be based.
I have lots of my own disjointed information on ‘1850’ but if anyone has any links to a existing succinct explanation of the number of stations in each year, their location, changes etc etc I would be pleased to include it.
TonyB

Jeff Alberts
January 9, 2009 6:15 am

“The IPCC says that’s wrong, that you can’t conclude anything about a global temperature from your own local experience”

Yet they take a bunch of local temperatures and claim “global” warming.

Tim Clark
January 9, 2009 7:57 am

JFrom the NOAA report above:
The Central and Southern regions experienced below-average temperatures, while above-average temperatures were felt in the West, Southwest and Northeast. This resulted in a near average annual temperature for the contiguous U.S. and the coolest annual temperature since 1997.
For 2008, the average temperature of 53.0 degrees F was 0.2 degree above the 20th Century average.
The nation’s January-December average temperature has increased at a rate of 0.12 degree F per decade since 1895, and at a faster rate of 0.41 degree F per decade during the last 50 years.

Lots of great headlines there. Pick the one that furthers your agenda.
For example:
Global Warming to impact Northeast U.S. the most, climate scientist said today………
My favorite:
Increasing precipitation combined with stable temperatures will lead to enormous increases in US crop production in the 21st century, says a discredited Kansas agronomist……

January 9, 2009 11:33 am

Tim Clark: “…my favorite:Increasing precipitation combined with stable temperatures will lead to enormous increases in US crop production in the 21st century, says a discredited Kansas agronomist”
Carole King prophetic “Tapestry”:
“In times of deepest darkness, I’ve seen him (Al Gore?) dressed in black
Now my tapestry’s unravelling; he’s come to take me back
He’s came to take me back”

davidc
January 9, 2009 12:34 pm

crosspatch (19:52:55) :
“Even one cold year wouldn’t mean all that much by itself, but here we have several consecutive years. If CO2 were driving climate warming at the rate supposed by Hansen et al, this would be an absolute impossibility.”
Expressing things in terms of CO2 is an alternative to my point, but maybe better. Local variations in CO2 do occur but from what I’ve seen these are much less than the overall increase. So it’s a reasonable approximation to say that the change in CO2 with time is pretty much the same everywhere (certainly the IPCC assumes that, so if we want to test their predictions we can take on their assumptions; if they say this is seriously wrong, then it follows that their predictions [projections] are seriously wrong). So if we take a local observation to be made up of (anthropogenic global warming [CO2])+(local variation [not CO2]) then whenever we see a decrease in local temperature we know that LV dominates AGW (because AGW, if it’s there, relentlessly goes up). This would mean very little over short time intervals but this is easy to understand locally (eg cooler at night but then warms up the next day; cooler as a cloud blocks the sun but warmer again when it passes). But over a period like 10 years there is no possibility of confusing the overall trend with this kind of transient event.
On your other points, I agree as far as they go but I think there’s more. There are many agendas here. Big Green, of course, but also the media. Yes, Fear is good for business but only up to a point. When nothing actually happens don’t they start to look ridiculous? (Which is bad for business, no?)

January 9, 2009 12:44 pm

Please take a moment to cast your vote for this great site: click
Many thanks!

January 9, 2009 1:47 pm

Pharyngula is approaching!

davidc
January 9, 2009 2:03 pm

TonyB (01:59:11) :
That looks like a good project. I’ve looked at Armagh as a good site for getting a handle on a fairly wide area. As I understand it the temperature there is largely determined by the Gulf Stream so if there were significant variations in conditions along the length of the Gulf Stream they should show up in Armagh. Another place like that is the coast of Namibia which gets a cold current from the Antarctic. A modest collection of sites like that could give a much better picture than the IPCC global average. Assuming that calculating the temperature anomaly cancels out local variations a statistical model could be deltaT(i) = deltaG + e(i) taken as individual observations (i) to test the hypothesis deltaG = 0 etc. Maybe worth doing a power calculation to see how many sites are needed.

Editor
January 9, 2009 2:24 pm

I’ve been hearing from several people that local temps are far below what the national climate data aggregators are claiming for their local areas. There’s also some observably false data in a number of temperature maps. For instance, CA spotted a major ocean anomaly around the Georgia islands in the south atlantic showing a 20C higher temps than actual satellite data is showing.
Apparently when weather stations stop reporting data, or their equipment is down, or, say, INSIDE A HEATED BUILDING BEING REPAIRED, the data is still being collected and the AGW folks are taking the peaks as the standard. Since we know Mann’s hockey stick is based upon amplifying the peaks rather than centering as any self respecting scientist would, its clear that the usual suspects are intentionally accepting the high outliers as the ‘correct’ data.

crosspatch
January 9, 2009 2:49 pm

“Can I remind WUWT bloggers that I am collecting links to national and regional temperature records-the longer the better.”
Here’s one for the Southeastern US that goes back into the 19th century for many stations. Select the state, select the station, and on the left frame are lots of things to choose from. “Monthly Temperature Listings” will get you averages back to the start for that station.

January 9, 2009 4:19 pm

davidc
Interesting post-it would be great to get some African data sets- particularly a place like Namibia in order to get the effects of the current.
Also thanks to Crosspatch.
Any more from anyone? I am also still looking for a definitive aricle that has dissected the realities of ‘global temperatures since 1850’ Someone must have done a thorough study of this subject-it is absolutely key to ‘proving’ AGW
TonyB

Dodgy Geezer
January 9, 2009 5:24 pm

ak (05:31:09) :
@Anthony, i came here looking for good counterpoints to my own belief – that humans are affecting our environment, and one consequence of that will be warming of the earth. i believe that good arguments can be made.
ak, there have been a number of responses to various aspects of your post, but none seem to have pointed out the one bit I have most concern about.
You say that you have a ‘belief’ that humans are warming the earth, and that ‘good arguments can be made’ for this. ( I assume you are talking about Global Warming – everybody agrees that Urban Heat Islands are a good example of anthropic effects on the small scale)
This blog, and its compatriot Climate Audit, are NOT about beliefs, and finding good arguments to support them. They are about doing science properly. Steve McIntyre, for example, has always said that he holds NO position about AGW, in spite of what you might think. And I am sure that Anthony, similarly, will be happy to accept that the planet is undergoing unusual warming if the unbiased data shows this.
What is happening here is Popperian falsifiability. We are looking critically at the AGW data to confirm that it is correct and make it stronger. But, unfortunately, it is failing many of the tests. Steve and Anthony have a lot of things they might prefer to be doing with their lives, but both of them think that getting the science right is the most useful thing they can do for humanity just now.
and i may post snark when i feel it’s warranted. 🙂
I am sure none of us minds ‘snark’ being posted (unlike RC!), but please make it useful. Tell us WHY some of the odd ‘adjustments’ are justified. Point out the stats that indicate that there will be 5% of stations like Cold Creek even with a strong warming trend. But don’t look for arguments to support a belief. That’s not science, it’s religion…

crosspatch
January 9, 2009 5:30 pm

TonyB,
This book might also interest you:
Surface Temperature Reconstructions for the Last 2,000 Years
I have only skimmed through it (one can read the whole thing online if you wish). There is actually a statistician who was a member of the committee as well as people with credentials in meteorology and geology.

davidc
January 9, 2009 9:33 pm

TonyB (16:19:11) :
I’m sure you wont be able to get Namibia back to 1850 but you might for Cape Point in SA. Long term British influence there and of naval importance. I’ve looked at the SA weather bureau but if it is available it seems you have to subscribe.

crosspatch
January 10, 2009 12:05 am

Namibia would have been German South West Africa (Deutsch-Südwestafrika) after 1884. Germany would have been responsible for any records prior to the end of World War I and after the German surrender, South Africa was given the League of Nations mandate.
So if you want to go back to 1850, about the only records you are likely to find are going to be reports from ships and missionaries. After 1884 you might find some stuff in German archives until WWI. South Africa after.

Richard Keen
January 10, 2009 12:30 am

Hi all,
First, I’m awe-struck that there have been over 150 comments about my data!
I’ll copy some of the comments and add my comments…
Tim F (20:29:34) :
This is a great article–many thanks to Dr. Keen. In the interest of forwarding citizen science could anyone post how the yearly average is calculated for a station. Is it simply the arithmetic mean of the daily average/365? How many readings are sufficient for a daily average?
Reply: A co-op observer reads the 24-hour max and min once a day (at 9 pm, in my case). The daily average is simply the average of the max and min for each day, and the yearly average is the mean of the 365 (or 366) days.
The co-op network has thousands of citizen scientists, and I’m delighted to be one of them.
Sean Ogilvie (20:43:21) :
Writing from Georgia, it looks positively balmy out there!
Question: Is it policy to remove the snow? I would think that it would make a difference.
Reply: when my son took that picture, it was 50 degrees warmer than the all-time min of -36 in Feb. 1989. No, the snow stays put. Most of the time it blows off, however. Since the snow is sitting atop an already efficient double roof, I don’t think it affects the screen temperature very much. If it warms up suddenly and there’s a mass of 32-degree snow on top while the air temperature is, say, 50 degrees, there could be a refrigeration effect. But that would most likely occur on a sunny day, in which case a bigger effect would be reflected sunlight (from the snow covered ground) filtering into the box and raising the temperature. I suspect this can amount to a degree or more sometimes.
Another effect of the deep snow is to raise the effective ground level closer to the thermometer. However, the local terrain is sloping, which prevents sharp inversions from forming, so the changing ground level won’t be as critical as it might be in a flat, level location with more shallow inversions.
An extreme case occurred in March, 2003, when a 72-inch storm raised the effective ground level to ABOVE the thermometers! But that is rare, of course (otherwise we’d have glaciers!), and typical snow cover in winter is usually 6 inches or so.
Gary Palmgren (06:17:38) :
I see there are trees close the the thermometers. I’ve always wondered about the proper siting for the temperature gauges in a forested region. Shouldn’t they be located in the forest? The site rating for this post is irrelevant as it was stable over the last 10 years with no artificial heat sources.
It’s kind of hard to keep the thermometer clear of snow when it snows a foot overnight. Would you use heater to keep it snow free? 😉
Chris D. (06:31:41) :
Dr. Keen or Anthony,
I didn’t find Coal Creek in the Surfacestations gallery (nor a placeholder). Would this station qualify for inclusion in the gallery (record of sufficient duration)? Also, how free of microsite bias would you say this station is, and has been, over the duration of the record? I see it’s on a slope, but assume that’s fairly representative of the general area. Thanks for the post!
REPLY: It is not a USHCN station, simply a COOP station. The reason it is not USHCN is duration of record. – Anthony
Reply: Some of you have noted the trees, and indeed, there is partial shade on the shelters at times. The vegetation coverage is representative of the general area (Colorado foothills, with lodgepole pines broken by meadows). It would be impossible to find a location that fits Tony’s ideal – a 2-degree horizon doesn’t exist in the Rockies! That criterion would be as unnatural as, say, a short-cut grass surface in Antarctica! I think a more important criterion, and one which the NWS tries its best to fulfill, is to have an observer who is conscientious, consistent, will keep observing for a long time, and who believes missing data is a sin. I actually started observations 25 years ago, but became a co-op station in 1993.
Jim B in Canada (22:12:08) :
The people who frequent Wattsupwiththat, climateaudit, climatesci.org are proud to be called Dorks, Nerds, and Geeks, because we breath the minutiae of science, because in the end, that’s where all real science is done.
Reply: Right on! As Yogi Berra said, “You can observe a lot by just watching”. I like to think that 200 years from now, some future geek will look at my data – and everyone else’s – to discover some great truth about our world. Just like today’s geeks look at data taken 200 years ago by Franklin, Jefferson, et al.
robert gregg (22:33:07) :
I am surprised he has a 4″ plastic precip gauge instead of a
Standard 8″ gauge. With that much snow it seems his readings for total precip may be too low.
Reply: The 8-inch gauge was inside the house at the time, its contents melting for measurement. I also have a 4-inch gauge, several small wedge gauges, and a heated tipping bucket. As I said, missing data is a sin, so I don’t rely on just one gauge. There’s also several backup thermometers in the box.
Michelle (02:28:45) :
Cooling at “Coal Creek”? I assume then that all that nasty black coal at Coal Creek has been left in the ground, otherwise there is no way there would be cooling there?
Reply: Actually, it’s “Coal Creek Canyon”, SW of Boulder and NW of Golden. “Coal Creek” is in SW Colorado, over a hundred miles away. Mail has been misdirected more than once. The local geology is granite. The coal that the creek is named after is out on the plains, after the creek leaves the foothills on its way to the South Platte River.
CookevilleWeatherGuy (03:46:04) :
When the snowfall is WAIST DEEP, I’ll give the guy a break on some snow accumulating on top of the instrument ’shacks’….
Reply: Thanks for the break. When you’re up to your a** in alligators….
Sullivan (07:50:41) :
Obviously Dr. Keen is not much of a scientist. We all now know that real scientists work with corrected data and not the stuff actually observed. Any high school chemistry student knows – you have to screw around with the data to get the result the teacher wants.
Dr. Keen – Did you pass high chemistry?
/sarcasm
Reply: I can smooth, adjust, blend, and homogenize data as well as the best of them! I actually enjoy doing it – it’s relaxing! But this time I sent out the data before playing with it.
I did pass HS chemistry, but it was easier then – only 4 or 5 known elements, including sulfur and carbon, the favorites of high school alchemists.
George E. Smith (14:49:37) :
Dr Keen,
Where abouts is your barbecue, under all that “partly cloudy” ?
It looks like you have a nice job though. Should we send someone to dig you out; or can you hold your own for a while?
George
Reply: the BBQ is on the other side of the house, and, needless to say, there is no AC (except for the natural kind). Please don’t dig me out; I love being stuck here and unable to go to work (I teach at the U of Colorado). The fridge is full; I can last for years!
REPLY: Insignificant in your view, which apparently is only global. We however don’t view individual or regional issues as insignificant as they make up the whole record, and individual examination of these stations is what we do. If you don’t like it, then please don’t dwell here simply to cast snark. – Anthony
Reply: Among other classes, I teach one about weather and climate data. “Watts Up With That?” and “Surfacestations.org” have been absolutely fabulous resources. I’ve pulled many an example of how to – and how not to – make observations from these sites. Thanks Anthony!

Roger Sowell
January 10, 2009 12:37 am

Dodgy Geezer — kudos, and mega-dittos!
I would add, although I am not a scientist rather an engineer turned attorney, that beyond getting the data right, some other things must be right before any of this is believable. Or, as we say, passes the laugh test.
As examples, basic physics cannot be violated: no matter (mass) can be created nor destroyed (we are not having nuclear reactions in GW), there must be conservation of mass and energy in calculations, second law of thermodynamics obeyed, and some others. I get particularly irritated when arguments are made that *the energy just disappeared* and such. Basics of chemistry also cannot be violated, such as gas solubilities in liquids, reaction mechanisms and equilibrium considerations and temperature-sensitive reaction rates.
Engineers are sometimes disparaged in these discussions, but fundamentals are not to be violated with impunity. The fundamentals have served not only me, but countless others very well over our long careers. Screw ups occur when someone forgets to check their results against the basics.
We do have our missing-data issues in engineering, and we deal with that in various ways, including data reconciliation algorithms. I wrote more than one of those in my career, and sometimes we incorporate artificial intelligence techniques coupled with appropriate models. But the model that uses that reconciled data had better match the real world, or there is hell to pay.
So, I welcome each day with reading WUWT and a few others.
Roger E. Sowell
Marina del Rey, California

Roger Knights
January 10, 2009 2:59 am

Crosspatch wrote:
“Also, greenhouse warming should raise average temperatures by decreasing nighttime lows.”
I think he meant “increasing nighttime lows.”

crosspatch
January 10, 2009 3:22 pm

Roger Knights:
I did indeed mean “increasing nighttime lows”.
Basically greenhouse warming would make record low temperatures more rare and record high temperatures more frequent. In fact, from looking at the IPCC projections from around a decade ago, it would seem that the current amount of accumulated warming projected by them would make record low temperatures very, very rare and it would be impossible for an annual global average temperature to be as low as they were *before* the projections were released.
If you buy their notion that CO2 is the primary climate driver and that solar variation has little to nearly no impact, what can explain the disappearance of all of that heat without any major volcanic activity over the past 20 years? According to their models, the situation we are in would be impossible. Again, their models say that our current global average annual temperature would be an impossible situation. So either I have suddenly shifted to an alternative universe or their models are wrong. One of those possibilities has a much greater probability of being true than the other.
This image and this image pretty much say all there is to say. The first one is the IPCC predicted trends with range and the second shows CO2 change vs. global temperature since 2002.
Anyone who still “believes in” global warming after looking at those presentations of the observed data is basically living in a fantasy land. The observation could simply not happen if the models are correct.

crosspatch
January 10, 2009 3:23 pm

Oops, meant to say “The first one is the IPCC predicted trends with range compared to the observed global average temperatures over the same time period”

Ron de Haan
January 10, 2009 5:13 pm

More reality checks on climate data:
Look at an animation of disappearing stations
http://climate.geog.udel.edu/~climate/html_pages/Ghcn2_images/air_loc.mpg
And the article:
Jan 09, 2009
2008 Coldest Year Since 2000 and Clearly Not a Top Ten Warmest Year
By Joseph D’Aleo, CCM, AMS Fellow at http://www.icecap.us

George E. Smith
January 12, 2009 3:16 pm

Dr Keen,
Thanks for letting us look in on your operation, and for providing us with some insight into your work. It would seem that at least some students in Colorado are getting some good science training.
If I was aloud to ship across State Lines, I would send you a case of Newcastle Brown ale to add to your carbonated beverages maintenace supplies.
George

Eyas
January 13, 2009 10:15 am

Has anyone wondered or worried about the reliability of temperature records between 1860 and 1940?
What is the source of these records?
And, for example, HOW can data from less than 16% of the globe be used to determine a “Global” average temperature?
Is anyone the least bit curious about this?

January 13, 2009 4:02 pm

Eyas
I have been posting about this on a variety of threads for some time. Global temperatures since 1850 are a nonsense, as the number of stations started at only 100 in 1850-many of them unreliable. Numbers remained small and unrepresentative until 50 years ago -then suddenly halved in the eighties when the Soviet Union collapsed and with it funding for its weather stations. Many of the cold rural ones subsequently disappeared, fundamentally affecting average temperatures.
I am collecting reliable national records as an antidote to the pot pourri of global readings -the longer the better-so if you come across a link please post it so I can add it to my collection which I will publish as a resource for others to use.
TonyB

Stafford
January 14, 2009 4:32 pm

Never attack peoples religion.
You could be burned.
My Pear Trees and my neighbors Peach trees have only had one crop since 2003 because of the frost killing any blooms that tried to make it. My trees say its colder. I guess I’ll have to burn them.
Hillsboro Kansas

Walter Marciniak
February 19, 2009 8:12 am

ak,
“everyone” DOESN’T know that humans are causing global warming. Everyone with an agenda does.
I live at the top of Coal Creek Canyon. I had to shovel 7 feet of snow in March ’03 and would have appreciated some global warming.