Guest Post by Bob Tisdale
UPDATE: Corrected the percentage of ocean heat loss though evaporation. Update 2: Added a link to a post by Willis Eschenbach at the end, and corrected a typo.
# # #
Ocean heat content and vertically averaged temperature data for the oceans have been the subjects of a couple of recent blog posts. As one might expect, the discussions on those threads tend to shift to the subject of whether or not the infrared (longwave) radiation from manmade greenhouse gases can cause any measureable ocean warming at the surface or at depth. According to the hypothesis of human-induced global warming, the warming of the global oceans to depth and the related ocean heat uptake are a function of the radiative imbalance caused by manmade greenhouse gases. There are a number of arguments for and against the hypothetical anthropogenic warming of the oceans.
So the topic of this post is ocean warming. I’ll present different opinions/arguments on anthropogenic ocean warming.
For a detailed overview of ocean heat content data, please see the post Is Ocean Heat Content Data All It’s Stacked Up to Be? And see the post AMAZING: The IPCC May Have Provided Realistic Presentations of Ocean Heat Content Source Data for another discussion by the IPCC.
INFRARED RADIATION CAN ONLY PENETRATE THE TOP FEW MILLIMETERS OF THE OCEAN SURFACE AND THAT’S WHERE EVAPORATION TAKES PLACE
It is often argued that infrared radiation from manmade greenhouse gases can only penetrate the top few millimeters of the ocean surface and that’s where evaporation occurs. That argument then continues that additional infrared radiation from anthropogenic greenhouse gases can only add to surface evaporation, and cannot heat the oceans. On the other hand, sunlight reaches into the oceans to depths of 100 meters or so, though most of it is absorbed in the top 10 meters. Even so, sunlight’s ability to warm the oceans is many orders of magnitude greater than infrared radiation. One of my earliest memories of this argument came from Robert E. Stevenson’s (Oceanographer Scripps) 2000 article Yes, the Ocean Has Warmed; No, It’s Not ‘Global Warming’. In April of this year, looking for solid answers on this topic, Roy Spencer presented the same arguments and a few counter arguments in his post, Can Infrared Radiation Warm a Water Body?
Field tests reported in the 2006 post Why greenhouse gases warm the oceans at RealClimate are often cited by those who believe infrared radiation is responsible for ocean warming. That guest post by Peter Minnett of the University of Miami includes:
However, some have insisted that there is a paradox here – how can a forcing driven by longwave absorption and emission impact the ocean below since the infrared radiation does not penetrate more than a few micrometers into the ocean?
So this argument was considered by climate scientists. The post then goes on to describe why it’s not an inconsistency and then to present the results of field tests. My Figure 1 is Figure 2 from that RealClimate post.

Figure 1 – The change in the skin temperature to bulk temperature difference as a function of the net longwave [infrared] radiation.
The summary text for the illustration at RealClimate reads:
There is an associated reduction in the difference between the 5 cm and the skin temperatures. The slope of the relationship is 0.002ºK (W/m2)-1. Of course the range of net infrared forcing caused by changing cloud conditions (~100W/m2) is much greater than that caused by increasing levels of greenhouse gases (e.g. doubling pre-industrial CO2 levels will increase the net forcing by ~4W/m2), but the objective of this exercise was to demonstrate a relationship.
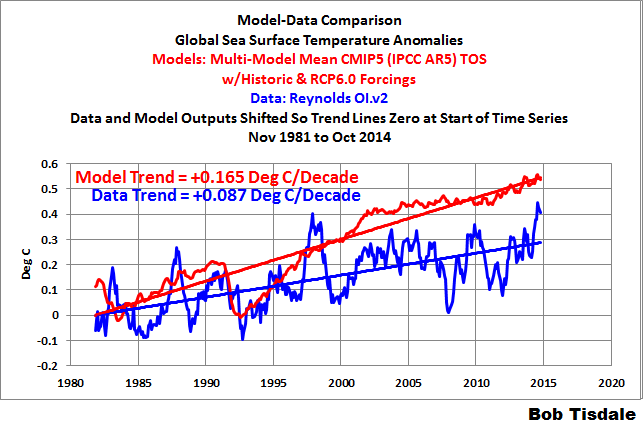
That, however, creates a counter argument that has been discussed by others. See the HockeySchtick post RealClimate admits doubling CO2 could only heat the oceans 0.002ºC at most. Let me put this into more recent terms. According to the NOAA Annual Greenhouse Gas Index, infrared radiation has only increased about 1.2 watts/meter^2 from 1979 to 2013. Based on the findings at RealClimate, that rise in infrared radiation could only warm the sea surfaces by a little more than 0.002 deg C since 1979. Yet, looking at the global sea surface temperature data, Figure 2, the surfaces of the global oceans warmed more than 0.3 deg C from 1979 to 2013, leaving about 93% 99.3% of the ocean surface warming unexplained.

Figure 2
A continuation of the Minnett-field-test argument is that manmade greenhouse gases and ocean mixing will cause the warming of the mixed layer of the oceans. The HockeySchtick counter could be applicable here as well. The mixed layer ranges in depth from about 20 to 200 meters. Unfortunately, temperature data specifically for the mixed layer are not available in an easy-to-use format, so let’s assume that the NODC’s vertically averaged temperature data for the depths of 0-100 meters captures the vast majority of the mixed layer. As shown in Figure 2, the warming rate of the top 100 meters of the ocean is slightly less than the surface. In other words, the warming rate based on the field tests presented by RealClimate can’t explain the vast majority of the warming of the top 100 meters.
Further to the RealClimate post by Peter Minnett, see the very recent ClimateConversation post HotWhopper wrong on ocean heat. It includes links to a three part discussion titled “Anthropogenic Ocean Warming?” by Richard Cummings, which covers the Minnett findings and other proposed mechanisms of anthropogenic warming of the oceans:
- Part 1: Skeptical Science Offside
- Part 2: The Improbable IPCC Mechanism
- Part 3: Rahmstorf, Schmittner and Nuccitelli
“AIR-SEA FLUXES ARE THE PRIMARY MECHANISM BY WHICH THE OCEANS ARE EXPECTED TO RESPOND TO EXTERNALLY FORCED ANTHROPOGENIC AND NATURAL VOLCANIC INFLUENCES”
The quote in the heading is from Chapter 10 (WG1) of the IPCC’s 5th Assessment Report.
Richard Cummings comments from Part 2 of his series begins:
That’s it. 25 years and five assessment reports after its 1988 formation, the IPCC has not been able to firm up an anthropogenic ocean heating and thermal sea level rise mechanism. The one they have come up with is only “expected”, indicating that they are unable to cite studies of the real-world phenomenon of non-solar air => sea energy fluxes actually occurring on a scale that would explain 20th century ocean heat accumulation in the order of 18×10^22 J and subjugate a solar-only mechanism.
“…HEAT PENETRATES THE OCEANS FASTER IN A WARMER CLIMATE”
The heading is a quote from the concluding remarks by Stefan Rahmstorf in the RealClimate post Sea-level rise: Where we stand at the start of 2013 (my boldface).
My bottom line: The rate of sea-level rise was very low in the centuries preceding the 20th, very likely well below 1 mm/yr in the longer run. In the 20th Century the rate increased, but not linearly due to the non-linear time evolution of global temperature. The diagnosis is complicated by spurious variability due to undersampling, but in all 20th C time series that attempt to properly area-average, the most recent rates of rise are the highest on record. At the end of the 20th and beginning of the 21st Century the rate had reached 3 mm/year, a rather reliable rate measured by satellites. This increase in the rate of sea-level rise is a logical consequence of global warming, since ice melts faster and heat penetrates faster into the oceans in a warmer climate.
Is this a very simplified rewording of the argument that, although the atmosphere is cooler than the ocean surfaces, greenhouse gases will reduce the rate at which oceans can release heat to the atmosphere?
See Richard Cummings response in Part 3 of his series.
MECHANISMS FOR THE WARMING OF THE OCEANS
Donald Rapp presented a simple model to explain how manmade greenhouse gases could warm the oceans in his guest post at Judith Curry’s blog ClimateEtc, back in May 2014. See his post Mechanisms for the Warming of the Oceans. That post drew more than 400 comments. If you’re going to cut and paste one of your or someone else’s comments from that thread, please leave a hyperlink to it.
INFRARED RADIATION FROM MANMADE GREENHOUSE GASES HAS INCREASED SINCE 1979, WHILE TOTAL SOLAR IRRADIANCE HAS DECREASED. THEREFORE, INFRARED RADIATION CAUSED THE OCEAN WARMING.
This is one of the favorite arguments for anthropogenic warming of the oceans: Infrared radiation has increased since 1979 but total solar irradiance at the top of the atmosphere has decreased. Therefore, according to that ill-conceived argument, the sun can’t explain the warming.
Why is it ill-conceived? We’re interested in the amount of sunlight reaching the ocean surfaces and entering into them, not the amount of sunlight reaching the top of the atmosphere.
There is evidence the amount of sunlight reaching Earth’s surface increased from 1979 to 2013. It comes from a specialized climate model called a reanalysis, and the reanalysis being discussed is the NCEP-DOE R-2. Unlike the climate models used to hindcast and predict global warming, a reanalysis uses data (sea surface temperature data, cloud cover data, aerosol data, total solar irradiance data, and the like) as inputs and calculates variables that aren’t measured directly. It’s a climate model, so we still have to look at it with a skeptical eye, but even so, the sunlight reaching the surface of the Earth increased from 1979 to 2013, according to the NCEP-DOE R-2 reanalysis. See Figure 3.

Figure 3
I’ve added a note to the graph:
Above what value do the oceans accumulate heat?
That was to counter another ill-conceived argument. Someone might look at the graph and see that sunlight at the surface peaked around the year 2002 and has since dropped, expecting the oceans to lose heat during the decline. But that argument would fail to consider many things, including the one noted.
This also brings to mind something written by Carl-Gustaf Rossby in 1959. It is part of the opening chapter of the book The Atmosphere and Sea in Motion edited by Bert Bolin. That chapter is titled “Current problems in meteorology”. In it, Rossby made two suggestions while discussing ocean processes (my boldface):
a) The assumption that our planet as a whole stands in firm radiation balance with outer space cannot be accepted without reservations, even if periods of several decades are taken into account.
b) Anomalies in heat probably can be stored and temporarily isolated in the sea and after periods of the order of a few decades to a few centuries again influence the heat and water-vapour exchange with the atmosphere.
So, assuming the NCEP-DOE R2 reanalysis is correct, how long would the recent increase in the amount of sunlight entering the oceans impact climate? According to Rossby, it could be decades or centuries.
Something else to consider: according to the NODC’s vertically averaged temperature data to depths of 2000 meters, the North Atlantic and the Pacific Ocean show little to no warming since 2005. The other two ocean basins, the South Atlantic and Indian Oceans are showing warming, but they only cover about 1/3 of the ocean surface. See Figure 4.

Figure 4
That lack of warming to depths of 2000 meters for two ocean basins that cover 2/3 of the ocean surface (North Atlantic and Pacific) is hard to reconcile in a world where greenhouse gases are said to be well mixed, meaning they’re pretty well evenly distributed around the globe.
THE OCEANS HAVE THEIR OWN GREENHOUSE-LIKE EFFECT
In his post, The Deep Blue Sea, John L. Daly presented something that must be considered in every discussion of ocean warming: the oceans have their own greenhouse like effect (I’ve added a hyperlink to John Daly’s Figure 1):
A greenhouse effect, by definition, means that the medium through which radiation passes is more transparent at visible wavelengths, but more opaque at infra-red wavelengths, thus letting in visible energy but obstructing the escape of sufficient infra-red energy to maintain thermal equilibrium without a rise in temperature.
The oceans also behave this way.
Reference to fig. 1 shows that the oceans let in visible solar radiation right down to 100 metres depth. However, the oceans cannot radiate from such depths, as infra-red radiation can only take place from the top few millimetres of ocean. Thus, the oceans are also behaving in a greenhouse-like manner, taking in heat and then trapping some of it to cause a temperature rise.
Phrased differently, sunlight can warm the oceans to depths of 100 meters, but the oceans can only release heat at the surface. Now consider that the oceans release heat primarily through evaporation (if memory serves, somewhere in the neighborhood of 90% of the heat loss from the oceans is through evaporation). UPDATE: Sorry, in this instance my memory was off. Of the approximately 180+ watts/m^2 downward shortwave radiation reaching the ocean surface, about half (about 100 watts/m^2) is released through evaporation.
THERE ARE NATURALLY OCCURRING PROCESSES THAT CAN CAUSE THE LONG-TERM WARMING OF THE OCEANS TO DEPTH
The naturally occurring processes that can warm the oceans, of course, are not considered in the climate models used by the IPCC. Climate modelers’ force the warming of the oceans based on their assumptions of how the infrared radiation from manmade greenhouse gases warm the oceans.
We’re going to break the oceans down into ocean-basin subsets, because, for two of the subsets, climate scientists addressed those portions of the oceans in the studies linked to this post.
I’ve presented these discussions in previous posts using ocean heat content data. For a change of pace, I’m presenting the NODC depth-averaged temperature data for the depths of 0-700 meters.
THE WARMING OF THE NORTH ATLANTIC TO DEPTH
As a preface to our first discussion, Figure 5 presents the depth-averaged temperature anomalies (0-700 meters) for the North Atlantic and for the rest of the global oceans. To determine the depth-averaged temperature anomalies for the rest of the global oceans, I area-weighted the North Atlantic data (11.5%, see the NOAA webpage here) and subtracted it from the global data. The units are deg C.

Figure 5
It very obvious that the North Atlantic to depths of 700 meters warmed at a much faster rate than the rest of the oceans, about 3.3 times faster from 1955 to present. That ocean basin only covers 11.5% of the surface of the global oceans, yet it represents about 35% of the ocean warming to depths of 700 meters.
NOTE: It is unfortunate that the outputs of the climate model simulations of depth averaged temperature (or ocean heat content) are not available in an easy-to-use form so that the models can be compared to observations. We know climate models do not properly simulate the warming of ocean surfaces. They double the warming rate of the ocean surfaces over the past 33 years. See the model-data comparison graph here. Also see the posts here and here for additional discussions. It would be interesting to see how poorly the models simulate ocean warming to depth. [End note.]
Now consider what I wrote in that introductory portion from my upcoming book: It’s very obvious why the change in the ocean heat content is very important to the hypothesis of human-induced global warming. If the oceans could be shown to have warmed naturally, then the impacts of manmade greenhouse gases are much smaller than claimed by climate scientists.
And that’s exactly what a group of scientists did back in 2008. They determined the warming of the North Atlantic to 700 meters since 1955 was caused by naturally occurring processes, not by manmade greenhouse gases. We’ve discussed this paper a few times in recent years—in blog posts and in books. Here’s a portion of my ebook Who Turned on the Heat?
[START OF REPRINT FROM WHO TURNED ON THE HEAT?]
There is a study that provides an explanation for that additional warming. See Lozier et al (2008) The Spatial Pattern and Mechanisms of Heat-Content Change in the North Atlantic.
First, a quick introduction to one of the terms used in the following quotes: The North Atlantic Oscillation is an atmospheric climate phenomenon in the North Atlantic. Like the Southern Oscillation Index described in Chapter 4.3 ENSO Indices, the North Atlantic Oscillation is expressed as the sea level pressure difference between two points. The sea level pressures in Iceland, at the weather stations in Stykkisholmur or Reykjavik, can be used to calculate North Atlantic Oscillation Indices. Which Iceland location they elect to use as the high-latitude sea level pressure reference depends on the dataset supplier. The other point captures the sea level pressure at the mid-latitudes of the North Atlantic, and there are a number of locations that have been used for it: Lisbon, Portugal; Ponta Delgada, Azores; and Gibraltar. The North Atlantic Oscillation Index is primarily used for weather prediction. The direction and strength of the westerly winds in the North Atlantic are impacted by the sea level pressures in Iceland and the mid-latitudes of the North Atlantic, which, in turn, impact weather patterns in Europe and the East Coast of North America. If you live in those locations, you’ll often hear your weather person referring to the North Atlantic Oscillation. As will be discussed, winds in the North Atlantic can also impact Ocean Heat Content.
I’ll present two quotes from the Lozier et al (2008) paper. I’ll follow them with quotes from the press release that describes in layman terms how the North Atlantic Oscillation impacts the Ocean Heat Content of the North Atlantic. Back to Lozier et al (2008):
The abstract reads:
The total heat gained by the North Atlantic Ocean over the past 50 years is equivalent to a basinwide increase in the flux of heat across the ocean surface of 0.4 ± 0.05 watts per square meter. We show, however, that this basin has not warmed uniformly: Although the tropics and subtropics have warmed, the subpolar ocean has cooled. These regional differences require local surface heat flux changes (±4 watts per square meter) much larger than the basinwide average. Model investigations show that these regional differences can be explained by large-scale, decadal variability in wind and buoyancy forcing as measured by the North Atlantic Oscillation index. Whether the overall heat gain is due to anthropogenic warming is difficult to confirm because strong natural variability in this ocean basin is potentially masking such input at the present time.
In the paper, Lozier et al (2008) note, using NAO for North Atlantic Oscillation:
A comparison of the zonally integrated heat-content changes as a function of latitude (Fig. 4B) confirms that the NAO difference can largely account for the observed gyre specific heat-content changes over the past 50 years, although there are some notable differences in the latitudinal band from 35° to 45°N. Thus, we suggest that the large-scale, decadal changes in wind and buoyancy forcing associated with the NAO is primarily responsible for the ocean heat-content changes in the North Atlantic over the past 50 years.
Based on the wording of the two quotes, the paper appears to indicate that Lozier et al (2008) are describing the entire warming of ocean heat content in the North Atlantic. In other words, it seems that Lozier et al (2008) are not stating that the North Atlantic Oscillation is primarily responsible for the additional ocean heat-content changes in the North Atlantic, above and beyond the rest of the world, over the past 50 years; they’re saying it’s primarily responsible for all of the variability. The press release for the paper, on the other hand, leads you to believe the North Atlantic Oscillation is responsible for the North Atlantic warming above and beyond the global warming.
The Duke University press release for the paper is titled North Atlantic Warming Tied to Natural Variability. Though the other ocean basins weren’t studied by Lozier et al, the subtitle of the press release includes the obligatory reference to an assumed manmade warming in other basins: “But global warming may be at play elsewhere in the world’s oceans, scientists surmise”. To contradict that, we’ve found no evidence of an anthropogenic component in the warming of the other ocean basins.
The press release reads with respect to the North Atlantic Oscillation (NAO):
Winds that power the NAO are driven by atmospheric pressure differences between areas around Iceland and the Azores. “The winds have a tremendous impact on the underlying ocean,” said Susan Lozier, a professor of physical oceanography at Duke’s Nicholas School of the Environment and Earth Sciences who is the study’s first author.
Further to this, they write:
Her group’s analysis showed that water in the sub-polar ocean—roughly between 45 degrees North latitude and the Arctic Circle—became cooler as the water directly exchanged heat with the air above it.
By contrast, NAO-driven winds served to “pile up” sun-warmed waters in parts of the subtropical and tropical North Atlantic south of 45 degrees, Lozier said. That retained and distributed heat at the surface while pushing underlying cooler water further down.
The group’s computer model predicted warmer sea surfaces in the tropics and subtropics and colder readings within the sub-polar zone whenever the NAO is in an elevated state of activity. Such a high NAO has been the case during the years 1980 to 2000, the scientists reported.
“We suggest that the large-scale, decadal changes…associated with the NAO are primarily responsible for the ocean heat content changes in the North Atlantic over the past 50 years,” the authors concluded.
[END OF REPRINT FROM WHO TURNED ON THE HEAT?]
WHAT CAUSES THE WATER TO “PILE UP”, INCREASING OCEAN HEAT CONTENT?
Let’s discuss in more detail that “pile up” from the press release of Lozier et al. (2008). First, a few basics: The trade winds are a function of the temperature difference between the equator and higher latitudes. The warmer water near the equator causes warm air to rise there (convection). At the surface, winds blow from the mid latitudes toward the equator to make up for the deficit caused by the rising air, but the rotation of the Earth deflects that inrushing air to the west. Thus the trade winds blow from the northeast to the southwest in the Northern Hemisphere and from the southeast to the northwest in the Southern Hemisphere.
In the ocean basins, ocean circulation is driven primarily from the trade winds in the tropics blowing from east to west. That is, the trade winds push the surface waters from east to west in the tropics. Those westward-traveling waters warm under the tropical sun. They encounter a continental land mass and are directed toward the poles. In the North Atlantic, the poleward-flowing western boundary current is known as the Gulf Stream. It carries the warm tropical waters to the cooler high latitudes, where that water can release heat to the atmosphere more efficiently. At the mid-latitudes, those waters encounter the west to east winds known as westerlies and are blown eastward toward Europe and Africa. The eastern boundary current along Africa returns those cooler waters back toward the tropics, where they can be warmed again, completing the cycle. That ocean circulation loop is called a gyre.
Now for the “piling up”: Suppose the westerlies in the mid-latitudes slowed or reversed, while, at the same time, the trade winds were pushing the same amount of tropical water to the west and poleward. At mid-latitudes, the change in the strength or direction of the westerlies would resist the poleward transport of warm water from the tropics. That warm water would accumulate as a result. Here’s that quote from the press release again:
By contrast, NAO-driven winds served to “pile up” sun-warmed waters in parts of the subtropical and tropical North Atlantic south of 45 degrees, Lozier said. That retained and distributed heat at the surface while pushing underlying cooler water further down.
Presto. A naturally caused accumulation of heat in the North Atlantic.
Curiously, under the heading of “Beam Me Up, Scotty”, Stefan Rahmstorf of RealClimate presented a similar discussion in his post What ocean heating reveals about global warming. I, of course, commented on that in my post Comments on Stefan Rahmstorf’s Post at RealClimate “What ocean heating reveals about global warming”
Now suppose, at the same time, there were a series of strong El Niño events over a multidecadal period (1976 to the turn of the century for example), so that the tropical waters in the North Atlantic were naturally warmer than normal. Trenberth and Fasullo (2011) explain why some portions of the oceans remote to the tropical Pacific warm in response to an El Niño (my boldface):
But a major challenge is to be able to track the energy associated with such variations more thoroughly: Where did the heat for the 2009–2010 El Niño actually come from? Where did the heat suddenly disappear to during the La Niña? Past experience (Trenberth et al. 2002) suggests that global surface temperature rises at the end of and lagging El Niño, as heat comes out of the Pacific Ocean mainly in the form of moisture that is evaporated and which subsequently rains out, releasing the latent energy. Meanwhile, maximum warming of the Indian and Atlantic Oceans occurs about 5 months after the El Niño owing to sunny skies and lighter winds (less evaporative cooling), while the convective action is in the Pacific.
That additional sunlight during a period when El Niños dominated (1976 to the turn of the century) would add to the amount of accumulating warm water in the North Atlantic…and elsewhere.
And Trenberth now understands that the heat didn’t suddenly “disappear to during the La Niña”. It shows up as the “big jumps” in surface temperature in response to strong El Niño events. See the posts:
- Open Letter to the Royal Meteorological Society Regarding Dr. Trenberth’s Article “Has Global Warming Stalled?”
- The 2014/15 El Niño – Part 9 – Kevin Trenberth is Looking Forward to Another “Big Jump”
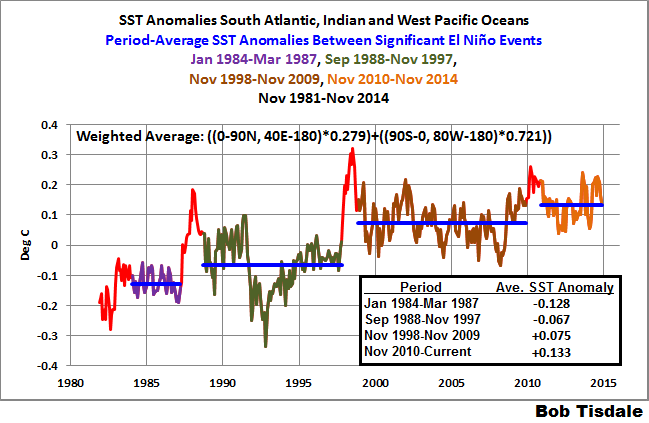
I also present those “big jumps” in the monthly sea surface temperature updates (November 2014 update is here). They stand out quite plainly in the sea surface temperature data for the South Atlantic, Indian and West Pacific Oceans. For a further discussion see the illustrated essay “The Manmade Global Warming Challenge” (42mb).
EXTRATROPICAL NORTH PACIFIC
The next paper to be discussed is Trenberth and Hurrell (1994): Decadal Atmosphere-Ocean Variations in the Pacific. In it, Trenberth and Hurrell were using an index derived from the sea level pressures of the extratropical North Pacific (30N-65N, 160E-140W), called the North Pacific Index, to explain shifts in the sea surface temperatures of the North Pacific. Again, a sea level pressure index reflects changes in the wind patterns. My Figure 6 is Figure 6 from Trenberth and Hurrell (1994).

Figure 6
That same shift appears in the depth-averaged temperature data for the extratropical North Pacific (24N-65N, 120E-80W) for the depths of 0-700 meters. But the shifts are delayed a year in the subsurface temperature data. See Figure 7.

Figure 7
I’ve color-coded 4 periods on the graph. The first period from 1955 to 1988 (dark blue) includes the downward shift in 1978. As a result of that shift in 1978 (that should be related to the shift in the sea level pressures and wind patterns), the depth-averaged temperature data shows a cooling trend from 1955 to 1988. That is, the extratropical North Pacific to depths of 700 meters cooled (not warmed) for more than 3 decades. The second period (red) captures the upward shift in 1988 and 1989 that, once again, should be related to the shift in the sea level pressures and wind patterns. From 1991 to 2002 (light blue), the extratropical North Pacific cooled once again to depths of 700 meters. And since the ARGO floats were deployed (black), the extratropical Pacific shows a slight warming to depth.
It’s blatantly obvious the extratropical North Pacific to depths of 700 meters would show no warming from 1955 to present if it wasn’t for that upward shift in 1988 and 1989. It’s also obvious that the downward shift in 1978 that extends to 1988 also impacts the long-term trend. That is, without the naturally caused downward shift in the late-1970s the long-term warming rate would be less. Obviously, natural variability, not manmade greenhouse gases, dominates the variability and long-term warming of the extratropical Pacific to the depths of 700 meters.
TROPICAL PACIFIC
We isolate the vertically averaged temperature data to depths of 700 meters for the tropical Pacific because the tropical Pacific is where El Niño and La Niña events take place, and El Niño and La Niña events, collectively, are the dominant forms of natural variability on Earth. A further clarification: while El Niño and La Niña events are focused on the equatorial Pacific, they directly impact the entire tropical Pacific. See the animation here for an extreme example of the effects of an El Niño on the sea level residuals of the tropical Pacific.
Let’s start with two quotes from (again) Kevin Trenberth. According to Trenberth, El Niño events are fueled by sunlight, not manmade greenhouse gases. In the much-cited Trenberth et al. (2002) The evolution of ENSO and global atmospheric surface temperatures, they stated (my boldface and brackets):
The negative feedback between SST and surface fluxes can be interpreted as showing the importance of the discharge of heat during El Niño events and of the recharge of heat during La Niña events. Relatively clear skies in the central and eastern tropical Pacific [during a La Niña] allow solar radiation to enter the ocean, apparently offsetting the below normal SSTs, but the heat is carried away by Ekman drift, ocean currents, and adjustments through ocean Rossby and Kelvin waves, and the heat is stored in the western Pacific tropics. This is not simply a rearrangement of the ocean heat, but also a restoration of heat in the ocean. Similarly, during El Niño the loss of heat into the atmosphere, especially through evaporation, is a discharge of the heat content, and both contribute to the life cycle of ENSO.
NOTE: That’s the source of my standard description of ENSO as a chaotic, naturally occurring, sunlight-fueled, recharge-discharge oscillator…with El Niños acting as the discharge phase and La Niñas acting as the recharge phase. But La Niñas also help to redistribute the leftover warm waters from the El Niños. [End note.]
Also see Trenberth and Fasullo (2011). They confirm that ENSO is sunlight-fueled during La Niña events:
Typically prior to an El Niño, in La Niña conditions, the cold sea waters in the central and eastern tropical Pacific create high atmospheric pressure and clear skies, with plentiful sunshine heating the ocean waters. The ocean currents redistribute the ocean heat which builds up in the tropical western Pacific Warm Pool until an El Niño provides relief (Trenberth et al. 2002).
Figure 8 presents the vertically averaged temperature anomalies (0-700 meters) for the tropical Pacific. El Niño and La Niña events directly impact the top 300 meters, so this depth captures their direct impacts. I’ve highlighted in maroon the three 3-year La Niña events of 1954 to 1957, 1973 to 1976, and 1998 to 2001. After those 3-year La Niña events, the tropical Pacific shows cooling, not warming. That indicates that the shorter La Niñas that follow El Niños only recharge part of the warm water released from the tropical Pacific by the El Niños. Also, I’ve highlighted in red the 7-month period associated with the 1995/96 La Niña. (See the old version of the NOAA ONI index.) The 1995/96 La Niña created the warm water that fueled the 1997/98 El Niño, which is responsible for the sharp drop in temperature following the heat uptake of the 1995/96 La Niña. The “overcharge” from the 1995/96 La Niña and the recharge during the 1998-01 La Niña obviously caused an upward shift in the subsurface temperatures of the tropical Pacific.

Figure 8
What is also blatantly obvious is the warming of the tropical Pacific to depth is dependent on 4 La Niña events. And according to Trenberth et al. (2002) and Trenberth and Fasullo (2011), sunlight warms the tropical Pacific during La Niñas, not infrared radiation from manmade greenhouse gases. (In the real world, downwelling longwave radiation decreases during La Niña events.)
BOTTOM LINE ON OCEAN TEMPERATURE DATA FOR THE DEPTHS OF 0-700 METERS
Subsurface temperature data (and ocean heat content data) for the North Atlantic, the Extratropical North Pacific and the Tropical Pacific all indicate that naturally occurring coupled ocean-atmosphere processes are the primary causes of ocean warming to depth, not manmade greenhouse gases. In fact, the data for the tropical Pacific and extratropical North Pacific show those oceans can cool for decadal and multidecadal periods between short-term naturally caused warming episodes. Those decadal and multidecadal cooling periods further suggest that manmade greenhouse gases have no measureable impact on ocean warming to depth.
NOTE: Someone is bound to note that I’ve only presented subsurface ocean temperature data for the top 700 meters and only for the oceans of the Northern Hemisphere and the tropical Pacific. If I receive a comment to that effect on the thread, I will refer that blogger to the 2 posts linked in the introduction. Here they are again:
- Is Ocean Heat Content Data All It’s Stacked Up to Be?
- AMAZING: The IPCC May Have Provided Realistic Presentations of Ocean Heat Content Source Data
CLOSING
I’m sure I’ve missed a few arguments for and against the anthropogenic ocean warming. If you introduce others, please provide links where possible.
UPDATE 2: While preparing this post, I overlooked an excellent post by Willis Eschenbach Radiating The Ocean.
If GHG really have increased sea temps, even just down to 100m, the effect would be so small that we could not possibly measure it.
Oh my God, the sky dragons are back.
Infrared radiation can warm a metal bar. How far do you think it penetrates into that Bob?
Did you read the post, MikeB? Apparently, you didn’t understand it.
Bob,
In a post way too long, you’ve devoted far too much space to some very silly arguments. There is no issue about down IR penetrating sea water. The sea surface is warm and radiates upward more heat than it receives in sunlight. If it were not for down IR, it would cool rapidly. Down IR maintains heat flux balance at the surface. It does not need to penetrate. If down IR increases, the flux from below decreases, at the same temperature. The sea is warmed by that retained heat.
I have to agree with Nick. The effect of participating media is to decrease the rate of energy transfer. This is not a steady state affair. For the system to achieve steady state the hot side must get hotter. This then increases the rate of energy transfer and steady state is again achieved. On the other hand. Nicks argument allows for the principle of saturation. Given that combustion engineering models see saturation of CO2 it is odd that this is not seen in climate models.
Whether/how DLWR warms the oceans is key to whether or not we should be worried about increasing CO2 levels in the atmosphere, and Bobs post is important in giving this subject centre stage.
I have read of only one proposed mechanism by which DlLWR can contribute to ocean warming, and that is by heating of the ‘thin film’ surface layer, thus altering the temperature gradient across it and inhibiting heat loss by conduction through it. In other words DWLR generates an insulation effect at the surface.
Nick Stokes appears to be referring to this mechanism, but I have never seen any calculations that demonstrate quantitively that it is capable of leading to the increase in ocean heating which the alarmists happily describe in units of Hiroshima Bombs. Does any contributor know of any?
That post doesn’t make a bit of sense. Photons are not like (American) football players, blocking each other to prevent them from going downfield or, in this case, radiating away at the surface.
John Eggert says: “On the other hand. Nicks argument allows for the principle of saturation. Given that combustion engineering models see saturation of CO2 it is odd that this is not seen in climate models.”
Different problem. This issue was worked out in about the 1950s: What matters for the greenhouse effect is where the radiation is emitted such that it can successfully escape to space. It not just an issue of “Does the radiation emitted by the surface get absorbed at least once?” The role of greenhouse gases is to move this effective emission layer up to higher altitudes. Since there is a lapse rate in the troposphere, this means emission to space is occurring from colder regions and hence less radiation is emitted to space. This puts the Earth system out of radiative balance. (It is now emitting less to space than it is absorbing from the sun.) Hence, over time, it’s heat content increases and it warms until such a time that radiative balance is re-established.
Nick, thanks for commenting. First, my post is precisely as long as I wanted it to be. FYI, I trimmed 4000 words and 5 illustrations. Second, the silliness of an argument is in the eyes of the beholder. Those making the arguments didn’t think they were silly when they made them. And we also note you weren’t specific about which arguments were silly. One might suspect that your general characterization of the arguments (as silly) was simply your attempt to downplay everything but what you, personally, felt was important. Others may differ with you.
Additionally, this post was not about the background state of the oceans and atmosphere. It was about the additional impacts of manmade greenhouse gases, whether they had a MEASUREABLE impact on ocean warming.
We can discuss this for weeks, posturing about the possible impacts of a 1.2 watt/m^2 increase in infrared radiation against a background state, but that would be a waste of our times, Nick. I always have data to point to, and I will always point to data. According to the only reasonably reliable, much-tweaked, observations-based data, which is the ARGO-era data, the Pacific Ocean and the North Atlantic to depths of 2000 meters show little to no heat uptake for the last decade, and those two basins represent more than 2/3 of the surface of the oceans.
I do realize it’s a very short time period, but that’s all we’ve got.
Old’un
I agree with your brief and pithy comment. I understand Nick’s comment in the same way, and I think he would agree we understood it properly.
Missing from the description of that is happening is that the water vapour level immediately above the surface is saturated and as opaque to IR as the water surface. The effect CO2 exerts within 3 metres of the surface is vanishingly small. If the water vapour (absolute humidity) changed a few % because of the air temperature, or wind speed, it would swamp any putative warning effect of back radiation – and that Nick’s effect is rooted on that back radiation only. If there were no back radiation, there would be no GH effect, right? So if back radiation cannot produce a measurable effect at the ocean surface, claims it is a cause of a meaningful proportion of change in the ocean heat content is skating on thin ice.
There is a comment above about 4 watts/m^2 for a doubling of CO2. I think that includes water vapour feedback, not so? Well, that is an admission that water vapour which abounds at the ocean surface is more important that CO2. Include it in radiative arguments!
The effect of DWIR at the surface in the daytime is very different from night time. I don’t think this can be overlooked. Saturated air near the surface prevents a portion of IR reaching the water surface using the same mechanism that ‘prevents’ it getting into space. At night when the ocean is warmer than the air, there is a huge DWIR from water vapour near the surface that totally overwhelms anything from CO2, let alone AG CO2 – in other words a GHG effect involving water vapour near the surface. A tiny variation in water vapour concentration is bigger than a huge change in CO2. .As we all know, an increase in water vapour leads to rain which is, net, a cooling influence on the ocean as the process vents heat upwards well above the surface.
As you say, show me the numbers.
For 20 years we have had most scientists and thinkers saying, AGW is conceptually possible, let’s give them the benefit of doubt, after which skeptics tried to show that proposition was faulty at a lot of scales. Now, after 20 years of confusing signals from the real world, it is time to change this approach. It is time those who make AGW claims to start demonstrating the idea is valid, with the default position changing from ‘OK, maybe you are right’, to ‘No, it is not acceptable as a proposition until it is demonstrated’ – in other words when the null hypothesis has been falsified.
Bob, you are doing a great job at showing, in the face of ‘let’s assume it is correct’, that there is no case to answer. It is time for the AGW proponents to provide data and math that invalidate the null hypothesis.
IR heating and cooling at the surface of the oceans are dominated by water vapour. Conceptually, Nick’s model is going to work, but at what scale? I want to see the numbers. IR retransmissions is almost entirely from water vapour. CO2 is a tiny fraction of the total. AG CO2 changing the total CO2 by a tiny fraction over a decade causes a tiny change in the tiny fraction of IR exchanges attributable to CO2.
With the OHC changes barely quantifiable with modern instruments (see Willis’ discussions) we can’t assert a detectable influence from AG CO2 on ocean temperature without some mechanism, measurements and proof-of-concept calculations. And the calculations can’t ignore water vapour, for heaven’s sake.
Bob,
“And we also note you weren’t specific about which arguments were silly. “
I was specific about the IR can’t warm argument. But an even sillier one is the one where you say:
“Based on the findings at RealClimate, that rise in infrared radiation could only warm the sea surfaces by a little more than 0.002 deg C since 1979.”
That’s just completely wrong. The numbers given there (RC) relate to the difference between skin temp and temp at 5cm depth. They are a measure of flux, not of warmth. They are measuring the effect of down IR on flux in the water. And it’s substantial.
Nick Stokes: Down IR maintains heat flux balance at the surface. It does not need to penetrate. If down IR increases, the flux from below decreases, at the same temperature.
IR does not maintain heat flux “balance”, because most of the time there is not balance. If down IR increases, the flux from below is unaffected and the surface rate of evaporation increases, at least most of the time when the wind is not absolutely still.
Very few studies have looked at the change in the rate of evapotranspirative energy transport from the surface (evaporative in this case) in response to changes in CO2 or warming. The estimate of 0.002K/(Watt/m^2) change in surface temperature, measured in a study, is quite realistic considering the latent heat of evaporation of water. According to Trenberth et al, more heat is carried by wet thermals from surface to upper troposphere by evapotranspiration than by radiation.
Matthew Marler,
“IR does not maintain heat flux “balance”, because most of the time there is not balance. If down IR increases, the flux from below is unaffected and the surface rate of evaporation increases”
It maintains long term balance (over days). Heat is conserved and can’t accumulate at the surface without big temperature change.
If down IR increases, the flux from below is affected. That is exactly what the Tangaroa experiment is showing. Early morning, the nett LW comes almost into balance, and the temperature drop across the top 5 cm halves, relative to the other extreme. That drop measures flux from below (heat from sun).
Nick Stokes
December 9, 2014 at 6:16 am
////////////////////////////////////////////
” There is no issue about down IR penetrating sea water. The sea surface is warm and radiates upward more heat than it receives in sunlight. If it were not for down IR, it would cool rapidly. Down IR maintains heat flux balance at the surface.”
Nick, that is incorrect. You cannot use apparent emissivity measured within the Holorumn of the atmosphere to determine effective emissivity of water.
Any claim that incident LWIR can slow the cooling rate of the oceans can be checked by the simplest of experiments –
http://i42.tinypic.com/2h6rsoz.jpg
– fill both sample chambers with 40C water and record their cooling rate over 30min. You will note no significant difference between the samples under the weak and strong LWIR sources. Now repeat the experiment but put a couple of drops of baby oil on the surface of each water sample to prevent evaporation. Both sample can now only cool by conduction and radiation. Now the sample under the strong LWIR source cools slower.
The fact that incident LWIR cannot slow the cooling rate of water that is free to evaporatively cool raises the question – “what is keeping the oceans above theoretical blackbody temperature of 255K for an average of 240 w/m2 solar insolation?” The answer is painfully simple – The oceans are an extreme SW selective surface not a near blackbody.
Firstly for water SW absorptivity (~0.9 hemispherical) is asymmetric with IR effective emissivity (~0.7 hemispherical). Secondly water is SW translucent and solar radiation is absorbed at depth not at the surface. To water all watts are not equal, frequency matters. This simple experiment shows why –
http://oi61.tinypic.com/or5rv9.jpg
– Both blocks have equal ability to absorb SW. Both blocks have equal ability to radiate LWIR. The only difference is depth of SW absorption. Illuminate each block with 1000w/m2 of LWIR and they will both rise to the same temperature. Illuminate both blocks with 1000 w/m2 of SW and block A will run 20C hotter. This experiment is a clear demonstration of why S-B equations should never have been used on the oceans.
You can try it again with water that is free to convect –
http://oi62.tinypic.com/zn7a4y.jpg
– John Daly was correct. There is a greenhouse effect in the oceans. From experiments like those shown above conducted at differing scales the following five simple rules for SW translucent materials can be demonstrated –
http://i59.tinypic.com/10pdqur.jpg
– these rules apply no matter if the materials are radiatively, conductively or evaporatively cooled. These rules apply to our oceans. This incredibly basic physics is utterly missing form the “basic physics” of the “settled science”.
Climastrologists have gone and treated our deep convecting intermittently illuminated SW translucent oceans as if they were an opaque material constantly illuminated by 240w/m2. This leads to a fist-biting mistake of around 80K for “surface without atmosphere” temperature calculation for 71% of the planet’s surface. Our radiatively cooled atmosphere is not raising ocean temps from 255K, it is cooling them from around 312K. There is no net atmospheric radiative GHE on planet Ocean.
Nick Stokes: It maintains long term balance (over days). Heat is conserved and can’t accumulate at the surface without big temperature change.
If down IR increases, the flux from below is affected. That is exactly what the Tangaroa experiment is showing. Early morning, the nett LW comes almost into balance, and the temperature drop across the top 5 cm halves, relative to the other extreme. That drop measures flux from below (heat from sun).
first, balance is obtained over years, not necessarily days, and for certain not over short periods of time like sunrise and sunset and clouds. second, the Tangaroa experiment has at least two and maybe more explanations: the one that you describe, and the increase in vaporization caused by increased LWIR; where and when water is evaporating, a small increment of LWIR increases the evaporation rate without affecting the rate of heat diffusion from below.
Matthew Marler,
“first, balance is obtained over years, not necessarily days”
It depends on the length scale (thermal inertia). People speak of micron layers penetrable by IR; obviously they must balance in seconds or less. In the top 5 cm used for skin effect, a 1 W imbalance will raise the temperature 1°C in about six hours. etc. And so proportional to depth. Top meter, about 5 days. The Tangaroa shows response on a sub-daily scale.
“where and when water is evaporating, a small increment of LWIR increases the evaporation rate without affecting the rate of heat diffusion from below.”
There is no special linkage between fluxes. They interact through the temperature. Evaporation is determined by temperature, wind and humidity, not by some flux calculation. If LWIR increases it will increase surface temperature, which will simultaneously:
1. increase evaporation
2. reduce the temperature gradient in the water, reducing the flux from below
3. increase upward IR.
Each of these changes is determined by the temperature change, and tends to counter it.
Nick writes “If down IR increases, the flux from below is affected. That is exactly what the Tangaroa experiment is showing.”
No its not.
If down IR increases AND down SW decreases then the difference between the surface and bulk increases. And that could equally be because the bulk is cooling relative to the surface which will stay warmer until the residual warmth from the bulk has convected to the surface and been radiated/evaporated away. THATS what the Tangaroa experiment is showing.
Its a flawed experiment Nick.
Tim,
“And that could equally be because the bulk is cooling relative to the surface which will stay warmer until the residual warmth from the bulk has convected to the surface and been radiated/evaporated away. “
No, it can’t equally be that. Heat from SW is distributed over many metres of depth. Thermal inertia is huge. There is essentially no diurnal temperature variation over most of that range. But LWIR variations affect the surface on short time scales.
I have an early post on this. It shows the extent of diurnal variation with depth.
Nick writes “No, it can’t equally be that. Heat from SW is distributed over many metres of depth. Thermal inertia is huge.”
Not true. The moment SW decreases the energy deposited into the ocean slows and cooling immediately starts to take place. Minnett has provided no details as the how he made his measurements so your assumption that the effect is “immediately” measured is just that, an assumption.
Nick, you know the temperature profile of the top of the ocean is held at least in part due to the different wavelengths being absorbed at different depths. When that stops, the profile is bound to change.You made the observation yourself at SoD. I remember the thread…
“The moment SW decreases the energy deposited into the ocean slows and cooling immediately starts to take place”
It may immediately start. But it will take a long time to get anywhere. I said above to MM that it would take 6 days for 170W/m2 to change a 1m layer by 1°C. For 10 m, that is 60 days. And that is the full flux. A cooling flux could only be a fraction.
Nick writes “It may immediately start. But it will take a long time to get anywhere. I said above to MM that it would take 6 days for 170W/m2 to change a 1m layer by 1°C. For 10 m, that is 60 days.”
Irrelevent. Its 5cm not 1m and the profile at the 5cm and above changes quickly. Your own graphs (sourced from Wiki I expect) show that. Its only a 0.2C change or less for the vast majority of Minnett’s measurements.
Sorry Nick,
gallop around the race course as long as you like, you can never win. Turn the dial on “Flappy-hands” all the way to 11 (hummingbird) and you still can’t escape.
Climastrologists went and treated the oceans as a near blackbody instead of an extreme SW selective surface. You can’t turn back time. You can’t erase the shame. The reality is given 1 bar pressure, our radiatively cooled atmosphere is cooling the oceans from 312K to 288K. The climastrologists you are trying to defend are claiming that the oceans are SW opaque and given 1 bar pressure the net effect of our radiativley cooled atmosphere is to slow the cooling rate of the oceans. The engineers are all laughing at you.
Glue factory time for the racehorse 😉
Nick Stokes: If LWIR increases it will increase surface temperature,
That is the part that I am doubting. The effect could just as likely be to increase the excitation state of just “evaporated” water vapor.
Evaporation is determined by temperature, wind and humidity, not by some flux calculation.
Evaporation at a sustained rate requires a sustained influx, without which the temperature will decrease.
Would you happen to have a good reference on the exact changes occurring at the water surface as evaporation is occurring? It seems to me that a key to understanding the effects of CO2 on climate requires knowing more than I have found so far on the effect of downwelling LWIR on evaporation rate, especially by seasons and daytime. To me, too much of the discussion depends on assumptions of “balance” and equilibrium in systems that are never even in steady-state, much less equilibrium. Too much is expected of a 4W/m^2 increase in downwelling LWIR — and several widely cited papers assume a new equilibrium 1C higher than what we have now has already been obtained, and increased evaporative transfer of energy from surface to upper troposphere.
MM,
“Evaporation at a sustained rate requires a sustained influx, without which the temperature will decrease.”
How the temperature is maintained is a separate question. That’s the pattern of heat transfer analysis. The heat equation equates the local rate of temperature change to the flux imbalance (divergence). You calculate a temperature field, see how that changes the fluxes, see how that changes the temperatures etc.
To make an economic analogy; if steelmaking expands in China, it tends to contract in the US. The Chinese aren’t interfering with the operation of the US mills. Their production brings down the price. It’s the price drop that affects the US operation. flux~production, T~price.
“Would you happen to have a good reference on the exact changes occurring at the water surface as evaporation is occurring?”
It’s a critical issue for coupled AOGCMs. Heat and mass transfer at the surface. Here is one such. But I don’t think you’ll find much that directly links DWLWIR to evaporation. It’s a key plus of the analytic process that they operate separately, mediated by temperature.
Nick Stokes: How the temperature is maintained is a separate question. That’s the pattern of heat transfer analysis. The heat equation equates the local rate of temperature change to the flux imbalance (divergence). You calculate a temperature field, see how that changes the fluxes, see how that changes the temperatures etc.
That does away with incoming radiation absorbed by H2O and CO2 completely, does it not?
Doubling CO2 concentration is said to raise the downward llwir by 4 W/m^2. Is that enough power both to persistently warm the surface and increase the lightning flash rate by 12%? For that we need to know: (a) how much does the increased 2 W./m^2 increase the rate of evapotranspirational energy transfer from the surface and (b) how much does the rate of evapotranspirational energy transfer from the surface have to increase to produce a 12% increase in the lightning flash rate? I don’t think you can get those answers from the heat equation, but I would love to read if someone has done it.
joeldshore
You make a bizarre statement.
“Since there is a lapse rate in the troposphere, this means emission to space is occurring from colder regions and hence less radiation is emitted to space.”
Under what circumstances would you imagine heat transfer occurring WITHOUT a gradient of hot to cold? “Lapse Rate” is the term for this gradient in the atmosphere. The gradients in combustion engineering are much steeper than in climate science. At higher temperatures, >1000C, there are also a lot more spectral lines than at those seen at the temperatures in the atmosphere. The fact is, that “upward moving effective emission layer” gets to the top of the atmosphere at about 500 bar cm concentration, which on earth is about 800 ppm. Beyond that, there is so little increase in forcing, regardless of how much CO2 you add, that it can be approximated by 0. The methods of combustion engineering generate a forcing curve nearly identical to that found by Ramanathan and those who followed him. There is a relatively small divergence from 200 ppm to 800 ppm. It would nicely explain the divergence we are seeing in the modeled versus real temperatures.
Nick Stokes December 9, 2014 at 6:16 am
>’There is no issue about down IR penetrating sea water.”
No there isn’t. But what IR are you referring to? IR-A/B in the DSR spectrum or IR-C in the DLR spectrum. Big difference in penetration depth. Go way down thread to here (note the 2 subsequent corrections):
richardcfromnz December 11, 2014 at 2:50 pm
http://wattsupwiththat.com/2014/12/09/arguments-for-and-against-human-induced-ocean-warming/#comment-1812118
>”The sea surface is warm and radiates upward more heat than it receives in sunlight.”
It’s the energy budget that matters. In the in-situ example at the link SSN is 191.5 W.m-2, DLR – OLR (Rnl) is -57.1 W.m-2. Rnl + Hs + Hl is -168.1 W.m-2.
>”It does not need to penetrate. If down IR increases, the flux from below decreases, at the same temperature.”
Huh? “does not need to penetrate”? This is a new thermodynamic principle you’re introducing Nick, are you sure about this?. If no matter has been penetrated, the energy remains as radiation. But the speed of radiation delivery is the speed of light, that doesn’t suddenly stop at the AO interface i.e. it does need to penetrate, or to be reflected, or to be scattered. DSR (IR-A/B) penetrates water 1µm – 1m, DLR (IR-C) penetrates water (3µm – 100µm). See the linked comment above.
>”The sea is warmed by that retained heat.”
No not by “that” retained heat. In the tropical example linked above the ocean sub-surface gains heat because solar ingress is greater than radiative energy and sensible heat and evaporative heat egress from the surface. The excess heat is dissipated away from the tropics where thermal gradients allow.
Do metal bars evaporate?
“Do metal bars evaporate?”
Sure, depends on the metal, and the temperature. Isn’t that how (CO2?) lasers cut metal?
Mike,
Take a tank of water with the two most accurate thermometers you can find. Place one so it reads the first few millimeters of the water’s temperature (it will have to be an exceedingly small thermocouple device) and the other about a meter from the surface (or more). Insulate the tank from any external heat sources. Place an infrared light above the water shining onto the surface, but high enough not to allow convection from the air to build up. Measure this setup for the next 10 years.
You will find the tank surface temperature is high, but the thermometer one meter down has not changed in any appreciable way. IR does not penetrate beyond the skin of the water.
Repeat the experiment but this time use a broad spectrum visible light source of the same power as the IR source above. You won’t need 10 years to measure the temperature rise.
Repeat the experiment with the same power UV source – temperature rise may not happen if your tank is not deep enough as the higher the energy of the radiation source photons, the deeper the energy deposition peak is. This is well known in radiation physics, but the oceans however, are deep enough for this energy to be deposited well below the surface. If you use gamma rays to heat water, you need a very very deep tank, because their deposition curve places most of the energy very deep. (Of course they are not the significant radiation power intersecting the Earth!)
Now on your metal bar – shine that IR light on that metal bar with a number of thermocouples down its length. If only one end of the bar is in the light beam you will find that the metal does heat somewhat, but the end not in the light barely registers a change. We did that experiment in undergrad lab course and had to get something that would conduct the heat to the rod because the effect was too subtle for our equipment to detect with the heat lamp.
The thing not apparently understood – by some, although I think the head poster, Bob Tisdale, does understand – is the actual size of the oceans; over a hundred million square miles [the US is about 3 million, the UK les than 100,000].
And some two or slightly more – miles deep.
Over a billion cubic kilometres.
And the entire human race will fit into about one half a cubic kilometre (or a little less, my model doesn’t even use envelope-back precision).
7.5 billion, each at – say 60 Kg = 60 litres (roughly, I know!). Little allowance for infants, the morbidly obese [but – hey. Arm-waving numbers!] . . . .
450 billion litres.
450 million cubic metres.
A kilometre cubed is 1,000,000,000 m3 > so <half a kilometre cubed. ISH-ish.
Send me an envelope, please!
As has been noted – a lot of water to heat . . . .
Auto
Please answer a question. If NOAA’s Annual Greenhouse Gas Index says that the infrared has increased 1.2 watts from 1979 to 2013, and the Figure 3 graph shows an increase of 0.7 total, doesn’t that imply that at least 60% of the warming is easily attributable to the Sun?
Ron, Figure 3 presents downward shortwave radiation, not longwave (infrared) radiation.
Thanks. Missed that.
Ron, now consider the long term affect of that one 1.2 watts of S/W energy going into the oceans reading here, and here… http://wattsupwiththat.com/2014/12/09/arguments-for-and-against-human-induced-ocean-warming/#comment-1809882 and here… http://wattsupwiththat.com/2014/12/09/arguments-for-and-against-human-induced-ocean-warming/#comment-1809894
please note, it would be vey helpful to know what W/L composed that 1.2 watt increase at the surface, as well as the residence time of that increase in insolation.
The greenhouse effect is (just) a load of hot air (hotter than it would otherwise be). The ocean gets warmer (than it would otherwise be) simply because it sits beneath a blanket of warmer air, but it takes centuries for this to happen.
If you don’t believe that go outside naked now (winter) at night, and compare how it feels relative to a similar exposure on a summers night. The only difference is the temperature of the air. You and the ocean cool less under a blanket of warmer air than under a blanket of colder air.
One thing that gets my goat sometimes when seeing scientists arguing against the infra-red part of the global warming con, is how complicated they make it. Like this really is a discussion about science. It’s not. It’s a discussion about fraud. You don’t need a 10 page paper on back radiation with a dozen equations and graphs. You just need some basic common sense and some simple observations.
The heat is LEAVING the surface. It is going from hot to cold. It can’t be sent back and even if it could it’s not going to return to make the surface hotter than it was the second visit than it was originally. End of story. The maths and the absorbtion rates and all the rest should be called out for what it is: scientific bullshit!
That this concept was ever even considered by other scientists is a disgrace. Worse that it has been considered that 0.04% of the atmoshere could do it!
Just do a bit of basic thought here. The last 0.9C of warming has been attributed to a 0.012% increase in CO2. However you spin it every molecule of CO2 has been able to absorb enough energy from absorbing a fraction of the energy leaving the surface and redirecting half of it, enabling the heating of the surrounding 8333 molecules!
The post a few days back quoting from Mein Kampf wasn’t out of order. If you want to get away with fooling a large number of people you need to make a lie so outrageous that no one will believe it is possible for anyone to dare to say it if it wasn’t true!
This is such an outrageous lie. Committed by people with PhDs in physics. The king has no clothes on. It’s not “counter intuitive” it’s bullshit!
True in part, but if you think of the atmosphere as a large number of shells each at its own temperature, then the surface isn’t truly radiating to the 4K of space, but to the next layer of atmosphere at a temperature, which radiates not to the 4K of space but to the next layer up. This continues until a layer against that 4K of space radiates to it. To me the Greenhouse Effect is just the time constant of all those transmissions eventually to space. The thickness of each of those shells would be determined by how thick is required for a given level of opaqueness to the wavelength in question. That is my oversimplified explanation anyway.
I tutor physics. My first lesson is “common sense is your enemy”. The heat is indeed leaving the surface. In a simple, static system, the rate it leaves will be constant. The temperature required to achieve that constant depends on what is between hot and cold. If you put something in between that reduces the heat transfer at a particular temperature, the hot side gets hotter to achieve equilibrium. There are a number of mechanisms for heat transfer. Phase change, conduction, convection, radiative. All can be impacted by participating media. This debate is about one specific thing and its impact. It just happens to be the most complicated. Well. Convection can be pretty complicated too. Add in the fact that the system is never at steady state and you start to need many, many pages to describe an unperturbed state. Change something, like CO2 and now you have a peturbed, not steady state system. Common sense is not going to help you.
wickedwenchfan
I think you are confusing conduction of heat with radiation of energy. This is common in posts on this site. It is OK, we are here to help. This is a place of sharing science. Please read the following. This is what you wrote:
“The heat is LEAVING the surface. It is going from hot to cold. It can’t be sent back and even if it could it’s not going to return to make the surface hotter than it was the second visit than it was originally”
Let’s take that one part at a time:
“The heat is LEAVING the surface. It is going from hot to cold.”
Energy that is radiated is not ‘heat’ until it gets to an object. Temperature is a measure of how much energy is contained within some system (like a molecule). Energy can be absorbed, raising the temperature. It can re-radiate that energy and cool down again. The thing being transmitted is not heat, it is energy. Infra red wavelength radiation is just light at a lower frequency. All hot and cold objects radiate energy all the time: hot one to cold ones and cold ones to hot ones. If you raise the temperature of an iron bar to 900 C it will radiate energy in the visible spectrum. The net effect is that a hot object will radiate more energy to a cold one and the cold one will warm. But it is not true that the cold one is not radiating energy to the hot one. It does’ because it does not ‘know’ that the hot object is there. That being the case, if the cold one were even colder, there would be a net cooling of the hot one because it is no longer receiving as much radiation as it was initially from the ‘less cold’ object. The now-colder object in the second example is not ‘sucking’ heat from the hot one causing the hot one to cool faster, it is just not sending as much energy back. This is the ‘effective insulation’ effect Nick was talking about. Anything that interferes with the radiation getting to the cold object and going back to the hot one is ‘insulating’. At the ocean surface, the most important material doing this is water vapour.
The mechanism described by Nick way at the top is correct – the net effect should be insulative, however Old’un an I want to see the numbers. The effect is theoretically real, but we both believe it is it is very small.
>”It can’t be sent back and even if it could it’s not going to return to make the surface hotter than it was the second visit than it was originally.”
That is where you are thinking of a ‘heat conduction’ mechanism and applying it to a radiation case. It doesn’t hold. Heat does not conduct from the cold end to the hotter end of a metal bar, it is true. But there is no Infra Red radiation involved in that case. Step outside into the sunlight. Your body is radiating energy towards the sun and warming it every so slightly. That is just how things work.
Two suns rotating about a common point keep each other warm without any conduction, whatever their temperatures.
Stay well…
…and that is what I call a very clear explanation of a very common misconception.
“I think you are confusing conduction of heat with radiation of energy.”
That confusion is rife here.
If heat is conducted to the air from the surface it cannot also be radiated to space.
So, 255K from 288K radiates to space but the other 33K holds up the atmosphere via conduction / convection.
That extra 33K at the surface is a result of adiabatically warmed descending air in surface high pressure cells inhibiting convection so that incominmg solar energy can warm the surface above S-B.
The descending warmed air dissipates clouds and so is transparent and at the same time it reduces or reverses the lapse rate slope to reduce or prevent convection.
That is exactly how a greenhouse glass roof works.
The greenhouse effect is a result of the mass of warmed air descending towards the surface over 50% of the globe at any given moment.
As such, the description comparing it to a greenhouse is perfect as would have been known by the meteorologist who first coined it.
Absolute nonsense, take a temperature inversion where the air is above the surface temperature and CO2 is emitted at 15 micron and will be absorbed at the surface. In the case of a normal lapse rate the CO2 is cooler than the surface and still emits at 15 micron, that radiation will also be absorbed by the surface. Your bogus argument makes the assumption that the surface ‘knows’ the temperature of the emitter which is absurd.
And such an inversion can actually produce an anti-greenhouse effect where the CO2 emitting layer is warmer than the surface. Shown in the Nimbus downward-looking IR spectrum of Antarctica.
wickedwenchfan: You just need some basic common sense and some simple observations.
Nothing in nature operates according to human common sense.
Regarding…”Reference to fig. 1 shows that the oceans let in visible solar radiation right down to 100 metres depth. However, the oceans cannot radiate from such depths, as infra-red radiation can only take place from the top few millimetres of ocean. Thus, the oceans are also behaving in a greenhouse-like manner, taking in heat and then trapping some of it to cause a temperature rise.”
=======================================================
I just had this discussion with davidmhoffer, beginning here…http://wattsupwiththat.com/2014/12/05/friday-funny-over-a-centurys-worth-of-failed-eco-climate-quotes-and-disinformation/#comment-1808271
and continuing for several successive posts. I called the oceans a GHL (green house liquid) and elaborated a bit on the fact that the oceans are a three dimensional SW selective absorption surface.
Also the energy affected, SW radiation vs. the atmospheric CO2 affect on LWIR, has a very long residence time, thus an equal watt per square meter change can have a FAR greater impact on earth’s energy budget, due to the very long residence time of SW radiation.
BTW, the oceans receive sunlight up to 800′ in depth, and, due to the very long residence time of this energy, the oceans can accumulate far more energy then usually thought based on the long residence time, and decadal changes in insolation. (Just like a very well insulated pot under a very small flame can still reach a very high temperature, over time.)
David A: “the oceans receive sunlight up to 800′ in depth, and, due to the very long residence time of this energy, the oceans can accumulate far more energy then usually thought based on the long residence time, and decadal changes in insolation.”
So we should be able to measure that heat down to 800′. Can we? Is there a heat profile that we can look at and that conforms your theory?
Bernd, I do not have theory about the disphotic zone (disphotic means “poorly lit” in Greek) Actually I made a mistake and should have said it extends down to 800 meters, not feet in depth. The temperature is about 39 to 41 degrees, and it is a fairly simple Google search.
As to how much the energy balances of the oceans change over several decades of say weak solar cycles, changing to several decades of strong solar cycles, I do not know. but think, due to the very long residence time of some of this energy, it is worth considering. if I was a “climate scientist” with large grants, I would study such things as the disparate residence time of different W/L solar energy within the oceans.
The potential heating ability of an input is not so much its watt per sq. meter input, as its absolute temperature. In other words a large warmed rock, may put out as much energy as a very small hot flame of equal total energy. However that very small flame, when its input is fed into a very large well insulated pot can eventually bring the water to a far higher temperature. The large warm rock under the same pot, can never bring the water above it own temperature.
I consider it likely that changes in cloud cover amount, and in jet stream location and therefore cloud cover location, will have a greater impact on total ocean insolation. One other criticism of the experiments done regarding ocean T changes to LWIR is that water vapor (even in clear sky conditions) limits surface insolation due to the broad spectrum of absorption of W/V, and, to my knowledge, no measurement of water T change at deeper depth accompanied these experiments.
“I called the oceans a GHL (green house liquid)”
I’m stealing that one 😉
Konrad, you deserve it. I have a further post to you later tonight, so check back.
Konrad, I would like your thoughts on some of what I have expressed in this conversation here… http://wattsupwiththat.com/2014/12/05/friday-funny-over-a-centurys-worth-of-failed-eco-climate-quotes-and-disinformation/#comment-1808271
The fact that you have actually made some detailed effort to do these experiments is very commendable.
Please tell me your scientific background. I noticed Nick never answered your post detailing your experiments.
I do not have the scientific capacity to determine if your calculation of the overall affect of the oceans on the average T of the earth are correct. However I have long suspected that the ocean immense heat storage capacity, due to the long term residence time of energy entering it, relative to the shorter residence time of same energy being absorbed on the earths surface, brings in far more net energy into the system then would accrue without them. after all, the land cannot absorb the energy it receives at the tropics, and over long time scales move it to the polar regions to warm them. Of course like many natural processes, there is some unknown degree of Newtonian reactions (For every action there…) which Willis and others have detailed regarding cloud formation and SW energy absorption.
Konrad, or anyone for that matter, please help me better understand the process of SW absorption into the ocean, and conversion of that energy to heat.
I think the energy from the photon is supplied by a collision within the water, or any particulate within the water encountered, then said molecule is accelerated: the energy that was stored in the photon becomes kinetic energy in the ocean molecule. Is this close to correct?
David A
December 10, 2014 at 12:48 am
////////////////////////////////////////////////
David, sorry for the slow response, my time has been on the clock the last few days.
”I would like your thoughts on some of what I have expressed in this conversation here… “
Wake up and turn your olfactory attention to nearby caffeinated beverages. DMH is a “sleeper”. Ie: someone trying to pretend to be a sceptic trying to steer discussion back to the “lukewarmer” path.
”The fact that you have actually made some detailed effort to do these experiments is very commendable.”
The experiments have been run at a higher pay grade. What is presented is that which is needed to defeat high school teachers. Kids must be able to destroy the Fabian “long march through the institutions”. The experiments have been simplified so other may easily replicate.
”Please tell me your scientific background.”
Thankfully I don’t have a science background. My first job out of high school was computer programming. Then a decade in physical special effects for film and TV. (yes, I have my StarWars credit). But my university degree and current work is in design and engineering –
http://i57.tinypic.com/2q8n9k7.jpg
– welcome to my day job!
I have 3 collage certificates,
Explosives training from the army,
My SCUBA licence,
A pilots licence,
And an honours university degree in applied engineering.
”I noticed Nick never answered your post detailing your experiments.”
That would be because the “racehorse” has no answers 😉
”I do not have the scientific capacity to determine if your calculation of the overall affect of the oceans on the average T of the earth are correct.”
Ancient Chinese proverb –
“Tell me I’ll forget. Show me I’ll understand. Let me do it, I will know!”
David, I want you to know. I have run those experiments and I have data up the warzoo. So what? A few have replicated, but too few. You want to help David? Think empirical experiment. Remember, that’s what the host of this site did with surface stations. If I am in awe of Anthony’s surface stations crowd sourced project, where should you stand?
–Konrad, or anyone for that matter, please help me better understand the process of SW absorption into the ocean, and conversion of that energy to heat.
I think the energy from the photon is supplied by a collision within the water, or any particulate within the water encountered, then said molecule is accelerated: the energy that was stored in the photon becomes kinetic energy in the ocean molecule. Is this close to correct?–
Water has molecular structure so a water molecule is not going to accelerate.
I would say sunlight is heating the ocean like a microwave heats:
“In microwave cooking, the radio waves penetrate the food and excite water and fat molecules pretty much evenly throughout the food. No heat has to migrate toward the interior by conduction. There’s heat everywhere all at once because the molecules are all excited together. There are limits, of course. Microwaves penetrate unevenly in thick pieces of food (they don’t make it all the way to the middle), and there are also “hot spots” caused by wave interference, but you get the idea. The whole heating process is different because you are “exciting atoms” rather than “conducting heat.” ”
With microwave oven the microwaves are bounced around until are absorbed and a difference with the ocean it’s a “one pass thru” until there are absorbed or excited atoms.
So with ocean the “hot spots” would be within first 10 meters of the surface but like microwave also heats further down.
And if instead of meters water to warm the sunlight were to only heat say 1 cm thick layer [say a meter under the water, then you get warmer water fairly rapidly rising due to difference of density.
So the ocean is different then say a shallow pond because the sunlight heats at the bottom of pond which then heats water above it which would concentrate the heating and water would convect upward more rapidly.
So with ocean there is meters of depth being warmed fairly uniformly and this inhibits upward convection. Though there is certainly some upward convection.
Also the vast majority of the ocean surface is very clear and transparent water, when one gets closer to coast one gets less clear water and more plant life in the water- and in such water one would have a greater amount of heating nearer the surface [and have more convection of heat].
Let’s do some tests.
1) I take a bottle of beer out of the fridge to room temperature. My hypothesis is that it will get warmer.
2) I take a beer in a IR opaque bottle from the bridge to the room. My hypothesis is that it still gets warmer because someone would surely use this thermos bottle if it were working.
3) I use a radiotor to heat a big swimming pool room, pool full of water. My hypothesis is that the temperatures of the air and the water remain approximately the same.
Each of your tests rely on conduction of heat as the main gateway for temperature equilibrium.
I have been in many indoor pools where the water in the pool was 72 while the room was nearly 80 degrees, the question is: How long would it take for conduction to give you equilibrium in this setting? It is a great deal easier to heat air then water.
Sure. The temperatures depend on the heating power and volumes of air and water.
Coming back to climate, oceans decrease the temperature range in coastal areas: http://seawifs.gsfc.nasa.gov/OCEAN_PLANET/HTML/oceanography_currents_4.html . The question of this tread is “how the athmosphere heats the oceans”. We get an idea of durations of warmings, when we look at how lakes warm in springs. It takes months because there is not much energy in warm air to heat large amounts of water.
I forgot the sun, in my reply at 4:50 pm.
Minnett’s experiment is flawed. “Figure 1 – The change in the skin temperature to bulk temperature difference as a function of the net longwave [infrared] radiation.”
He is measuring the difference between skin temperature and the 5cm temperature but look at when the vast majority of his readings are taken. During the daytime when clouds cross over. So what happens is the bulk begins to cool as no SW radiation is warming it and relative to the surface the bulk cools so it appears the surface was warming relative to the bulk. But is that really the case? He doesn’t give his actual data so its impossible to know.
If the AGW theory were correct, it would happen at night as much as during the day but his measurements dont seem to show that.
Thanks Tim, a very important observation.
Exactly. Seeing what happens at night when low clouds pass over would be the ideal test for isolating the effects of increased DWIR.
Ulric, see “Cloud Radiation Forcing in the TAO Dataset“.
w.
Willis, I agree with, and learned from your link. However I did not see (perhaps I missed) how that link was relevant to the oceans, and the capacity of LWIR to heat below the surface. That it may is likewise not cogent. The question is to what degree, and to what degree does an equal watt per sq meter forcing of SW radiation have within the oceans, and on the surface.
In fact this…”This likely slightly overstates the radiation contribution of the clouds. This is because, although unraveling the effect on shortwave is simple, the effect on longwave is more complex.” I do not now agree with. The posts just below this are cogent to that question.
Thanks but that wasn’t pertinent. An instance of a jump in DWIR at night from incoming low cloud could provide useful measurements of skin and sub surface temperature changes.
My apologies, Ulric. My understanding was you wanted to see what happens to DWIR when clouds pass over. However, it seems that you wanted something else, which is fine.
However, no matter what you want to find out, the TAO dataset contains all of the information that you need. The buoys collect both surface temperature and air temperatures as well as DWIR, so you should definitely go and see what you can find out. Let us know the results, it should be very interesting.
All the best,
w.
I maintain not all watts are equal. The residence time of energy depends on both the materials encountered, and the WL of the watt under consideration. A law determines this…”“Only two things can change the energy content of a system in a radiative balance; either a change in input, or a change in residence time of some aspect of the energy within the system.”
I have, on the basis of residence time, questioned the veracity of Willis’s proposition that if the watt per square meter down welling LWIR due to clouds, is equal to the same watt per meter down welling SW , sans clouds, then they make the same contribution to earth’s energy budget. I do not think they do. I postulate that the SW radiation will enter the earths oceans to depth, having far longer residence time. I postulate that the LWIR will expend (I am open to how much?) its energy in accelerating the water cycle, reducing insolation to the surface, be lost in evaporation, and released at altitude, to eventually be liberated by GHG molecules, the more numerous, the more likely to be quickly liberated from our system.
Here is a simply analogy on residence time, and how it directly relates to heat capacity…
Numbers are simplified to a ten basis, for ease of math and communication. Picture the earths system (Land, ocean and atmosphere) as a one lane highway. Ten cars per hour enter, (TSI) and ten cars per hour exit (representing radiation to space.) The cars (representing one watt per square meter) are on the highway for one hour. So there are ten cars on the highway. (the earth’s energy budget)
Now let us say the ten cars instantly slow to a ten hour travel time. Over a ten hour period, the energy budget will increase from ten cars, to 100 cars, with no change of input. Let us say we move to a one hundred hour travel time. Then there will be, over a one hundred hour time period, an increase of 990 cars.
The longer the residence time on the highway, the more cars.
Of course the real earth has thousands of lanes traveling at different speeds, and via conduction, convection, radiation, evaporation and condension, albedo changes, GHGs, etc, etc, trillions of cars constantly changing lanes, with some on the highway for fractions of a second, and some for centuries, some slowing down the traffic on certain lanes (The CO2 affect at 15 microns) but at the same time limiting input to other slow traffic lanes, (W/V reducing surface insolation even in clear sky conditions.) Also The sun changes WL over its polarity cycles far more then it changes total TSI. Additionally the sun can apparently enter phases of more active, or less active cycles which last for many decades.
Such thoughts caused me to question the disparate contributions to earth’s total energy budget of SWR verses LWIR.
I disagree. A watt IS “A” watt. If I have 100 watts in a bag,I have 100 watts. It does not matter where they are in the bag, I have 100 watts.
That is how much energy there is in this “system”
The distribution does not change the total. And the total is what matters,verdad?
How big is your bag? If it’s a few microns across, you have a catastrophic amount of energy there. If the bag is a couple of thousand square miles in area and a couple of miles deep, your 100 watts doesn’t amount to much.
Watts are not energy, but power, energy over time, Btu/english hour or kJ/metric hour.
You can’t have Watts in a bag. Watts are a measure of power, not energy. Watt-hours in a bag, or joules in a bag might make some sense. But Watts would be a measure of how rapidly you let them out of the bag.
If you have Watts in a bag let him out he needs to run this blog. 🙂
Not true about a watt is a watt. If true the hottest place on earth would be at the bottom of the antenna of a 50000 watt radio station. But it is not because those watts cannot heat air etc.
Thanks N,n, N, and m. What I am saying is that the EFFECT of a watt on a particular object is dependent on many varibles, but if you are totaling the wattage in a system,a watt IS a watt.
Or do two skinny watts equal a fat watt? (;<)) Please, no fatwas….
David,
You are entirely correct, to our SW translucent oceans, all watts are not equal. For the empirical proof of this see “selective surface experiment 1” posted up thread.
SW radiation has a far greater heating effect in the oceans than can be shown by incorrectly applying S-B equations to translucent materials.
Thanks Konrad, I looked at experiment one. Again I note Nick was non responsive to your experiment. The normal in this discussion is to assume either A, LWIR cannot heat the oceans period, or B, LWIR does heat the oceans. (I always thought the pure black and white assertions unscientific. The question to be answered regarding A is how much of the LWIR energy goes into evaporation, relative to same energy input of disparate SW insolation. Your experiment begins to answer that. Think what you could do with several million dollars in funding available and with the massive astronaut pools to modify and experiment in. Through varying the translucence of the pools you could mimic the oceans varying temperature, placing hundreds of instruments to measure T and evaporation rates, subject the pool to disparate W/L mimicking solar cycle changes, and S/W vs LWIR, etc.
It is easy to estimate (as your experiment demonstrates) that the vast majority of LWIR goes into evaporation, and perhaps logical to assume that the closer the surface is to evaporating an ever higher percentage of the LWIR goes into more evaporation Did you quantify the evaporation rates in your experiments?
At any rate you are welcome to use the acronym GHL, instead of “deep convecting intermittently illuminated SW translucent oceans”, but you will likely have to explain the latter regardless.
Cheers
David A
Thanks Bob – I always value your work – and wish you could get a critical review paper published somewhere in the journals. When researching ‘Chill’ I came across two sets of data that easily showed that ‘global warming’ between 1980-2000 was not global….in terms of ocean heat content (and later redistribution) the warming was held primarily in the northern ocean gyres and by increasing the depth of warm water. What caused the oceans to warm was also clear: a 4% drop over two decades in low-level reflective cloud cover (data from International Satellite Cloud Climatology Project). This is confirmed by the NASA data for SW radiation reaching the global surface – which had an excess of 2-4 watts /square metre over the same period, compared to the 1 watt computed for LW radiation due to GHGs (which I think is computed for the Top of the Atmosphere). Cloud cover rebounded by 2% in 2001/2002, and of course, that is when global temperature rise ‘stalled’.
I would like to see someone gather the regional cloud data, surface flux and upper ocean heat content – this would readily show that GHGs were not the main driver and of course invalidate the pronouncements of the IPCC to that effect. I suppose that is why nobody with the resources to do so, has done so. I don’t have the resources.
Having shown that GHGs are unlikely to be responsible for the warming of the North Atlantic, Lozier comments (perhaps wryly)
‘The overall North Atlantic heat-content change, equivalent to an average increase in the surface heat flux of +0.4 W m–2, is the same sign yet slightly below the lower estimates of anthropogenic-induced radiative heating, ranging from +0.6 to +2.4 W m–2 since 1750 (19). Presumably, other parts of the global ocean and climate system have taken up the remainder of the excess heat input. ‘
Lozier’s paper shows a recent cooling of the sub-polar gyre – in terms of heat content. That means the heat has gone into the atmosphere thus warming northern regions (Arctic meltdown!) but once this heat source is run down, Arctic temperatures will fall and the ice-rebound continue – all except one Arctic temperature record (in Norway) show recent falls, for longer the further one gets from the Norwegian Sea current that brings warm water to the Arctic Ocean. If recent trends continue, the summer sea ice will be back within ‘normal’ bounds within five years. I think that is more likely than continued warming and ice-loss.
Hi Peter.
I am expecting a sharp increase in negative NAO through the next 10 years, which would give a renewed warming of the AMO, and likely more ice loss in some summers than 2007 or 2012. This would fit the natural pattern of the AMO being out of phase with solar cycles when in its warm mode:
http://www.woodfortrees.org/plot/esrl-amo/from:1880/mean:13/plot/sidc-ssn/from:1880/normalise
Electromagnetic radiation is a wave motion which transports energy by means of self-propagating electric and magnetic fields. This is true whether the radiation is infrared, visible light, X Rays, radio waves, microwaves etc.
When radiation strikes the surface of a material one of three things may happen.
1. It may be reflected, in which case it continues in a new direction with its energy conserved.
2. It may pass through the material, like light through a window, radio waves through the walls of a house or like X-rays through your body.
3. It may be absorbed by the material.
Often a combination of these effects apply.
In the third case, when radiation is absorbed, the energy it conveys is also absorbed. Energy must be conserved and, most commonly, the absorption of radiation causes the absorbing material to heat up. However, when radiation is absorbed by the ocean, some of the energy may be used evaporate water and in this case the energy supplies the latent heat of evaporation, instead of heating.
But there is a limit to this. The proportion of energy used for evaporation is governed by the temperature and the partial pressure of water vapour above the water (humidity).
If all the energy of ‘back-radiation’ (324 watts per square metre of ocean) were used for evaporation then there would be a hell of a lot of water in the atmosphere. What is more, water vapour in the atmosphere eventually falls back to earth as precipitation (rain, hail, snow) and we don’t get that much precipitation on this planet. We know how much precipitation we get globally throughout the year; it is equivalent to a latent heat input about 80 watts per square metre of Earth surface. So most of the infrared radiation must be warming the ocean, not evaporating it (this is without even accounting for the effects of direct solar radiation).
.
MikeB says: “If all the energy of ‘back-radiation’ (324 watts per square metre of ocean) were used for evaporation then there would be a hell of a lot of water in the atmosphere…”
Nice try, MikeB. Where in my post or in any of the documents linked in the post did anyone state, suggest or imply that all “the energy of ‘back-radiation’ (324 watts per square metre of ocean) were used for evaporation”? You wasted your breath.
Nice try, MikeB. Where in my post or in any of the documents linked in the post did anyone state, suggest or imply that all “the energy of ‘back-radiation’ (324 watts per square metre of ocean) were used for evaporation”?
Just a few posts above yours it was stated that the ‘vast majority of LWIR goes into evaporation’ and that is a common theme when this subject is discussed here. So I suggest you stop being so snarky and address that point.
David A December 10, 2014 at 1:57 am
It is easy to estimate (as your experiment demonstrates) that the vast majority of LWIR goes into evaporation, and perhaps logical to assume that the closer the surface is to evaporating an ever higher percentage of the LWIR goes into more evaporation Did you quantify the evaporation rates in your experiments?
That 80 watt/m2 is for about 1m of precipitation averaged over the globe for the year. An extra half a watt because of a warmer atmosphere equates to about an extra 7-8 millimeters of rain on average. How do you know that didn’t happen?
Bob,
On average all heating energy of the oceans is due to absorbed sunlight (neglecting the small heating from below the ground). The loss of this energy occurs three ways: conduction to the air (followed by convection), evaporation, and radiation (some direct to space, and some to be absorbed by the atmosphere). All of the loss processes occur at the surface. While there are cases (especially night and higher latitudes) where the sea is colder than the air, on average (long term and globally), the sea is warmer than the air. The only effect of back radiation is to add some energy to the surface, which reduces the net radiation loss. There never is an increase in absorbed net energy, only solar energy is the cause of net energy absorbed. It is the outgoing energy balance that is modified. This reduction in net radiation then requires that more conduction and evaporation occur to maintain the long term balance, which also results in an increase in the average altitude of final radiation loss to space. This increase in altitude in conjunction with the lapse rate is the cause of any increase in temperature. Obviously long term storage and currents make local and shorter term energy levels go out of balance, but I am only referring to long term overall balance.
If the primary result of increased GHGs is increased evaporation, it would seem to me that the change in cloud cover (and direct heating from SWR) resulting from this would trump any warming caused from the returned LWR for long term overall balance.
There is no returned NET energy from back radiation. There is energy, but it results in a reduction in NET radiation out, not a NET gain in. It is in effect radiation heat transfer resistance. Since total energy out has to equal input on average, this results in a required increase in evaporation and conduction/convection. You have to consider NET HEAT TRANSFER not individual sources of energy transfer. The equation for radiation heat transfer has both an outgoing and incoming term, but the net is always from hotter to less hot, and the net radiation out is always reduced (on average) by back radiation.
Leonard W. Says: “…the net radiation out is always reduced (on average) by back radiation.”
I disagree. The net “heat” transfer is reduced, but the amount of radiation leaving the hotter object stays the same depending on its temperature.
MKELLY,
Do you not understand the word NET. It is the radiation out minus the absorbed radiation.
Leonard what stated is true and what you stated is not. The radiative heat transfer equation shows that if two objects are the same temperature then ZERO heat is transferred but both continue to radiated as before based on their temperature.
The oceans are of course a greenhouse material in their own right and largely control the temperature of the air above:
http://www.newclimatemodel.com/the-hot-water-bottle-effect/
Bob’s findings sit squarely within the proposed sequence of events set out in my New Climate Model:
1) Solar activity increases, reducing ozone amounts above the tropopause especially above the poles.
2) The stratosphere cools. The number of chemical reactions in the upper atmosphere increases due to the increased solar effects with faster destruction of ozone.
3) The tropopause rises, especially above the poles altering the equator to pole height gradient.
4) The polar high pressure cells shrink and weaken accompanied by increasingly positive Arctic and Antarctic Oscillations.
5) The air circulation systems in both hemispheres move poleward and the ITCZ moves further north of the equator as the speed of the hydrological cycle increases due to the cooler stratosphere increasing the temperature differential between stratosphere and surface.
6) The main cloud bands move more poleward to regions where solar insolation is less intense and total global albedo declines via a reduction in global cloud cover due to shorter lines of air mass mixing.
7) More solar energy reaches the surface and in particular the oceans as the subtropical high pressure cells expand.
8) Less rain falls on ocean surfaces allowing them to warm more.
9) Solar energy input to the oceans increases but not all is returned to the air. A portion enters the thermohaline circulation to embark on a journey of 1000 to 1500 years. A pulse of slightly warmer water has entered the ocean circulation.
10) The strength of warming El Nino events increases relative to cooling La Nina events and the atmosphere warms.
11) Solar activity passes its peak and starts to decline.
and the process reverses when the sun is quiet.
http://www.newclimatemodel.com/new-climate-model/
Stephen, here is the link for your point 2:
http://www.science.uwaterloo.ca/~qblu/qblu_website/Welcome.html
See the graphic at the top right.
I hope those looking for a solar-temperature correlation read the papers below (some are dead links).
His prediction (well, the prediction based on the mechanism) is holding up well on an annual basis. Bottom line: 50-70 years of cooling ahead.
Thanks Crispin.
Thanks Bob, very interesting. A lot of things to consider.
Figure 4 and this statement:
That’s saying a lot. It may not be the focus of the post but it deserves more attention.
If CO2 is not well-mixed then we know nothing about it’s effect on the climate – our understanding and even measurements would be just wrong.
If CO2 is well-mixed then it has no effect one the climate relative to natural variation – because the ocean’s are big.
Can we have a further post focussing on this disparity?
CO2 is known to be well mixed. There are both temporal and spatial variances in temperature that completely dwarf any effect that CO2 might have in the short term or in a particular location. The typical temperature variation between day and night, or between winter and summer daytime temperatures is vastly greater than the most alarming projections of future climate change.
But the existence of such short term and local effects does not falsify the idea that increasing GHG concentrations could cause a gradual, long-term rise in overall surface temperatures. Because of the large diurnal, annual, chaotic and localized temperature fluctuations that are a natural part of the earth’s system, any such gradual, long-term temperature increase could only be detected by looking at long-term, globally averaged temperatures.
Why globally averaged temperatures?
If the oceans are behaving independently then the global average is meaningless.
That was my point. Either CO2 concentration is being mis-measured or the oceans are… or CO2 is pretty much irrelevant.
But is it well mixed? It was only last month that we were all entertained by NASA Goddard’s simulation run of daily CO2 (natural and man-made) changes around the globe (for a 2005/7 period).
http://wattsupwiththat.com/2014/11/18/who-needs-an-orbiting-carbon-observatory-when-you-can-model-of-carbon-dioxide/
It attracted a lively discussion and some not wholly respectful comments, but also gave rise to the suggestion that short term CO2 differences in quantity and persistence definitely exist between the NH and SH and therefore the corresponding ocean basins. People were , I got the impression , waiting for the new satellite data to resolve that question. Has that appeared?
CO2 is not well mixed at the local level. I have measures >1100 ppm in cities.
Leonard Weinstein’s – if the effect you are describing were perfectly offset by increased evaporation, meaning, I believe, the oceans would experience no greenhouse effect at all, would the heat content of the oceans be significantly different? If so, in what direction and by approximately how much?
The heat content of the ocean is continually increasing slowly as a recovery from the long colder glacial period ending 11,000 or so years ago. There are some up and down trends, but on average it is slowly up.
Thanks Bob. I trust you as much as anyone concerning this. The issue doesn’t concern the total GHG effect, but it very much concerns the issue of how much GHG warming can “hide” in the ocean & hugely affects transient & equilibrium climate responses to forcing.
Mods: I’m beng but had to change my name ’cause my email changed.
I would like an answer to the following.
First though, here is what the UN IPCC keeps telling us; Global warming/climate change is human induced by the release of CO2 into the atmosphere from burning fossil fuels.
OK. Here is the amount of CO2 in the atmosphere from man burning fossil fuels.
Amount of CO2 in the atmosphere = 0.04% which = 0.0004 of the atmosphere.
Man-made CO2 is 3% of that which = 0.0004×0.03 = 0.000012.
Burning fossil fuels is about 50% of that.
Therefore: The amount of man-made CO2 from burning fossil fuels is about 0.000006 of the atmosphere.
How does this amount of CO2 override natural climate change?
AND.. that; the Sun, Milankovitch cycles; continental drift; volcanism and earthquakes are irrelevant,
“Amount of CO2 in the atmosphere = 0.04% which = 0.0004 of the atmosphere.
Man-made CO2 is 3% of that which = 0.0004×0.03 = 0.000012.”
The 3% figure is nonsense. 0.04% of the atmosphere corresponds to about 800 Gtons carbon. We’ve burnt about 400 Gtons.
Hi Bob, another interesting post. You ask whether you have missed any other factors that can impact the distribution of ocean heat and I can think of at least three:
First the impact of changes in solar activity on the site of formation and warming of ozone in the stratosphere and its effect on surface pressure, largely through changes at 65 S in the Southern Ocean where due to the trajectory of Earth around the Sun some 90+ W/m2 are input in the southern summer than the northern
http://solarphysics.livingreviews.org/open?pubNo=lrsp-2007-2&page=articlesu11.html
http://www.space.dtu.dk/upload/institutter/space/forskning/06_projekter/isac/wp501b.pdf
http://climatechange1.wordpress.com/2011/09/19/climate-disaster-declining-rainfall-rising-sea-levels/
http://joannenova.com.au/2013/10/solar-effects-seem-to-shift-wind-and-rainfall-patterns-over-last-3000-years-in-chile/#
http://hockeyschtick.blogspot.com/2014/03/new-paper-finds-another-solar.html
Ozone depletion trumps greenhouse gas increase in jet-stream shift
Second the Lunar cycles, especially the Saros cylce that affect the flow of ocean and atmospheric tides with each 18 some year cycle linked to the time it takes for this southern ocean heat to reach the northern latitudes where it has the effect you describe with a probable link to ENSO cycles.
LOD and Climate Cycles Geophys. J. R. aslr. SOC(.1 976) 46,555-573
http://tallbloke.wordpress.com/2014/11/15/evidence-that-strong-el-nino-events-are-triggered-by-the-moon/#more-19477
http://hockeyschtick.blogspot.fi/2014/10/new-paper-finds-lunar-tide-cycle.html
Third, is also the effect of solar activity on the solar insolation at the surface.
http://hockeyschtick.blogspot.com/2014/05/new-paper-finds-large-increase-of-solar.html
http://hockeyschtick.blogspot.fi/2014/06/new-paper-finds-solar-control-of-clouds.html
This is just a sampling of papers in these areas. Perhaps you or others could comment on the relative importance of these factors to that of changes in the Trade Winds due to convective effects.
“Based on the findings at RealClimate, that rise in infrared radiation could only warm the sea surfaces by a little more than 0.002 deg C since 1979. Yet, looking at the global sea surface temperature data, Figure 2, the surfaces of the global oceans warmed more than 0.3 deg C from 1979 to 2013, leaving about 93% of the ocean surface warming unexplained.”
Just using those two sentences, it calculates at 99.3%, not 93%. Am I missing something? Anyone?
The back radiation does not directly result in ocean heating. Only the absorbed solar energy heats the ocean. Since the oceans cooled during the last glacial period, they are slowly warming this interglacial.
Is it 0.002C a year?
No chance, not enough energy.
David in Texas,
“Just using those two sentences, it calculates at 99.3%, not 93%”
The two sentences are nonsense. The RC graph shows the difference between surface and 5cm depth, not SST. SST can warm without changing that difference.
Bob
“INFRARED RADIATION CAN ONLY PENETRATE THE TOP FEW MILLIMETERS OF THE OCEAN SURFACE AND THAT’S WHERE EVAPORATION TAKES PLACE”
///////////////.
It is important to get it right. It is microns, not millimetres. That is a substantial difference.
SEE: http://scienceofdoom.files.wordpress.com/2010/10/dlr-absorption-ocean-matlab.png
Whilst the above plot suggest that approximately 60% of LWIR is absorbed within 3 microns, one has to bear in mind that that is perpendicular depth, ie., LWIR, interacting on a perpendicular basis, whereas DWLWIR is omni-directional such that as regards DWLWIR bearing in mind that much of DWLWIR will have a small grazing angle, without doing the maths, it is easy to see that we are talking about approximately 80% of all DWLWIR is fully absorbed within just 3 microns of ocean!
Even on K & T’s average figures for DWLWIR of 333 watts per sq.m, that is a heck of a lot of energy.
As I have been commenting on this site for many years, if DWLWIR is capable of sensible work and is absorbed in accordance with the optical absorption characteristics of LWIR in water there is so much energy being absorbed in the first few microns that it would result in more than 15 metres of rainfall annually (which is not happening) UNLESS the energy being absorbed in those few microns is dissipated to depth at a speed greater than that which would drive evaporation.
The problem is what is the mechanism,by which the energy is dissipated, and at what rate is it dissipated?
The energy cannot be dissipated to depth by conduction, since the energy flow/flux is upwards at the very top of the ocean, and unless we are wrong in our understanding as to how conduction works, the energy absorbed in the first few microns cannot swim against the tide of the upward energy flux. SEE: http://disc.sci.gsfc.nasa.gov/oceans/additional/science-focus/modis/MODIS_and_AIRS_SST_comp_fig2.i.jpg .Thus conduction cannot be the mechanism..
Two other mechanisms are put forward:-
First wind, waves and swell are said to mix the energy, but there are problems with this. (i) It is a slow mechanical process, (ii) there are periods/conditions where there is all but no wind, and waves etc to perform the mixing, eg BF3 and below.. (iii) in very severe conditions (BF8 and above) the top of the ocean becomes a divorced layer of wind swept spray and spume which would act like a LWIR block and energy absorbed in the water droplets that form this wind swept spray/spume would power evaporation and power the storm clouds raging above the ocean well before the divorced layer reunites with the ocean.
Second there is ocean overturning but this is not only a slow mechanical process, it appears to be a diurnal process. It is difficult to see how this process can dissipate the energy absorbed within the first few microns at a rate fast enough to prevent rapid and copious evaporation from the very top of the ocean.
Life would not be possible on planet Earth if the absorption charcteristics of solar in water were similar to that of LWIR. We are fortunate that sunlight penetrates to depth, with muuch of the solar energy being absorbed at a depth of 50cm and below such that the energy being received from the sun is dissipated (and thereby diluted) over a substantial volume of water so that it can slowly heat the ocean.
Something which cannot go on forever, won’t. It seems you are ultimately focusing only on heating mechanisms. But, at some point, that energy has to be released back again, or the oceans would boil. It cannot simply all, or mostly, go into the depths somehow.
I have not thought about this as deeply as you, but my initial reaction would be that perhaps surface wind carries most of the energy away.
I am definitely in favor of the idea of human-induced ocean warming, as it could help stave off the coming cold period, and maybe even postpone the next ice age indefinitely. But it would seem enormously expensive so doesn’t look to practical at this time.
Bob,
In your section “WHAT CAUSES THE WATER TO “PILE UP”, INCREASING OCEAN HEAT CONTENT?” you describe another process similar to the one that causes El Nino. This indicates to me that there may be a number of charge-discharge oscillator processes that can cause sudden changes in atmospheric temperature. There may even be areas where cold water is sequestered and is suddenly discharged to create a drop in temperature. (I know, cold water sinks, but humor me).
Thanks, Bob. An excellent post, lots to learn.
The NAO index can be seen at the KNMI:
http://climexp.knmi.nl/data/icpc_nao.png
“Rising” OHC “recorded” by Argo should be called the “Josh Willis” warming.
Incredible that the world’s best ocean temperature data is in the hands of a PhD student with a talent for data manipulation.