Essay by Eric Worrall
h/t Charles Park – A judge just cancelled an enormous judgement against the City of Oakland in California – but the reprieve may be temporary.
Oakland might not owe coal company hundreds of millions after new court ruling
A federal judge in Kentucky ruled a bankruptcy court’s judgment, which could have put the city on the hook for hundreds of millions of dollars, was improper.
by Eli Wolfe Nov. 24, 2025, 4:37 p.m.
Things were looking bleak for Oakland last month after a Kentucky bankruptcy judge ruled that Oakland interfered with a coal developer’s efforts to build an export terminal, forcing them into insolvency.
The judgment put Oakland on the hook for potentially hundreds of millions of dollars in damages – money the cash-strapped city would have virtually no way of covering without asking voters to approve new bond measures. It also handed a major victory to the coal company, Insight Terminal Solutions. On Monday, the New York Times published a gloomy article speculating that Oakland was headed toward bankruptcy.
But the city won a reprieve on Friday after a federal district judge who reviewed the case found that the bankruptcy court overstepped its authority.
In a two-page order, Judge Benjamin Beaton ruled that the bankruptcy court lacked authority to enter a final judgment on core disputes in the case. He also found that the judgment only dealt with liability, not damages, which means that it wasn’t really a “final” judgment.
…
Oakland lost its other legal battle with developer Phil Tagami, who leads OBOT. A state court granted OBOT the right to keep and extend its lease to the city-owned land to restart the terminal project. Next Tuesday, the City Council will approve a partial settlement to pay OBOT $700,000 in attorney’s fees and costs. The city has also agreed to perform “certain administrative items” relating to the construction and development of the terminal.
Read more: https://oaklandside.org/2025/11/24/oakland-coal-company-bankruptcy-judgment-vacated/
…
Reading the rest of the article, the original judgement could have forced the city to issue bonds to cover their own recklessness. But the battle doesn’t appear to be over yet.
Oakland’s attempt to overturn their own lease to the coal terminal company signed in 2013 led to a substantial corporate bankruptcy, Insight Terminal Solutions, and the parties who took over the lease appear to be gearing up to recover costs and damages. In addition, Oakland’s administration appears to have learned nothing – they appear intent on pursuing further legal action, legal action which could incur even greater costs for the residents of Oakland.
The city’s climate crusade against coal appears to have substantial popular support from the residents of Oakland. I guess we’ll see how strong that support is if the city of Oakland is forced to appeal to voters to help pay all the legal costs and adverse judgements which could be coming their way.
Good luck getting any money out of that dump.
Yeah, the company should just go ahead and build the terminal out of old RVs, blue plastic tarps and tents.
The problem is not that the voters are going to get stuck with the bill.
The problem is the the alarmist climate narrative is collapsing everywhere except with voters.
Oakland reminds me of Afghanistan. If the population and rulers were different, it’d be a nice place.
Afghanistan ain’t a nice place.
That’s why it is so hard to conquer – even with high tech weapons vs Birkenstock AK47’s it upheld its status as graveyard of empires.
The last time it was really successfully and longlasting conquered was during the islamic coloni…expansion – and only because bhuddism turned its population into defenseless pussies who got slaughtered by traditional off the mill suni-Islam (now falsely called Islamism for all wrong reasons )
who came there to kill all the “but” for not believing in god in west india and neighboring regions that were predominantly bhuddist back then.
The polytheistic Hindhus were mostly spared as they turned out to be phantastic tax slaves.
Aside from a few hundred thousands here and there who got routinly massacred by Timurid and Aurangzeb who is said to have developed a routine to kill 100k annually.
For a quick Oakland temperature check, I went to:
https://www.extremeweatherwatch.com/cities/oakland/average-weather-by-year. The Tmax and Tmin data from 1900 to 2025 are displayed in a long table. Here is a brief summary:
Year——Tmax—–Tmin—–Tavg Temperatures are °F
2025——64.1——49.1——56.6
1900——65.5——50.2——57.8
Diff.—— -1.4—— -1.1—– -1.2
In 1900, the concentration of CO2 in the air was ca. 300 ppmv
(0.59 g CO2/cu. m.), and by 2025, it had increased 424 ppmv
(0.83 g CO2/cu. m.), but there was no corresponding increase in temperature at this bay side city. Instead there is slight cooling.
This empirical temperature data falsifies the claims by the IPCC the CO2 cause global warming and climate change. Furthermore, the city of Oakland has no justification for denying the construction permit for the terminal.
Thanks, Harold, for bringing that interesting site to my attention. However, your link doesn’t work. I think this is what it should have been:
https://www.extremeweatherwatch.com/cities/oakland/average-temperature-by-year
In this case, “Tmax” means the average of the daily highs (averaged over the entire year), and “Tmin” is the average of the daily lows (averaged over the entire year).
(The roughly 15 or 16°F difference between the two is approximately the average diurnal temperature swing. That relatively small diurnal temperature swing is typical for coastal cities; inland cities usually see diurnal temperature swings averaging closer to 20°F.)
However, they’ve revised their Tmax and Tmin numbers slightly compared to the numbers you cited, and they now longer show “Tavg” (average temperature for the entire year)
They used to show Tavg, instead of Tmax and Tmin. This was from 2022:
https://web.archive.org/web/20221104195624/https://www.extremeweatherwatch.com/cities/oakland/average-temperature-by-year
(Unfortunately, that’s the only copy of that webpage which The Wayback Machine had saved.)
These are Tmax and Tmin from their current page, and Tavg for 1900 from the 2022 page. Two of the numbers match yours, and the others are changed; I bolded the changed numbers:
Year——Tmax—–Tmin—–Tavg
2025——64.1——49.1——
1900——66.5——50.2——58.4
Their main page for Oakland is here:
https://www.extremeweatherwatch.com/cities/oakland
Oddly enough, on some of their web pages they round to tenths of a degree, and on others to a whole degree. They have individual pages by year, but no average temperatures for the years, and on these webpages all the numbers are rounded to whole degrees:
https://www.extremeweatherwatch.com/cities/oakland/year-2025
https://www.extremeweatherwatch.com/cities/oakland/year-2024
…etc…
https://www.extremeweatherwatch.com/cities/oakland/year-1900
What I think of when I hear “Tmax” and “Tmin” is different from the numbers you cited. I think of the highest and lowest temperatures of the entire year. They have those, too, but rounded to whole degrees:
Oakland Tmin (annual lowest temperature) is here:
https://www.extremeweatherwatch.com/cities/oakland/lowest-temperatures-by-year
Oakland Tmax (annual highest temperature) is here:
https://www.extremeweatherwatch.com/cities/oakland/highest-temperatures-by-year
Their graphs tells the story better than just citing a few individual years. Here’s Tmax:
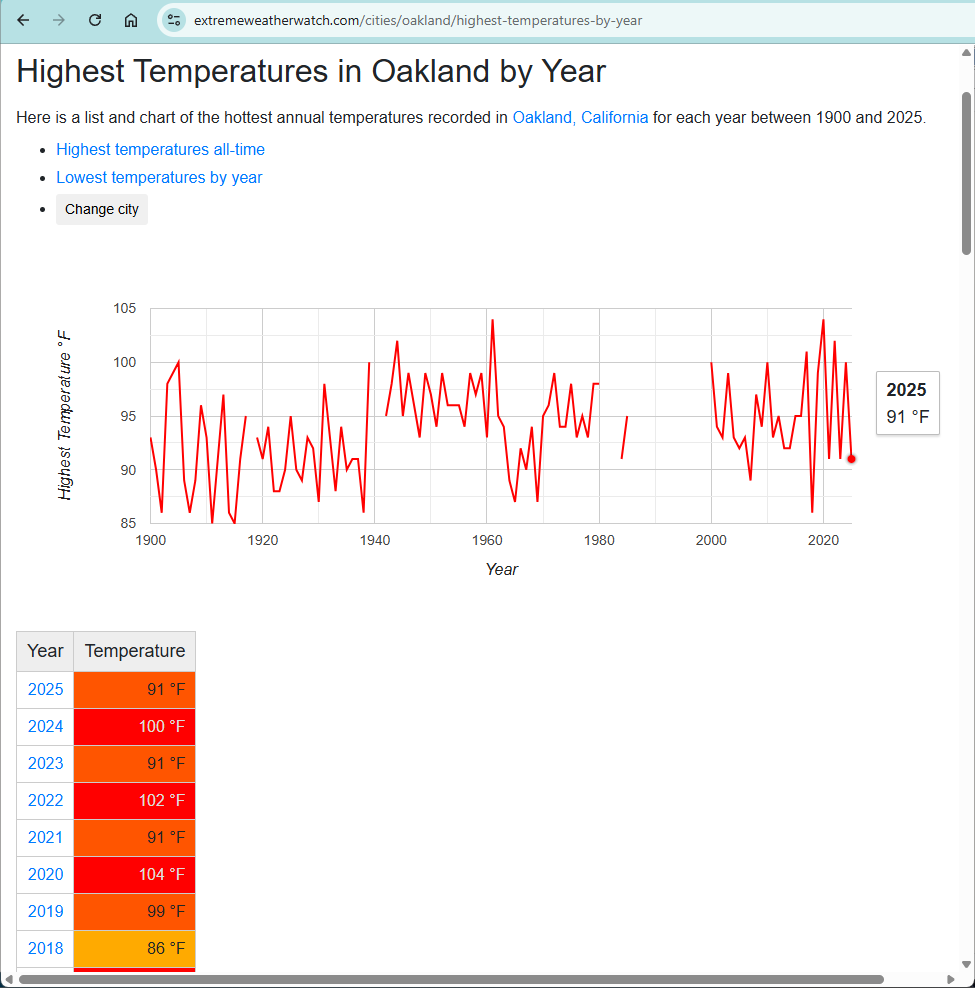
As you can see, whether temperatures have been rising or falling depends on the starting year you choose. From eyeballing that graph…
Since 2000 annual high temperatures in Oakland have shown little trend.
Since 1965 annual high temperatures in Oakland have been generally increasing.
Since 1942 annual high temperatures in Oakland have been generally decreasing.
Since 1900 annual high temperatures in Oakland have been generally increasing.
Thank you for pointing out the error in the URL. I just posted a correction in a reply to myself.
When I examined the Oakland temperature data file I found that two weather stations were used for preparing the Tmax and Tmin table. These are:
1948-2025: Oakland Metro International Airport
1894-1947: Oakland
If you click on the a “Location” box, a map showing the location of the weather station is displayed.
I considered preparing two tables of the temperature data, but finally decided to use just 1900 and 2025 data. Presumably, the 2025 data is valid to Nov. 30.
How did you prepare the graph? Is there tool for preparing graphs at this site? I noticed in the graph there is shift in temperatures at 1940 from lower values to higher values, which is most likely due to the use data from two different weather stations.
I would like to think that use of temperature data could help put an end to the draconian climate agendas in the UK, Germany, Australia, New York and California, for example. Unfortunately, nothing is going to happen until EPA Administrator Lee Zeldin issues an announcement rescinding the Endangerment Finding of 2009 for carbon dioxide. Everyday I check the Federal Register for the announcement. Interesting times are ahead.
BTW: I noticed time stamp for your comment is 1:00 AM. You must be an owl.
Dave, you have to check out the late John L. Daly’s website:
“Still Waiting For Greenhouse” available a http://www.john-daly.com.
From the home page, page down to the end and click on:
“Station Temperature Data”. On the “World Map”, click on
“Australia”. Finally, click on “Adelaide”.
Shown in the chart (See below) is a plot of the average annual temperature from 1857 to 1999. In 1957, the concentration of CO2 in air was ca. 280 ppmv (0.55 g CO2/cu.m.) and by 1999, it had increased to ca. 368 ppmv (0.72 g CO2/cu.m.), but there was no corresponding increase in air temperature at this port city. Instead there was slight cooling after 1940. The average annual temperature in 1999 was 16.7° C.
To get update on the recent temperatures in Adelaide, I went to:
https://www.extremeweatherwatch.com/cities/adelaide/average-temperature-by-year. Here is the recent average annual temperature data:
Year—-Tavg Temperatures are °C
2024—-17.4
2023—-16.7
2022—-16.9
2021—-16.6
2020—-16.7
1999—-16.9
Note how invariant the temperatures were and are. This empirical data falsifies the claim by the IPCC the CO2 causes warming of the air.
John Daly found over 200 weather stations located round the world that showed no warming up to 2002.
NB: If you click on the chart, it will expanded and become clear. Click on the “X” in the circle to return to the comment text.
Thank you for pointing out the error in the URL address. I always try to make sure there are no errors when posting the URL. For some readers this must have caused some confusion and problems. I’ll post a reply to myself and post the correct URL.
When I first examined the Oakland temperature data file, I noticed that data from two weather stations was used for constructing the Tmax and Tmin table. I considered preparing two tables, but decide to use just the 1900 and 2025 data.
However, how many months of 2025 was used for the Tmax and Tmin data?
Here is the weather station info:
1948-2025: Oakland Metro International Airport
1900-1947: Oakland
If you click on the Location Box, a map appears with the location of the weather station.
How did you prepare the graph with a plot of the Tmax data? I been searching the website for data plotting tool,
The posted URL is incorrect: The correct URL is:
https://www.extremeweatherwatch.com/cities/oakland/average-temperature-by-year.
Oakland CA is a port city.
Oakland CA has no coal deposits.
Oakland CA burns no coal to generate electricity.
Coal is legal to mine, legal to ship and legal to sell.
That should be the end of discussion about coal in a city that runs an international seaport.
Caterpillar needs to build larger tractors so that Oakland can be pushed into the ocean. That would remove the blight and allow for prosperous development.
Nah. Just some well placed explosives in the San Andreas Fault should take care of a lot of California.
/Humor.
Under modern Progressivism, it’s always assumed that someone else will be getting the bill. When local property taxes spike because of this absurd virtue signaling by elected officials, attitudes will change.