Richard Willoughby
Summary
This article has a close look at the progress of Australia’s electrical grid transition to weather dependent generating sources. The analysis mostly focuses on South Australia and its leading role in this transition. Rooftop solar has lagged grid scale wind in the transition but rooftops are rapidly gaining market share and are bound to make grid scale wind and solar obsolete before they recover their construction costs.
The high unit cost of grid sourced electricity is driving the de-industrialisation of the economy with many large consumers now gone and the remainder on government welfare that cannot continue indefinitely.
Rooftops are observed to have an unrivalled advantage over grid scale weather dependent sources by having captured demand. Every rooftop solar installation reduces the opportunity for intermittent grid generation to earn income.
Introduction
Australia is making a pitch to host the United Nations Conference of Parties in 2026. This will shine a light on Australia’s claim to be the global super power of “renewable energy”. Fittingly, Adelaide is the proposed host city and is the State Capital of South Australia (SA). SA is one of the regions connected to the so-called national grid that rightly claims to be the largest interconnected grid in the world. SA is a relatively small component of the National Electricity Market (NEM) with a peak demand up to 4GW.
For the year to mid October 2025, SA generated 72% of its electricity from weather dependent generators (WDGs); both wind and solar. There are no hydroelectric generators in South Australia.
Rooftop Solar
Australia is unique amongst G20 nations in having the best solar resource combined with mostly mild winters and warm to hot summers. This means sunlight is truly ubiquitous all year over the mainland States while the high population centres do not experience snowfall. SA is well placed to make use of the solar resource as indicated in Chart 1, which is taken from OpenNem for a 24 hour period ending 10pm 15 October 2025 where the bright yellow bathtub shape is the rooftop solar component and the darker yellow is the utility scale solar.

Table 1 sets out details of the colour coding in Chart 1 and should be viewed together.

Some finer points of the chart that should be noticed is the dotted line that indicates zero on the scale. SA is able to import and export to Victoria. So when the internal generation exceeds the internal demand the export is shown as a negative value on the chart. It is apparent that on this day, rooftop solar was supplying the entire internal demand of the State around midday. Utility scale WDGs were able to produce some output by exporting. The purple region above the dotted line indicates imported generation.
The bottom line of the table indicates all WDGs contributed 68.2% of the electrical energy for the day. The internal generation Netted 47GWh; just under 2GW average generating power. It is important to note the values for “Curtailment”. Utility solar curtailed 2.5GWh while generating 3GWh. Wind curtailed 0.9GWh while generating 9.9GWh. On the day, the combined output of the utility WDGs was well under the generation from rooftop solar of 14.6GWh.
Tuesday 15 October 2025 was a good day for rooftop solar in SA with it supplying all the demand in the State at lunchtime. On weekends now, rooftop solar is being exported on a sunny day and both utility scale WDGs fully curtailed between 11am and 2pm. Through the peak of summer, air-conditioners will increase the demand and there may not be sufficient rooftop output yet to meet the midday demand. Similarly, the reduced rooftop output in winter means other sources take a larger share of the demand. So the winter generating curve still has some resemblance to the “duck curve” but early summer generation now looks like a gaping chasm on weekends and a bathtub on week days.
SA Electricity Generation Transition
Chart 2 expands the time frame for the SA Region to this century in quarterly periods.

At the beginning of the century, SA used gas and coal to generate electricity. Coal ended in Q2 2016. Wind first appeared in Q3 2007 and rooftops were measurable by Q3 2016 by their lunchtime impact. Utility scale solar was producing by Q1 2018. The peak quarterly wholesale generation of 3886GWh occurred in Q3 2010 and declined to 3231GWh in Q3 2025. The last decade for just the WDGs is shown in Chart 3.

Chart 3 includes 2nd order polynomial trend lines that give some indication where each source is heading. There is 792MW of installed utility scale solar that has levelled off around 250GWh for quarterly volume corresponding to capacity factor of 14.4%. Wind generation is showing a reduced rate of climb and is unlikely to sustain above 1800GWh over a year; corresponding to a capacity factor of 29.7% for the 2763MW of installed capacity. Rooftops have an accelerating trend and Q4 2025 may be the first time they overtake utility scale wind for the quarter on total energy sourced.
Wholesale Market Price & Revenue
Chart 4 provides the quarterly average wholesale price in SA for utility scale wind and solar.

The price for utility scale wind and solar track each other reasonably well. The trend is reasonably flat apart from peaks caused by technical issues and the slump during the Covid shutdown. Since 2023, there is a clear annual price cycle. The utility solar price collapsed in Q3 2024 as rooftops removed demand. Grid wind prices were somewhat higher but still exhibit the annual cycle caused by the increasing impact of rooftop solar.
Chart 5 combines the generator output and market price to give the quarterly wholesale revenue for the SA utility WDGs.

Apart from the Q2 2022 period when the SA-Vic interconnector failed, the quarterly revenue peaked in Q1 2019 at AUD146M for wind generators and AUD22M for utility solar. In 2024, annual wholesale revenue for utility solar was AUD42M and for wind AUD413M.
SA Retail Electricity Price
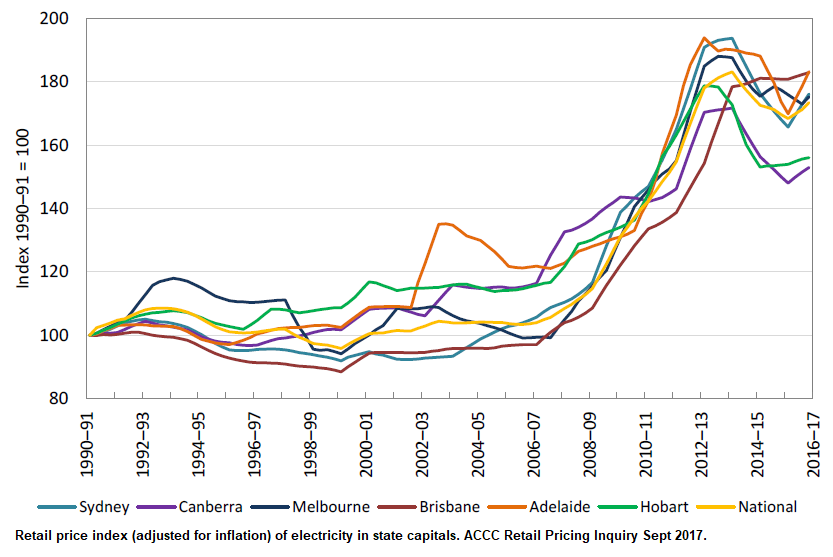
Given the growth in utility scale generation in SA and the stabilising of the wholesale price in the region, it would be expected that retail price would be reflecting these trends. Chart 6 using data from “Vinnies” shows a different story:

Over the past decade, as WDGs have grown to dominate the electricity market share in SA, the retail price of electricity has continued on an upward trend. July 2025 price averaged 52c/kWh, including the service charge, based on annual consumption of for a 6000kWh.
There are a number of reasons for this retail price trend.
- The SA region has invested in synchronous condensers to add inertia and voltage stability to the grid that add to transmission costs.
- The grid has expanded to cater for numerous geographical sources of generation.
- The distribution system had to be upgraded to cater for high reverse energy flows. This continues.
- So-called “renewable energy” attracts a premium termed large scale generating certificates (LGCs). LGC price has fallen this year down to AUD11/MWh but were AUD83/MWh in 2016 with a gradual downward trend. The retailers are required to pay for LGCs from WDGs so the cost is in addition to the wholesale price. The higher the proportion of “renewable energy” the higher the subsidy.
- The cost of stability services from battery and gas generators that remain connected is not included in the wholesale price but is in the retail price.
- The market manager has rapidly rising costs due to the complex nature of managing such a complex market that needs to be in balance every second of every day with increasing exposure to common weather events. Weather fronts are major risks to grid stability.
- The volume in the wholesale market is declining so higher costs being applied to declining volume creates a double hit for unit prices.
- There are still essential generators burning gas in SA and lignite fuelled generation imported from Victoria. There has been no reduction in the peak demand but they have much reduced volume to recover their high standby costs so charge high unit price when they can to stay profitable.
Consumers become Prosumers
SA is a very good example of de-industrialisation in the making. Manufacturing of Mitsubishi motor vehicles ended in SA in 2008. Manufacture of Holden motor vehicles ended in 2016. The Port Pirie lead smelter and Whyalla iron blast furnace are both on government welfare because the high cost of electricity makes them uneconomic.
Faced with high prices for grid sourced electricity, 50% of SA households and many businesses are now making their own. This means the remaining consumers bear the already high, yet increasing, cost of the grid and are also on government welfare to help with the burden.
Aldi Australia makes a claim that their stores are run on 100% “renewable” energy. Image 1 is an example of one of their stores showing the rooftop solar array.

Their stores certainly have large solar arrays but they are connected to the grid and there are no battery installations of a size needed to run the stores for a day or so without grid connection. So they may produce 100% of their energy on average but are still reliant on fossil fuels for essential electricity.
Aldi is also marketing household rooftop systems now. They offer a 6.6kW solar array and 20kWh LFP battery combination for AUD9,000 installed including government rebate. Such a system installed anywhere on mainland Australia on a north facing, pitched roof would supply 15kWh/day for 350 days per year. That amounts to 105,000kWh at a unit cost of 8.5c/kWh over a 20 year life. The panels would require cleaning of lichen and leaf litter every year or so but otherwise maintenance free.
Discussion
Australia’s electrical grid is in transition one rooftop and household battery at a time. It is most apparent in SA but the rest of the country is catching up. Chart 7 shows the trend in generating sources across the entire NEM:

It is clear that the fossil fuelled generators are in decline and WDGs are on the increase. Not quite so apparent is that the wholesale market demand peaked in Q3 2008 at 54.9TWh. It was down to 52.6TWh in Q3 2025. So the whole NEM suffers the same price vortex as SA with steeply rising costs distributed across reducing demand.
Australia no longer manufactures motor vehicles. All of Australia’s remaining smelters are on government welfare.
Despite the increasing grid cost of electricity, the average household cost for electricity has not increased in the past 10 years. This is because four million households have invested in rooftop solar and get most of their energy at no ongoing cost. The Federal Government battery rebate from July 1st 2025 has spurred Australian households to install almost 1GWh of household batteries in the first 3 months. September 2025 recorded the highest monthly installation of rooftop solar capacity so far.
Conclusions
Grid scale WDGs are now stranded assets. That is clearly evident for utility scale solar in SA that competes directly with rooftop solar. On most weekends now there is zero opportunity for utility scale solar to generate revenue. On Saturday 11 October the SA wholesale price was negative from 2am to 6pm – the entire generating window for utility scale solar. Wind has more opportunity to earn revenue but that is also being eroded. In 2024, the $800M invested in SA utility scale solar produced revenue of $43M in the wholesale market. In 2024, the $5bn invested in SA wind produced $413M revenue in the wholesale market. This is insufficient revenue to justify the capital expenditure.
The two potential positives on the horizon for the grid scale WDGs are Snowy 2 and the higher capacity interconnector to NSW but they only delay the inevitable demise of non-essential grid generators.
Rooftop solar has a number of distinct advantages:
- There is no requirement for land acquisition.
- There is no requirement for Environmental approval.
- There is no requirement for FirstPeople’s approval.
- No new transmission or distribution assets are required.
- Most importantly – rooftop investors have captive demand.
Australian households are voting with their money and the various governments’ offers of other people’s money to make their own electricity. They are removing their demand from the grid. Household batteries improve internal utilisation of solar energy and further reduce the opportunity for utility scale WDGs to generate revenue. The grid has upward spiralling costs with falling wholesale demand thereby accelerating its economic demise. All the remaining large electricity consumers are on welfare and their closure is imminent. Each departure reduces the opportunity for grid scale WDGs to earn.
This was predicted a decade ago and should now be clearly evident to any observer. The existing grid developed through economy of scale. The solar panels on a roof are the same as those used in any utility solar plant. The basic cells used in a household batteries are the same cell used in grid scale batteries. Wind in Australia goes missing for a couple of weeks each year, usually in June, so would require enormous storage to make it an on-demand source of energy.
It will not be easy to rebuild Australia’s industrial base but Australia has the lowest cost fuel in the world and only the climate scam is in the way of making good decisions regarding energy.
Over the next decade, rooftops will force the demise of grid scale WDGs. They are not renewable or sustainable. They are stranded assets with no future.
The cost of grid electricity could be reduced immediately by requiring all bidding generators to be dispatchable and removing the mandated retail theft. That means the existing coal plants would run at 100% capacity so their unit price could come down dramatically while still being profitable and the margin between retail and wholesale price would reduce.
In the long run, rooftop solar and low cost battery storage may be an economic option for suburban Australia. The suburban grid could still have economic value by bleeding in energy when the batteries are getting low while sharing output from neighbourhood solar and battery assets.
The Author
Richard Willoughby is a retired electrical engineer having worked in the Australian mining and mineral processing industry for 30 years with roles in large scale operations, corporate R&D and mine development. During this period, Richard represented Australia’s large electricity consumers on the first systems development group for the National grid. A further ten years was spent in the global insurance industry as an engineering risk consultant where he developed an enduring interest in natural catastrophes and changing climate.
A couple of questions because I have no invested interest and little knowledge of these things.
” 50% of SA households ” Does this mean “houses” rather than, say, an apartment dweller? It seems to me that a family in a 10th floor apartment is stuck with the electricity from an increasing costly grid.
“The panels would require cleaning of lichen and leaf litter every year ..”
Do home owners do this? I’m not in AU. However, one neighbor has had panels on a barn near the house. I can see them and know the owners. Another neighbor has panels on a special-build pole structure. The first is 10 years old, the 2nd just five years. Neither has been cleaned – as far as I know. Maybe our winter snows clean the panels as it slides off. In my neighborhood, I think dust would be an issue rather than lichen or leaf litter.
My guess is that cleaning of solar panels should be the least of all problems,
Some Nanocoating – Lotus-Style and drones should be able to do the job with little effort.
The angle they’re installed at also helps remove some dirt/debris especially during rains
I’m in south east Oz, I have three sets of panels, the oldest is over 15 years and has only been cleaned once in that time. The measured performance of the panels has not degraded due to any other cause, (excluding aging, as forecast). I find that the rain, when it does eventually fall, is sufficient to clean the dust off the panels.
No lichen, I guess the panels are too hot in the sun for the moisture loving lifeforms to take hold. This could be a problem in some climes but not where I am.
The only reason to clean panels would be IF the performance drops off. This is easily measured using the modern equipment that they connect to. All you have to do is note the power generated at midday, and compare it to a similar month the previous year. Remember to allow for hot days being less efficient than cold days and the task is easy. Of course, you’ll need to take a few notes throughout the year(s) so you have something to compare your current reading to. This is cheap compared to paying someone to crawl onto your roof.
And for the inquisitive, after I did clean the panels, the output didn’t noticeably improve, apparently I was just performing the task for exercise. Thankfully I didn’t break anything, me inclusive. So maybe cleaning, (where I am located), is a scam.
The 50% includes all households. There are now government subsidies for apartment buildings to install panels and also incentives for rental property owners to install panels.
Most of the suburban areas are leafy and leaf litter can collects under the panels and lichen attaches around the bottom of panels in the greener regions and requires removal because it grows up the panels. Dust usually gets washed off in rain.
There are about 12 million households in Australia. 4M now have panels. South Australia has a higher proportion.
You can use Google Maps to view the roofs in suburban Australia to assess the coverage. The average sized array being installed is 10kW.
10kW… That’s huge. I’m off grid and only have 8kW and never have problems, not even with A/C running, kettles, toaster, etc.
Maybe I’d need more if I could sell to the grid.
And of course, since I’m typically fully recharged by 9:30am at this time of year, then my COP is at best, useless by definition. So do I have too many panels? Nope, on the darkest/cloudy days it takes till 3:00pm to be fully charged, (and that’s in winter).
But 10kW, that would be around 50m2 of panels. Or around 25-30 large panels. I wonder how all those black surfaces and their heating potential is being addressed in the climate
scamsmodels.I did a quick calculation a few years ago.
If we put solar panels with albedo of 8% on a white roof with albedo 80%, the global warming potential per kwh of electricity produced by the panels was about the same as the no feedback warming response from burning coal to produce an equivalent amount of power.
In other words, the whole crazy project is a complete waste of time unless we stipulate that solar panels can only be placed on darker rooves.
10kW is now the average array size in Australia.
A good portion of the capacity is wasted because of shading; not being optimised for winter collection and over-voltage curtailment . Also the majority of Australian homes are subject to coastal weather conditions where solar resources are impaired by onshore advection.
Last month my neighbour had 10kW solar and 27kWh of batteries with 10kW inverter capacity installed for $13,000 ($21k before OPM). The solar and battery was all done in a day with 4 installers arriving in two vans with all the gear to be installed. In that time, they also removed a swamp cooler from the roof and disconnected the gas central heating then installed air-conditioning units. The air-conditioning units arrived a few days before and were a separate cost to the solar/battery but used the same firm that specialises in these conversions.
Another neighbour has a roof designed for solar with a north facing pitch of 50 degrees – built 5 years ago. He has 10kW on one section and room for three times that if he wanted to export or use more.
As time goes by, Australian houses will be designed to maximise rooftop solar by north facing sections having steeper pitches. I also think that councils will be taking greater notice of the solar resource available to houses through tree lopping programs.
My neighbour has panels on his shed, and was trying to clean them the other day.
They were actually covered with mould and bird droppings and “stuff” growing.
He spent several hours, and they still aren’t really clean.
I haven’t touched mine in the 3 years they have been there…
… but with the rain we have had, hopefully they are clean enough not to need scrubbing yet.
Both my neighbour and I have tested dirty panels. It is undetectabke on 5-6KW panels but was dstectable on our individual 200-300W car roof panels.
I have to wonder where this is all headed. It sounds like a disaster in the making to me.
Oz already has serious problems. Jo Nova tracks them nicely (also other things).
https://joannenova.com.au/
Australia is becoming a service economy currently making a pitch for wealthy Chinese tourists.
Victoria was first to push the “events” economy but other States are now doing the same. Adelaide is aiming to host COP31 (an event). Brisbane will host the 2032 Olympics. Melbourne has the F1 motor race, the MotoGP this weekend, Melbourne Cup in a couple of weeks, the Australian Open tennis in January and other events not as well known.
Australia earns its living mainly from a handful of people working in the iron ore exporting industry and coal exporting industry. But tourism associated with events is also a big earner.
Maybe you could tell us how much money is likely to be made by the Olympics. Or how much is made for the GP in Melb each year. The last I heard was that the money would just flow in by the billions but strangely it never shows up on the gate takings, the hotels or restaurants, it’s just ‘in-kind’ money, awarded based on the future earning potential that media exposure can bring.
On this same basis? How much is a machete hacking or a stolen car driven through a shopping centre worth?
Rick,
Good article and I note that you keep chasing the domestic market for proof that the grid based solar factories are not making a profit, (covering costs), etc. In SA, this is easily done, they have next to no industry. Have you had chance to look at areas where there are industrial consumption or even large retail, something that operates over the weekend at least.
From my house I can see at least 5 solar factories and they are planning for another 5, all are taking up prime agricultural land. The reason for the grouping is solely because that is the route that the grid connection power lines took all those years ago. It makes you wonder if the current dilemma of the farmers in Vicdanistan, (who are fighting to stop power lines going over their farms), can see that this is just the first step. Build the grid connector, then take the land for solar factories.
With regard to the industrial users, eg smelters, have you had any chance to review their green energy promises, just to see who they will be buying green energy from overnight? It could be worth a laugh to undo their green washing with a dose of reality. I wonder if you could even keep an aluminium pot line molten from one day to the next using solar alone. My guess would be no.
I’m guessing that the production processes for heavy industry products (smelters etc) were designed with the availability of 24 x 7 uninterrupted grid-standard electricity supply?
Knobble the power supply, and it’s back to the drawing board for production processes?
I doubt anyone at CSIRO has taken a close look at the evolution of the grid and the significance of distributed rooftops in combination with the demise of large consumers. The distributors were aware of the possibility in 2016 based on their submissions to the Finkel enquiry. AEMO are now acknowledging the importance of rooftops and distributed batteries with new rules around virtual power networks in the pipeline.
Albanese’s battery rebate is probably more due to the “Solar Citizen” lobby rather than technical recognition of the growing importance.
Boyne smelter in Queensland has secured a large government hand out to eventually close their Gladstone Power Station but I have doubts that Boyne can be run off solar/battery without significant economic support. At least with current battery technology. It might look better with the new CATL Naxtra cells. Queensland has postponed closure of coal fired power stations.
Tomago smelter in NSW is heading for closure if the current position on government support does not change.
Portland smelter in Victoria has been on welfare for a long time now.
I noted in the text Port Pirie and Whyalla are now on welfare.
Point Henry smelter closed in 2014. Kurri Kurri smelter closed in 2014.
I do not know full details of the support that the Tasmaninan smelters, Risdon and Bell Bay are getting. I do know Bell Bay has long received a rebate for its role in demand management and they are presently seeking Federal welfare.
There is a widely held belief in governments that the retail price will magically come down but this is difficult to achieve with growing complexity, growing investment, falling demand and need to maintain high essential generating capacity.
Private investors are no longer interested in grid scale wind and solar unless they are guaranteed a return on investment. So they are now seeking welfare to build projects and Blackout Bowen is obliging through the new AEMO project contracts. No existing grid scale wind or solar will be rebuilt without new welfare.
I wonder how long before we have pricing for solar and wind like they do in the UK. They get paid for producing AND for not producing due to any reason, including if the power lines are at capacity.
Maybe Bowen is going to start this sometime next week, just as soon as someone has read the big words to him from your article. You really have to use simpler terms if you want the government to take notice.
Blackout already has that covered. Private investors want guaranteed return with no market exposure and that is what is happening. I expect it is the basis of the Belt and Road talks with China. Typically build, own and operate contracts where the contractors carry the construction risk and the agreed capital cost has a guaranteed return. The contracts are commercial in confidence so only the parties know details. Our grandchildren will be supporting the aged in China.
WDGs are now viewed in a similar light to transmission assets. They get built with a guaranteed return on investment. So output is irrelevant. That is why I believe more people need to understand that all the money being spent on grid scale WDGs is a total waste. And not because they are part of the climate scam but because they are stranded assets.
And the replacement smelting capacity is built in China, which also makes the solar panels. Australian serfdom approaches.
High density housing doesn’t go well with rooftop solar. High electricity use like shopping centers/malls/businesses aren’t prime users either. That leaves urban and rural single family homes as the targets. Even those must have batteries for night and private generator backup for emergencies (which I doubt are counted in the fossil fuel use). Once again we took a reliable energy delivery system and replaced it with an unreliable and costly, especially to the home users, system that must have panels wholly replaced at intervals. And they’re proud of that?
The Aldi example shows what supermarkets can do. Covering car parks with rooftop solar provides power generation and weather protection. This is often seen in suburban Australia now:
https://pvstructures.com.au/our-structures/
We have them here in CA as well covering some parking lots at Hospitals and Event Venues but I have noticed our local Major E/G Utility hasn’t covered THEIR parking lots with the nuisance panels.
I believe the cost effectiveness of such systems is rather lower than ground mount solar. A quick search suggests capacity is around 2kWp per space at a cost of £9-12,000 – substantially above even rooftop solar. More virtue signalling (especially in the UK where solar capacity factors are so low).
The fact that even an Electric Utility doesn’t utilize the tech in a similar fashion speaks volumes to its efficacy/cost
Richard, thanks for an account with many interesting facts , well presented. Naturally, I don’t agree with everything.
“LGC price has fallen this year down to AUD11/MWh but were AUD83/MWh in 2016 with a gradual downward trend. The retailers are required to pay for LGCs from WDGs so the cost is in addition to the wholesale price. The higher the proportion of “renewable energy” the higher the subsidy.”
But the lower the LGC price, the lower the subsidy. And the LGC price is way down (as intended), so the total subsidy is much less than it was. This is a downward force on prices.
“SA is a very good example of de-industrialisation in the making. Manufacturing of Mitsubishi motor vehicles ended in SA in 2008. Manufacture of Holden motor vehicles ended in 2016. “
Decline of industry in SA has been going on for a long time, for strong reasons that have nothing to do with WDGs. Both of those automotive events happened before WDGs came along.
Yes – the price of LGCs is now a small factor. But its reduction obviously has not offset all the other upward pressure on prices.
One obvious reason in retail price increase is the need to recover most grid costs across reducing output. The consumers pay for the LGCs and the number of consumers is declining as prosumer numbers increase. So the remaining consumers carry a bigger burden. AEMO’s cost has increased dramatically over the last decade. Their costs are a retail component.
As I stated average household cost of electricity across Australia for the last decade is flat. But those without rooftop solar are hit really hard.
With regard motor vehicle, If the two SA smelters were not on government welfare, they would be gone as well – I think Whyalla may be off line at present and future ever more doubtful.. This rot started with Howard’s RET in 2000. So upward price pressure has been in the pipeline since then and Rudd07 took it to new levels. Businesses need investment to remain competitive and The Australian investment horizon was horrible for manufacturing by 2008 when Mitsubishi pulled out. Cost of electricity would have been a significant factor.
Ultimately SA and Australia is heading for only distributed solar and small scale batteries with no wholesale demand. The large geographical grid does not offer much value then. A country of small electricity consumers drenched in sunlight does not need an electricity grid interconnecting most of the country. All that copper can be used in BEVs!!!
This linked chart bears out the retail price reduction in the 1990s (early years of the national grid) then the gradual increase after the RET and the Rudd acceleration.
Put a line where NEM kicked into being…1998. Once rubber hit road, prices take off.
I represented large customers in the early days of the national grid. The State monopoly on power generation and transmission was eased from the early 90s. The increases in price followed the introduction of the RET in 2000 thereby mandating consumer theft to pay for WDGs.
What happens to the solar panels when it’s time for the roof to be repaired or replaced? Won’t the solar panels have to be removed first, then replaced when the roof work is complete? I doubt the roofing contractor will even touch the roof before a solar panel specialist disconnects and removes the solar panels.
My current tiled roof is 33 years old and has not needed repair other than a few branches falling and cracking tiles. So far the branches have not damaged panels.
My solar array are 15 years old and still hit rated power mid summer – they were made in Germany.
If there was a reason to do roof work, I would likely upgrade the panels as well. The new technology has higher efficiency and make better use of dispersed sunlight so would probably give a good return n investment by allowing me to go fully offgrid and avoid the connection fee.
Given the long life of most roofs, roof repair time would be a logical time to assess if the solar technology had moved on to make an upgrade .worthwhile.
Is anyone tracking the supply chain to check for forced labor components from western China, powered by an array of coal plants? Not looking is a key part of lobbyist tactics and their pals.
“It will not be easy to rebuild Australia’s industrial base but Australia has the lowest cost fuel in the world and only the climate scam is in the way of making good decisions regarding energy.”
A big ‘only’.
Australia has no fossil fuel “reserves”. Less than 30 days of any type/form. A shipping delay suffucient to close bowsers and see how chaos will reign hard and fast…. climate change will be instantly forgotten.
Did you miss coal and natural gas somewhere ?
I don”t see household rooftops doing much unless batteries are included because extisting street transformers can only handle so much. Same for adding EVs. Changing all them transofmers out to modern two-way appropriately sized ones is hugely expensive and time consuming. Keep them entirely offgrid as personal choice is fine.
because extisting street transformers can only handle so much.
One of the factors driving the gap between wholesale price and retail price is the added cost of getting lots of energy back up the system. South Australia has proven they can run solely on rooftops and also send rooftop into Victoria but that also required upgrading existing distribution assets.
The attached chart is my own example where I have added a heat pump hot water and air-conditioning before disconnecting gas and installing a battery to make better use of solar resources internally and also less reliance on the electrical gris.
Ahhh yes, free batteries and free use of your neighbors back yard would make solar more viable….
I wonder what your peak imports and exports look like. They would I suspect be significantly higher.
Clearly a look at microgrids is needed. What resource is needed to balance a suburban neighbourhood, and how could that be provided?
We are metered on 30 minute intervals so the actual peak does not show up in the metering.
To go off grid in a typical household you need Mayne 20kW of inverter and 40kWh of batter. That backed with 10kW of panels favourably aligned for inter will do the job.
Since there is an existing grid, it makes economic sense to use it but if the grid charges go up dramatically then people will just disconnect. Those with solar and battery are already saving a bundle over using energy from the grid so they just need to take the next step.
there is no problem with rooftop solar, other that it intrudes on energy company profits. if my house generates 50% of it’s needed electricity, when the sun is shining, it’s as if i built a smaller house.
energy companies made profits 30 years ago, too.
It is getting much harder for energy companies in SA to make a profit. South Australia is heading toward a wholesale market that sells no energy. And it is feasible for houses to go completely offgrid if the connection fee increases dramatically to restore their profitability.
The grid has upward spiralling costs with falling wholesale demand thereby accelerating its economic demise. All the remaining large electricity consumers are on welfare and their closure is imminent. Each departure reduces the opportunity for grid scale WDGs to earn.
…which naturally means the most costly shy away first-
Victoria’s renewables transition dealt another blow after major offshore wind project axed – Jacinta Allan | Wind Farm News
leaving ever more costly taxpayer slushfunding to keep the fantasy alive given the deplorables are getting uppity about destroying their local land based ambience.
PS: Get out yer red capes and undies folks-
Jim Chalmers touts Australia as a ‘renewable energy superpower’
No private investors with eyes open would want to be coming into Australia’s electricity grid. They can see the inevitable demise.
Those that are coming in have to be bribed by guaranteed capital returns. So taxpayers on the hook for a long time in the future.
I don’t know, it looks to me like solar could be useful for maybe six hours a day. I don’t see any reason to get excited about that when fossil fuel and nuclear can provide plentiful useful power 24/7. Why are we even talking about solar and wind?
Only USA under Trump does not need to be talking about solar and wind. However the climate scam is alive and well in the rest of the developed world.
The point of this article is to show how rooftops are able to service the dwindling demand in Australia and dominate the grid scale WDGs because they have captive demand.
Rooftop solar are the future in de-industrialised Australia. They win the race because they have captive demand. The exciting part is that there is no future for grid scale WDGs in Australia. They are clearly economic black holes.
No bold leader has yet emerged in Australia to make the simple steps to prioritise essential generation only possible from coal and gas plants in Australia.
Rick, what you said makes sense however solar can’t sustain a house or anything else without significant backup. I am not opposed to individuals having their own solar power so long as they pay for it themselves, so long as it is not connected to the grid in other words it must be stand alone. Fossil fuel and nuclear operate 24/7 less down time for maintenance, they are compatible with the grid, they can be turned up or down, you can have huge plants for populated areas and smaller plants for widespread rural areas. This makes way more sense.
Agree that the only place for any WDG is off-grid. But Australia is rapidly destroying its grid and rooftops are the fastest way to that end while limiting your exposure to the high costs of the grid.
So if Australia is going to decarbonise the grid, rooftops are the only viable route and an interconnected grid is waste of money.
The easy solution is don’t decarbonize.
After US EPA Administer Lee Zeldin rescinds 2009 CO2 Endangerment Finding (EF), whatever will Premier Anthony A. and the Canberra Climate Commissars do? Will they eat humble pie and cancel their draconian climate agenda? Or will they ignore the announcement of the recission of the EF?
Will the newspapers publish the EPA announcement of the recission of the EF and thus inform the people that they are now liberated from the reign of the Climate Commissars and that they no longer have to worry about the emission of greenhouse gases from the use of fossil fuels?
The EPA decision has some distance to go yet and is only significant in the USA. TDS runs deeper in Australia than the USA. By that I mean there would be about 70% of the population who cannot bear to watch Trump.
On the evening last week when Trump signed the Gaza peace deal, their ABC ran a story on Trump using his office to increase his wealth.
So whatever the US EPA does, it will not impact Australia. The UN would need to declare the whole climate scam a scam and withdraw all agreements on CO2 before Australia makes a sensible move on energy.
If Trump made a deal with the UN to dump all its climate doom mongering for some funding deal then that would probably be significant for Australian energy policy.
Here is what the people need to know:
At the Mauna Loa Obs. in Hawaii, the concentration of CO2 in dry is 425 ppmv. One cubic meter of this air has mass of 1.29 kg and contains a mere 0.83 g of CO2 at STP.
In air at 21° C and 70% RH, the concentration H2O is 17,780 ppmv. One cubic meter of this air has a mass of 1.20 kg and contains 14.3 g of H2O and 0.77 g of CO2. To the first approximation and all thing being equal, the fraction of the greenhouse effect (GHE) due to H2O Is giving by:
GHE=moles H2O/(molesH2O+molesCO2)=0.79/(0.79+0.018)=.98
This calculation assumes a molecule of H2O and a molecule of CO2 each absorb about the same amount out-going long wavelength IR light emanating from the earth’s surface. Actually, H2O absorbs more IR light than CO2.
The above empirical data and calculations falsifies the claims
by the IPCC that CO2 causes “global warming” and is the “control knob” of “climate change”. The purpose of these claims is to provide the UN the justification for the distribution of donor funds, via the UNFCCC and the UN COP, from the rich countries to help the poor cope with the alleged harmful effects of global warming and climate change. At COP29 in Baku, the poor came clamoring for not billions but trillions of funds. Unfortunately for them, they left the conference empty handed with no pledges of funds from the rich countries.
After US EPA Administer Lee Zeldin rescinds the 2009 CO2 Endangerment Finding, he will put and to the greatest scientific fraud since the Piltdown Man.
The challenge is: How do we inform the Australian people and especially the politicians of the above?
Hmmm….there’s a little problem with your “first approximation”. It needs to include absorption coefficient as a second order approximation, and changing concentration of water vapor with altitude as a third factor,
….CO2 is 420 ppm from surface to Top of Troposphere while water vapor drops from your 1.8 parts per hundred to 4 or 5 parts per million at Top of Troposphere.
The net result is: CO2 is about 20% of GHE not 5%…(Actually the high altitude CO2 concentration relative to water vapor marginally helps radiate more heat to outer space from higher altitudes),
Your main point about CO2 having much less effect than people believe from reading the MSM journalist doom peer-reviews is, of course, correct. But if you were to face a semi-knowledgeable doom scroller in a debate…it might not go well for you…
Harold The Organic Chemist Says:
I am writing this short explanation of the greenhouse effect so everybody and especially the politicians can learn about it, and in particular learn that the UN and IPCC perpetrating a great scientific fraud. I forgot mention that 71% of the earth’s surface is covered with H20.
Using the qualifiers “To the first approximation and all things being equal takes into account what you said and is not necessary to mention it.
I can easily win any debate with any “doom scroller”.
Shown in the chart (See below) is a plot of average annual temperature in Adelaide from 1857 to1999. In 1857, the concentration of CO2 in dry air was 280 ppmv (0.55 g CO2/cu. m.), and by 1999, it had increased to ca. 370 ppmv (0.73 g CO2/cu. m), but there was no increase in air temperature. Instead there was slight cooling. Thus, the empirical data shows that CO2 has no influence air temperature because there is just too little of it in the air.
The chart was obtained from the late John Daly’s website: “A Still Waiting For Greenhouse” avail at:
http://www.john-daly.com. From the home page, page down to the end and click on:
“Station Temperature Data”. On the “World Map”, click on “Australia”. There is displayed a list of stations. Click on “Adelaide” and the will be displayed a chart with a plot of the average annual temperature. Use the back arrow to return to the list of stations. Clicking once more brings back the World Map. John Daly found over 200 weather stations that showed no warming up to 2002.
Be sure to check the chart for Brisbane and the chart for Darwin which shows a slight cooling.
NB: If you click on the chart. it will expand and become clear. Click on the “X” in the circle to return to comment text.
Harold The Organic Chemist Says:
RE: Infrared Spectrum of Real Air
Shown in Fig 7. (See below) is the infrared absorption spectrum of a sample of Philadelphia inner city air from 400 to 4000 wavenumbers (wns). There are some additional peaks for H2O down to 200 wns. In 1999 at the MLO the concentration of CO2 in dry air was ca 370 ppmv. The concentration of CO2 in the city air was not measured.
The active greenhouse range is from 400 to 700 wns. Note how narrow and small the CO2 peak is.
It is absorbing little out-going long wavelength IR light. Note the abundance of H2O peaks and especially the tall peak H2O peak. The spectrum in your Fig. is computed and is very different from that of real air.
Fig 7. was taken from the essay:
“Climate Change Reexamined” by Joel M. Kauffman
The essay is 26 pages and can be down loaded for free.
NB: If you click on Fig. 7, it will expand and become clear. Click on the “X” in the circle to return to comment text.
So on that particular day solar supplied a surplus from 10am until 2pm but not so much from 6pm until after 7am. In fact, over night they Imported (at peak price rates) almost as much as they exported (at off peak Low Pricing) AND needed Gas to step up heavily,in the evening when Wind was practically nonexistent. If gas (Fossil Fuel Generation) were no longer available they would have been n in a world of hurt overnight or would be importing 80% of their overnight needs at peak demand pricing
Yes, the graph does not show what the state demand was like that day. We have to guess what the imports and exports were.
The table shows the data for the day. Overall WDGs supplied 68% and rooftops almost half of that.
The point of the article is that rooftops are eliminating the market for grid scale WDGs so they are stranded assets and it is a waste of money building more of them.
One problem with depending solely on rooftop solar is dealing with hailstorms, tornadoes and hurricane force winds. These events would affect quite a number of people so there would be a lot of competition for getting replacements. The same issue applies to utilities relying on utility scale solar.
California and other states are now changing rate schedules to separate fixed charges from incremental cost of generation.
At my location 37S, the ideal angle for solar panels to maximise winter input in order to minimise the battery size is 60 degrees. We do not get large hail here but a panel at 60 degrees will deflect large hail stones. The lower latitudes will have shallower optimum angles but any angle above 45 degrees will deflect even large hailstones rather than the impact destroying the panel.
So far, there are very few who have considered what a solar/battery only power system should look like. The entire focus has been on just supplement the grid. The point of the article is that grid scale WDGs are now useless and Australia’s grid is already uneconomic, which is leading to de-industrialisation.
The solar installations have engineering standards and they are consistent with the cyclone rating for the particular location.
Victoria has always separated export and import and other States now do the same. However it makes no difference when you have a battery.
Once a battery goes in, exports are lowered and imports are zero most of the time.
Thanks for the info on solar installations and hail – don’t get much hail in San Diego county, but other parts of the US can get some monstrous sized hail. I’d also like to see a tornado proof solar installation.
Rooftop solar makes more environmental sense than solar farms. And I would agree that utility scale WDG’s don’t make much sense.
I’ve been watching the battery market with respect to solar installations – the battery would need to be enough to power the house in the 4 to 9PM “Solar Duck” time. I would also want a transfer switch or equivalent so the battery can power the house during a power outage
Recent home battery installations aim for around two day supply. So they rarely import electricity.
In Australia, you can count on 2 hours of full sunshine equivalent over two days so a 48 hour battery mated with lots of panels can power a house for 999 days out 1000.
If you only have enough battery capacity to load shift to evening peak, there is good chance you will import power on consecutive overcast days.
In my case, at 37S I have a 5kWh battery working offgrid and another 5kWh working on grid. Even now with the solar zenith south of the equator I am still drawing from the grid some days. Last week I drew 6.7kWh from the grid but had exported 14kWh so a bigger battery would have reduced export and probably resulted in no import.
In your scenario process industries like smelters need to be supplied by low cost, right sized, highly reliable generation. Grid connection an optional extra, probably more cost effectively supplied by emergency diesel/gas generation. The cost curve for coal and gas fired generation would imply probably sharing among a number of industrial ventures. SMRs might provide an alternative. They would not offer significant backup for other consumers, to lower costs by maintaining high and stable utilisation and not participate in grid transmission and stabilisation and balancing costs.
The claim that a 6.6kW north facing Aldi system will only supply 15kWh/day for 350 days per year seems low!
A quick look up a solar calculator for Adelaide suggests yes an average of 16kWh/day in June (winter), but it’ll rise to an average of 39 kWh/day in January (summer), with over 10,000 kWh produced over the 365 days.
For Darwin it’ll be loosely the reverse – an average of 24 kWh/day in January (still summer), and 35 kWh/day in July (also winter), with over 11,000 kWh produced over the 365 days.
Is this 15kWh/day for 350 days rather than 365 days, thus a typo, an approximation of the average minimum people can expect, or …?
It is with regard serving demand. There is a big difference between what you can expect from the system to what the system can serve on any particular day.
There will be 15 days a year when a 6.6kW/20kWh system will not be able to supply 15kWh. It might do it ion the panels were favourably aligned for the lowest sun days.