From NOT A LOT OF PEOPLE KNOW THAT
By Paul Homewood
As promised, I am returning to the Met Office’s State of the UK Climate Report:

The press release made this claim:
Climate change is causing a dramatic increase in the frequency of temperature extremes and number of temperature records the UK experiences.
New analysis of observations shows that extremes of temperature in the UK are most affected by human induced climate change. This means the UK is seeing, on average, more frequent periods of hot weather, bringing challenges for infrastructure, health and wellbeing.
Using an example of 28°C, the frequency of days reaching this threshold has increased nearly everywhere across the UK. Where in the 1961-1990 averaging period only London and Hampshire recorded six or more days over 28°C, by the latest decade (2014-2023) this has spread across much of England and Wales, with frequencies in the south east increasing to over 12 days each year in many counties.
.
Their methodology of counting days when a temperature of 28C has been recorded somewhere has no statistical significance whatsoever, because the sites are changing all the time. We know that they have introduced dozens of poorly sited weather stations in recent years, which regularly feature as daily record highs, and are often two or three degrees higher than nearby sites. We also know how UHI has boosted temperature readings in recent years.
For the methodology to be reliable, it needs to be based on a fixed set of stations. I have therefore analysed temperatures at Radcliffe Observatory in Oxford. The chart below counts the number of days when temperatures were over 28C:

https://climexp.knmi.nl/data/xgdcnUK000056225.dat
.
On the face of it, I see little of concern.
The summer of 2018 sticks out with 23 days, the same number as in 1911 and 1995. There were 21 days in 1976 as well.
In most summers we may get about five days or so of hot weather; why should this be a cause of alarm?
Moreover Oxford is a hotter place than it was a century ago because of UHI. I can’t claim any scientific basis for what follows, but if we count the number of days >27C for the years up to 1970, and then add on the number of days >28C since 1970, we get this:

This assumes, of course, that Oxford’s temperatures since 1970 have been increased by 1C because of UHI. This is an extremely simplistic assumption!! But I don’t think it is an unreasonable one in principle. My guess would be that the UHI effect since 1911 is probably a lot more than 1C.
The graph shows that there is no trend in hot days, certainly not since the mid 19thC.
1911 appears at the top of the list, bearing out the news reports at the time which graphically described the severity of the summer long heatwave, not only in Britain, but also in France.
But other years in years past also stand out, such as 1826 and 1868.
But even if there is no UHI in Oxford, which would be a ridiculous claim, the worst that is happening is that we now get days of 28C, which 150 years ago might have been 27C instead.
And it is certainly not bringing challenges for infrastructure, health and wellbeing.
What is a heatwave?
The World Meteorological Organization defines it as five or more consecutive days during which the daily maximum temperature surpasses the average maximum temperature by 5 °C (9 °F) or more.
UK met office no longer use the WMO definition, they have changed it in 2018 to:
“A UK heatwave threshold is met when a location records a period of at least three consecutive days with daily maximum temperatures meeting or exceeding the heatwave temperature threshold, dependant on location.” (currently that is just 28ºC max)
https://www.metoffice.gov.uk/weather/learn-about/weather/types-of-weather/temperature/heatwave.
I am pretty sure that the UK has not had a heatwave meeting the WMO definition for many years, maybe decades.
Can you imagine their reaction to a repeat of 1976?
…or 1959? It may not have been hot in Oxford but it was in Bristol.
…thus demonstrating the very local nature of some of these phenomena.
Just as “all politics is local”, all climate is local.
Or even the 1930s.
Recently it has become clear depending on the subject history began in 2011, 2013/14, 2016, 2020
Only the climate and reparations freaks venture back further.
Didn’t we all die in that 1976 heat?
Go and watch old video footage or, if you can, read newspaper articles. Most of them full of happy families on beaches or in parks enjoying themselves. It is the complete opposite now. Fair enough, skin cancer is a danger but apart from that, focus is on all the bad stuff. And 1976 wasnt exactly a great economic time now, was it?
UK “Heat” Wave
Is there a more absurd phrase?
Does it mean “not miserably cold and rainy”? Or is it “somewhat less miserably cold and rainy”?
I wonder what a heatwave in the Antarctic would be like. ! 😉
Cold.
“… five or more consecutive days during which the daily maximum temperature surpasses the average maximum temperature by 5 °C (9 °F) or more …” OR “five or more consecutive days during which the daily maximum temperature surpasses the average maximum temperature “for each day” by 5 °C (9 °F) or more”. That is, does each day have to be 5C hotter than the average for that day, or just some average over the five days, or for the decade, or for 30 years?
EACH of 5 consecutive days must sport a high temperature that exceeds the average high for the date by 5C or 9F.
Not only did the UK Met Office change it from 5 days to 3 days regarding an heatwave definition. They also changed the temperature threshold for most regions of the country from 29ºC to 32ºC max to now only 28ºC max for England.
This makes the theshold easier to be reached for both temperature and length. Therefore can try and claim heatwaves are happening more while being very dishonest at the same time.
“(currently that is just 28ºC max)”
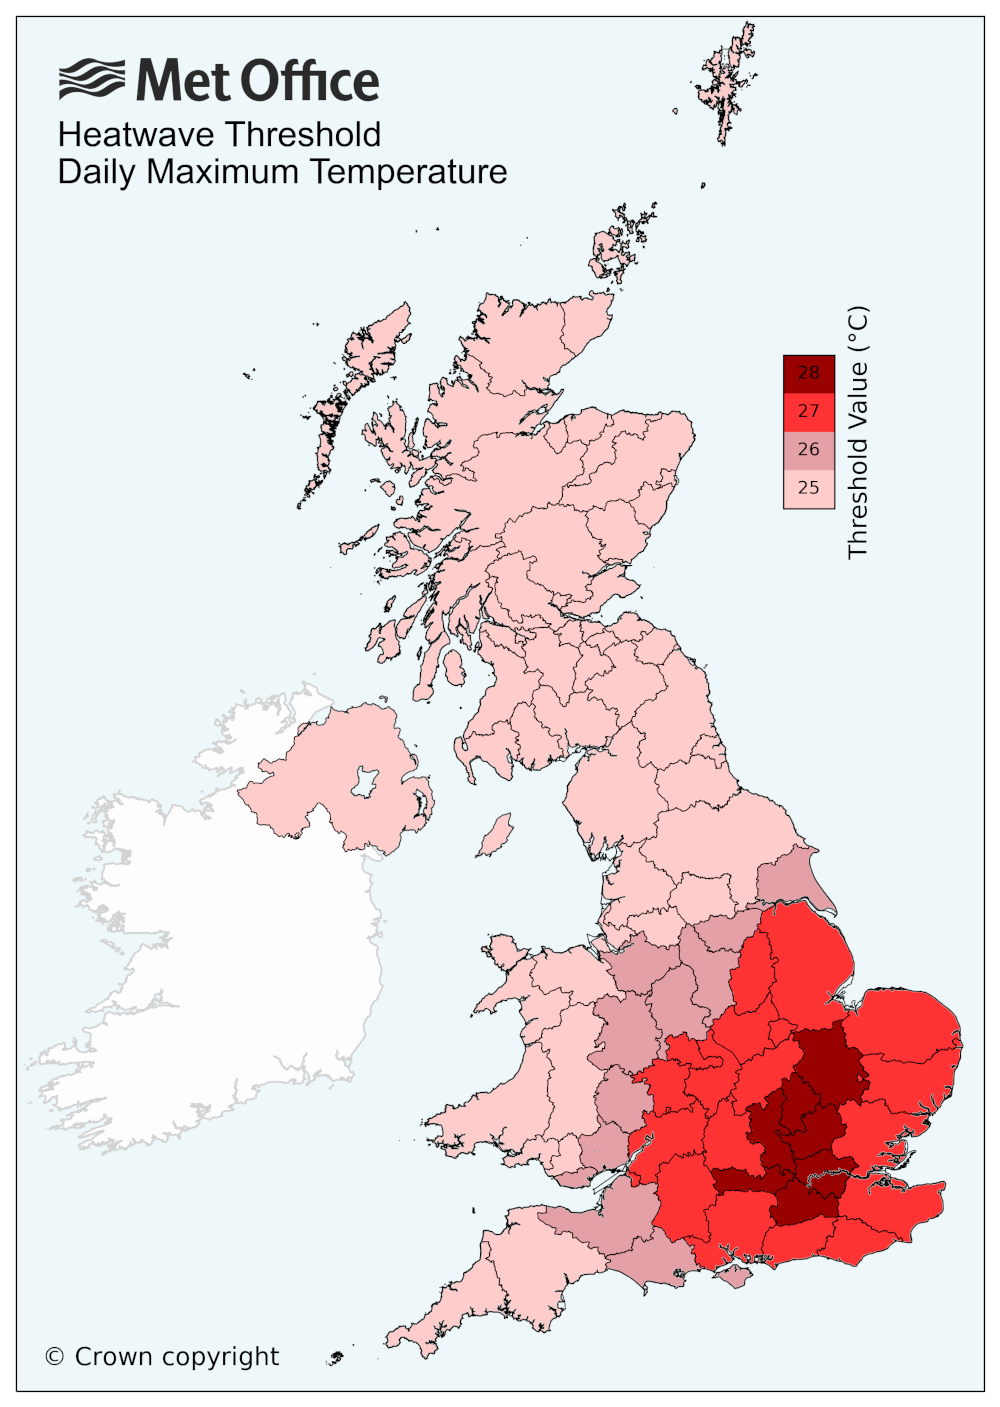
That’s only for around London, ...
The majority of the UK has been dropped to 25ºC & they still struggle to declare a heatwave.
See –
Are Heatwaves Getting Worse?
No.
Next.
There was once an honourable profession – meteorology – but that was before the rot set in.
Only the agenda obsessed (e.g. Jim Dale etc) are now allowed to express their worries that extreme climate change will only get worse unless we all immediately stop doing any stuff we enjoy.
Meteorologists who are not agenda obsessed are, apparently, “dangerous” says Mr Dale and should not be allowed to speak publicly at all.
History says we have been here many times and it doesn’t end well.
https://x.com/aaronshem/status/1803852309048259009
Heatwaves are only slightly increased in duration & temperature (primarily by raising nighttime temps). The greenhouse effect on heatwaves (particularly max temperature) is negligible.
Climate change actually reduces the weather dynamics that cause heatwaves.
There is a decrease in the blocking events which cause them with increasing global average temperature (though solar activity may be a bigger factor.)
Warming moves the ITCZ north & stabilizes the polar jet stream. This is probably why the weather is so much less extreme in 23/24 than it was when we had nearly identical weather patterns in 1877/78.
https://agupubs.onlinelibrary.wiley.com/doi/10.1029/2022GL100811
https://iopscience.iop.org/article/10.1088/1748-9326/ab4867/meta
https://science.org/doi/10.1126/sciadv.aay2880
The main reason heatwaves technically increase in duration is that it cools less at night. The max temperature barely increases, but more time is spent above a particular threshold. The actual impact is negligible. https://mobile.twitter.com/PatrickTBrown31/status/1555920248817127425
Solar activity is much more strongly correlated with the jetstreams. The recent weak solar cycle has likely offset some of the stabilizing from the greenhouse effect.https://x.com/aaronshem/status/1812884048865370186
Yes indeed, but this is the UK of which we speak. The jet stream is far more relevant and rather unpredictable.
Its been a naff year.
Just one nit. Language is especially important in science.
Climate change causes nothing.
Climate change in present time is the 30 year average of weather.
O/T It’s the summer holidays for kids – old and young alike – so what are the well off up to with their time; putting the uber woke Olympics to one side?
Climate change protesters to target National Trust over its use of Barclays [Bank]
I’d tell the idiot “thanks for the info, now I know this is the bank to invest in since they invest in useful things that don’t require government mandates and subsidies.”
I suggest that the this summer in Wokeachusetts is the hottest in my 74 years of living here. I could be wrong but I’ve never looked at temperature data sets. If anyone who knows how to find that data could correct me, I’d appreciate it. And, don’t worry, I’m not a climatista whining about CO2.
“””I could be wrong “””
Then, you’re no climate scientist…
I certainly never claimed to be- which is why I’m here to learn. I am curious how this summer so far lines up with past summers. Though it’s unpleasant to humans, the ecosystem looks like the Amazon this year. Usually, by now, lawns are dying back- not this year- greener than ever. And, my fruit trees are so loaded with fruit, I’m concerned they’ll break. I’ll have to take some phones of them. And, all reservoirs are filled but little or no flooding in the region.
I should have added the /sarc
When has any climate scientist told us they got it wrong – and they have yet to get it right.
One of the best quotes I’ve seen this year.
“Blind respect for authority is the greatest enemy of truth”.
Albert Einstein
Lawns are still too boggy to mow at my place !!
What a yucky winter !!
Gee all sounds positive.
Must be climate change!
Also, I mentioned my fruit trees- I’ve got a chestnut tree I planted about a dozen years ago- it’s so happy, it’s making chestnuts for the first time. I’ve got to take some photos of it. It’s 15/16 American chestnut, 1/16 Chinese chestnut.
Good humor. Thumbs up.
According to my Blubber Theory, as the average body mass of adults increases over time, due to more obese people, the heat waves FEEL warmer even though that is not reflected in the actual temperatures.
Where does availabilty of food or ability to afford it come in?
I would argue that obesity set in when the fear of crime set in. When children no longer went out to play (and socialise). Besides they socialise online now, anyway. Get out of that one.
Augment your Blubber theory with the fact that larger bodies metabolize and create more thermal energy and CO2. Add to the calculation that the population has not increased to over 8 billion.
So, while the senses feel warmer, it is, in part, due to humanity. This is anthropogenic global warming in and of itself.
In the UK 1976 was the warmest summer on record, with 55 days above 25 C and 21 days above 30 C. 1826 had 59 days over 25 C and 9 over 30C
!995 came close with 43 days over 25 C and 16 days over 30 C
1959 which someone mentioned was a remarkable year for prolonged sunshine and warmth
which started in April and went right through until October, with the Autumn being one of the warmest on record. Urban temperatures in recent years have kept night time temperature
artificially high, and mean temperatures cannot be compared to historic records.
“””In the UK 1976 “””
Pubs ran out of beer.
The you have people on the street with signs that read “The END is NEAR?”
And in the old days EVERYBODY laughed at them. How can they be so foolish? And now everybody frowns at you for not feeling alarmed. Most haven’t even noticed they flipped. That is the power of propaganda..And if i may add something, the same goes for attitudes towards NATO and conflict. I remember the 70s, 80s,90s up to the invasion of Iraq. Deep skepticism throughout society. I think the internet and mobile tech has actually aggrevated propaganda.
When it is stated that “55 days aboce 25C” etx – where – on the Cornish Riviera or in the Orkneys? Or is there a single reporting station for these sorts of data – maybe just to the side of the north runway at LHR?
28C is hot? That is only 82.4F!
No kidding. 10-15 deg F warmer here in N. Utah is unremarkable. Health and well-being, not to mention infrastructure, continue.
But you are used to it. The Brits aren’t.
And Britain extends from 50ºN to 59ºN whereas Utah is south of 42ºN, on a par with Spain and Greece.
This next week here on Vancouver Island is prognosticated to average 28C for 7 days, the lunatics at Weather Canada have issued a heat warning. As far as I can tell its summer.
It is hot if you don’t have residential or commercial air conditioning.
Heatwave??????
What is a heat wave now?
I live near the top of Spencer Gulf in OZ. I have not seen a real heat wave in the last 10+ years.
Ok a few days get above 35 deg C but 3 days are just inconvenient.
35 deg. C isn’t no heatwave. Try about 40+ deg. C and even for 3 fnig days does not a heat wave make.
The reality is the word is full of snowflakes that can not deal with the WEATHER changes.
In my 7 decades of life I have never considered the climate change is a big issue, it’s a just variation of the weather.
Even my grandparents, farming families, born in the late 1980s, never considered these modern “heatwaves” as anything of significances , just a bloody annoyance.
Time to wake up, somehow!
Consider a 1 square meter slab of concrete. It absorbs, retains, then releases thermal energy based on the properties of the concrete and ambient conditions.
Now, convert that 1 square meter into 1 cubic meter. What is the result? 5x the surface area and given the surface of the cube is the same material as the slab of concrete, 5x thermal energy is absorbed, retains, and released.
One a fundamental level, this is a primary characteristic of the UHI. Of course if the height is greater than the base, such a structure has an even greater surface area.
Not a complete description, of course, it does not account for vehicles, people, electricity (heating and cooling and lighting), and effects on wind, rain, and so forth.
I heard on the radio this morning that due to climate change there is a 3x chance of a heatwave.
Simple alarmism. It ignores the definition of climate and disregards that climate change is due to whatever causes the heat wave.
Stagnant high pressure systems cause heatwaves.
Now all that needs to be done is to show that a hundred year and100ppm increase in atmospheric CO2 causes more stagnant high pressure systems.
Should be easy to do since the science is settled.
Ironically, stagnant high pressure systems are more likely caused by extracting energy from the wind that would keep those “stagnant” systems moving than CO2 levels or warmer temperatures however caused.
Story tip:
Strongest solar storms in 20 years creates new radiation belts around Earth
https://www.foxweather.com/earth-space/historic-solar-storm-new-radiation-belts-earth
Interesting: It has created a new radiation belt in the Van Allen, something not uncommon, but relatively rare.
Interesting: It is reported that the aurora borealis is visible in Florida.
We have had a number of solar storms in recent times and are at or near the peak of the grand solar maximum. That is energy inserted into our atmosphere and land and water and has an effect, much like El Nino and Tonga and other natural phenomena.
Once more the “Settled Science” is not quite so settled.
Meanwhile, the zealot Miliband is deindustrialising Britain at record speed – soon we’ll have no oil industry, no chemicals, no car manufacturing – and endless civil disorder as the people realise they’ve been conned on climate change as well as immigration, etc, etc, etc.
Not a happy prospect.
I think the aim is to get back to the 1970s, economically. It’s well on the way..
Well, to my eye the graph of Oxford’s temps >=28C shows a definite progressive warming.
Mr Homewood doesn’t appear to like the UKMO’s use of “all stations” – then here is data for the CET stations:
https://www.weatherdiary.uk/2023/09/11/heatwaves-in-central-england-1878-2023/
“Yes, of course heatwaves are getting more common, CET temperatures have been rising at the rate of 0.254°C per decade for the last 50 years, so they are bound to get more frequent and longer lasting. The chart below gives you an idea of the increase, it displays a bar chart of the annual number of days when daily maximum CET exceeds 25°C. I have added a 10 year centred average to the chart, and also a linear trend from 1878 to 2023. A shorter trend would show a much larger rise than the 0.4 days/decade increase than this trend shows
Then there is of course, the 18/19th July 2022 …..
All caused by UHI of course (sarc)
Certainly a large amount caused by population growth.
Comparison with Valentia shows that.
CET sites have become more and more corrupted over time.
Your ignorance exposed , yet again.
Your cognitive dissonance is exposed yet again
But at least you didn’t resort to ad hom.
That UHI caused the event of 18/19 July 2022 is beyond laughable in the attempt to promote ABCD warming causation.
That air was imported from N Africa.
Lots of peeps and SUVs in the Sahara don’t-you-know?
The 1976 heatwave lasted weeks and there was zero rainfall also for weeks. The main difference between the events was the source of air from a much warmer direction. The 2003, 2019 and 2022 only peaked one day with a brief extreme wave hitting England at least. The 1976 heatwave had no extreme heat from Africa or Spain, so the difference was simply source.
September 1906 recorded temperatures in England at 35/36c when the month is usually about 3c colder than July. A source from North Africa could had easily been 39c/40c back around 1906 in July, but this is a very rare event.
So, climate causes temperature change? Or temperature, as measured over 30 years, is one of the defining characteristics of climate? Or is it both?
Well then don’t do it?
Total denial of UHI in surface data is what a mindless non-science zealot does.
Pretending there is no UHI effect in the UK is stupidity at its most gormless.
Putting words in other people’s mouths is something only a goofy goober does.
Making dumb idiotic comments is something a gormless idiot does.
You just questioned UHI existence, and were so dumb you didn’t even know what you were saying.
You’ll be so good as to point out exactly where I’ve done any such thing.
Don’t be so hard on yourself, bnice.
Nonsense. It is the weather that does that.
Why these people do not come right out and claim that they must change the weather to prevent all the catastrophe they predict is self apparent. They know they will look stupid and be laughed at.
Instead of Oxford Heatwave Days, please analyse Oxford Gridlock days.
There’s definitely a trend there, and it’s blooming ridiculous.
It needs 15-minute villages.
Summer in Texas has so far been quite mild and wet. I have not had to water my lawn since last summer, a hot, dry one.
Imagine that, weather varies from year to year, says this meteorologist.
From the article: “New analysis of observations shows that extremes of temperature in the UK are most affected by human induced climate change.”
What “observations”? There are no observations that show a connection between atmospheric temperatures and human-induced climate change. None. Not one. This is a lie told by Climate Alarmists. They don’t have one shred of evidence backing up this claim. It is an unsubstantiated assertion.
So 28C/83F is considered hot in the UK?
That would be called a pleasant day around here. We’ll take 83F every day!
I guess it all depends on what one gets used to.
I think our local forecast is calling for a temperature of 102F today, and similar temperatures for the next week at least. Of course, this is the hottest part of our year right now. The temperatures will start moderating in a few weeks normally. Sometimes they go on for a little longer.
We are starting to get dry in the central U.S. now. We need a tropical storm to head our way.
When there were many days over 28°C, as in 1949, 1976, 1995, 2003, 2006, and 2018, they are all discretely solar driven events. The global mean temperature cannot influence solar activity.
https://docs.google.com/document/d/e/2PACX-1vQemMt_PNwwBKNOS7GSP7gbWDmcDBJ80UJzkqDIQ75_Sctjn89VoM5MIYHQWHkpn88cMQXkKjXznM-u/pub
Yes, all these years occurred while the SSN was declining for a 3 year period, meaning the earlier peak had just about assended into ENSO/ocean and the atmosphere 3 years later.
https://www.woodfortrees.org/plot/sidc-ssn/from:1947/to:1950/plot/sidc-ssn/from:1974/to:1977/plot/sidc-ssn/from:1993/to:1996/plot/sidc-ssn/from:2001/to:2004/plot/sidc-ssn/from:2004/to:2007/plot/sidc-ssn/from:2016/to:2019
I hadn’t noticed a three year queue for solar irradiance, but this would actually be about the daily-weekly scale forcing of the NAO by the solar wind. Top typo!
Of course the slight change in the ENSO/ocean and atmosphere is reflected in the NAO.
During this cycle sunspot numbers, radiation levels, and ejected material ebb and flow from a solar maximum to a solar minimum. These alterations affect the properties of the solar wind, including the strength of its magnetic field, the speed at which it travels, temperature and density.
So the heatwaves are a fairly immediate response to the solar wind influence on the NAO, which then has a lagged influence on the ocean modes. Feedback from ENSO to the NAO is irrelevant. What you say about the solar wind at the scale of solar cycles does not always hold true, there were major lows in the solar wind at sunspot cycle maxima in 1969 and in 1979-80.