By Robert Girouard
Forget approximate climate models, whose simulations are increasingly removed from reality. There’s a far more scientific way of understanding the climate, and that involves observing the actual climate system directly from space or in situ. A multitude of satellites and a worldwide network of land, air and sea sensors make millions of observations every day, creating detailed, faithful images of the Earth. In particular, satellites transmit huge volumes of data on the upper atmosphere and the Earth’s surface, enabling us to measure the system’s energy balance and attribute infrared emissions to particular atmospheric components. This high-quality space and in-situ data is freely available to all thanks to Copernicus, but the problem is that we don’t use it…
Forget proxies and old data that are constantly being “adjusted”. We have proven, measured information that allows us to go back in time to 1960. It’s a happy coincidence that January 1, 1960 is the reference 0 for the temperature series commonly used. The IPCC has arbitrarily ruled that climate change began with industrialization, i.e. around 1850 or 1880, since it assumes that GHG emissions are the cause. But data from the world’s oceans, which drive climate, show that their temperature began to diverge from its natural cycle around 1980. So let’s focus on the last sixty years, using the real-world observations available to objectively identify the true culprits of anthropogenic warming.
This heterodox but oh-so-interesting point of view is supported by space engineer Michel Vieillefosse, a pioneer in satellite auscultation of the Earth. At CNES, he produced the first maps of thermal variations measured from space. His recent book ” Réchauffement climatique” is a mine of information on the climate, how it works and its recent evolution. Based on real data and calculations, rather than model projections, he concludes that there’s no point in demonizing fossil fuels, and that the real causes of global warming – deforestation of tropical forests, urban heat islands and methane leakage – should be tackled first. Let’s see how he arrives at this astonishing conclusion.
Warming is heterogeneous and multi-causal
Since 1960, the global average temperature has risen by 0.9 oC. However, this parameter cannot account for climate change, as it masks the significant disparities in local temperatures over time and space. At best, the average temperature indicates a trend.
Contrary to the impression created by the term “global warming”, climate change is far from uniform. The warming picture looks more like a patchwork quilt than a blanket. It is therefore essential to look at each region individually, and see what is really happening there, if we are to understand the climate scientifically. All these heterogeneities that blend into the average have a specific explanation.
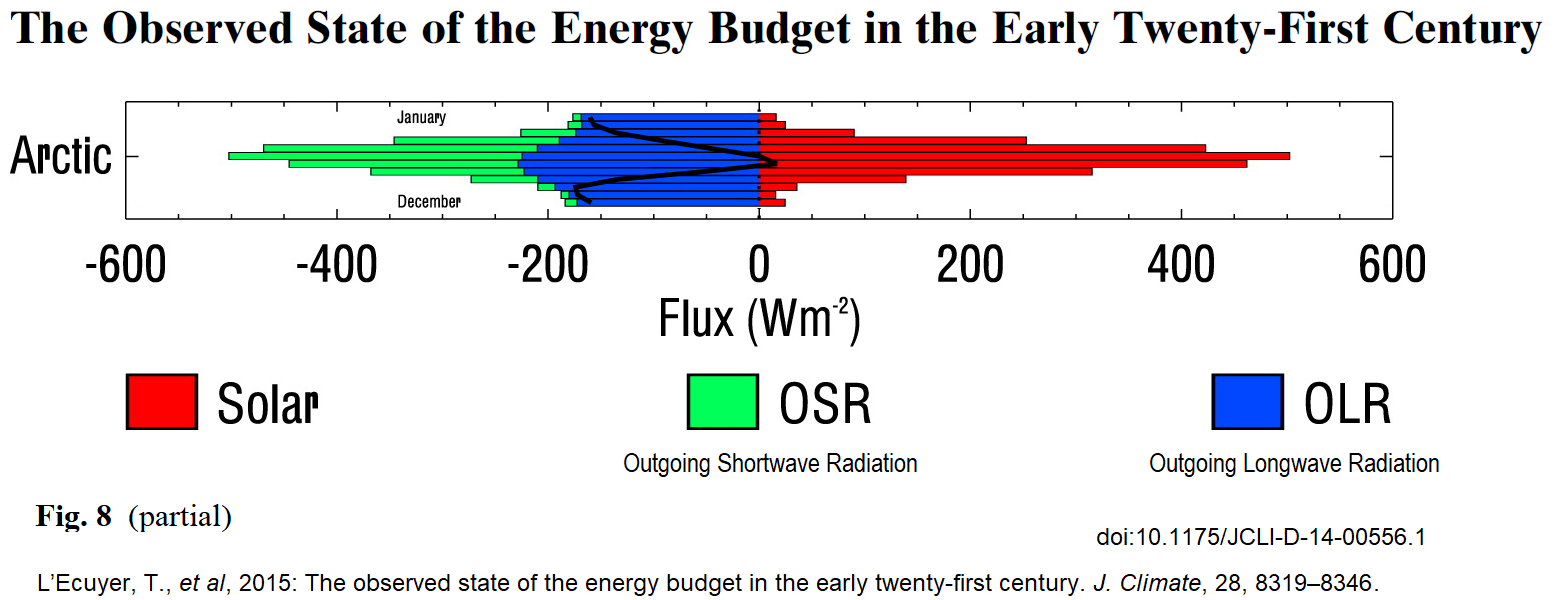
The Arctic is warming by 2, 3 or even 4 times more than the rest of the globe. This amplification observed since 1990 is mainly due to the influx of warmer waters from the tropics via the great oceanic heat conveyor, replacing the cold waters carried towards the Equator, and to the virtual absence of evaporation and lower albedo. It’s worth noting that an initial warming attested in 1938, 1943 and 1944 was followed by a cooling period.
No such increase is observed in Antarctica, isolated by a circumpolar current. It does not change as a whole. The fact that Antarctica has hardly warmed at all since 1960 is a pebble in the shoes of the carbocentrists who blame everything on CO2 (being a well-mixed gas, its effect should be felt everywhere).
The obsession with GHGs has made us forget how the climate system really works. While the sun is the only real source of heat, the Earth cools not only through infrared radiation to space, but also through convection, evaporation and plant transpiration. Let’s understand that these mechanisms act as heat elevators; they cool the lower atmosphere; infrared radiation then takes over to evacuate the heat into the void; ironically, it’s mainly CO2 that takes on this task in the absence of high-altitude water vapour. Consequently, human activities that interfere with these mechanisms, such as deforestation and urbanization, cause marked local warming… but this is overlooked by the IPCC and climate models.
Three case studies are presented in M. Vieillefosse’s book to illustrate the impact of these interferences on climate: Hawaii, Beijing and Manaus, with respective temperature anomalies of 0.4°C, 1.9°C and 1.5°C since 1960. Such large discrepancies, in contradiction with atmospheric mixing, must lead us to investigate their specific causes: little human intervention for Hawaii, a vast urban footprint for Beijing and reduced vaporization of the Amazon rainforest for Manaus.
Let’s not lose sight of the fact that excess local heat that is not evacuated into the vacuum of space is eventually absorbed by the global ocean, whose thermal storage capacity is 1,000 times greater than that of the atmosphere. Basic physics says that oceans warm the atmosphere, not the other way around. The warming ocean enigma is thus solved.
The contribution of CO2 is secondary
CO2 levels have risen by some 140 ppm to 418 ppm over the past 60 years. According to ERBE satellite data, this increase has blocked 1.42 W/m2 of energy, which translates into a 0.21°C rise in the temperature of the lower atmosphere. Compared with the total CO2 contribution of 48 W/m2, this represents only 3% more. CO2 emissions resulting from human activities are therefore not the primary cause of climate change. On the other hand, they are clearly responsible for the greening of the Earth revealed by NASA satellites, a huge benefit for the planet, but this not recognized for its true value.
Similarly, methane has risen from 1.36 ppm to 1.86 ppm, for a forcing of 0.46 W/m2 ; this blocking of infrared radiation has led to a temperature rise of 0.06°C, which is therefore minimal. But with the increasing use of shale gas and the proliferation of landfill sites, methane emissions are on the rise.
Both tropospheric and stratospheric ozone also play a part in blocking infrared radiation emitted into space, but the latter also plays an indispensable role in blocking harmful UV rays.
Of course, water vapour is primarily responsible for the greenhouse effect, but it is also the main vector of cooling, of an order of magnitude incommensurate with infrared radiation. Its importance for the climate of our “blue planet” is immense but ignored. Man’s activities have reduced natural evaporation in the tropics; heat accumulates in the oceans and is transported to the North Pole, where it can only be evacuated with difficulty, hence the overheating of the Arctic. Contrary to what the models and those whose livelihoods depend on them imply, we have not observed any significant increase in water vapour in the atmosphere (prior to the Hunga Tonga eruption).
Tropical forests, the Earth’s radiator
Satellite measurements show that tropical rainforests (6.25 million square kilometers, or around a third of the world’s forests) have an average cooling effect of – 2.4°C on the ground, compared with cultivated areas. At mid-latitudes, the effect is much less marked, if not non-existent. By contrast, boreal forests above 50° latitude have a local warming effect of +0.8°C.
Concentrated in South America, Asia and Africa, tropical forests act as the Earth’s radiator, absorbing solar radiation, cooling it through evapotranspiration and providing water vapour for cloud formation.
The Amazon represents the heart of our planet’s transpiration system. Because of its dark color, the forest captures more solar radiation than other soils. But this energy is returned by evapotranspiration, then rises into the upper layers of the atmosphere by convection, and finally radiates out into space. The air above the canopy contributes to cooling the whole Earth. The Amazon pumps and releases around 20 billion tonnes of water a day into the atmosphere. The Amazon creates 75 % of its own rain.
Deforestation reduces emissivity by 10%, or 36 W/m2. For the globe as a whole, the figure is 0.17 W/m2. But what’s more serious is the suppression of evapotranspiration, in the absence of trees. Latent heat loss rises to 0.78 W/m2, spread across the globe. We lack 480 million hectares of forest to evacuate around 1,000 mm of water a year, along with the heat required for evaporation. This disrupts the precipitation cycle.
Some 240 million hectares of forest were cleared between 1990 and 2015. Roughly the same amount of woodland is likely to disappear by 2030, equivalent to 1/200 of the earth’s surface. As we are constantly told, this has the effect of releasing the carbon dioxide stored in trees and forest soils. But carbo-centrists forget that the main impact of deforestation is to deprive the Earth of a powerful cooling mechanism.
In total, deforestation has caused half of the temperature rise since 1960, or 0.46°C, twice as much as CO2. Although never mentioned in the media, it is the main cause of climate change. And things aren’t getting any better.
Rapid urbanization: a significant factor
Today, 56% of the world’s population, or 4.4 billion people, live in cities. This trend is set to continue: by 2050, with the current number of city dwellers doubling, almost seven out of every ten people in the world will be living in urban areas. While it’s true that cities account for only a tiny fraction of the Earth’s surface – 1/1000 – land artificialisation and other urban interference create heat islands, with temperatures up to 10°C higher than in the surrounding countryside. These are concentrates of climate change!
Increasingly mineralized urban areas use dense building materials, eager to absorb the sun’s energy. With less vegetation, they provide less shade and do little to cool spaces, notably through evapotranspiration. Depending on their morphology, buildings can also prevent the wind from circulating and cooling the streets. In addition, waste heat from car engines, air conditioners and other energy-guzzling appliances adds to the overall rise in air temperature.
Urbanization increases the absorption of solar radiation, but above all it weakens the infrared radiation emitted by surfaces; emissivity can drop to 50%. This drop in emissivity results in more heat being retained at ground level, in excess of 180 watts per square metre, hence the famous “heat islands”. Black tar roads absorb even more solar heat. Rapid urbanization blocks soil transpiration. We see as much less cooling of the planet; the impermeabilization of surfaces immediately washes rain into watercourses via stormwater networks.
All in all, urbanization generates warming of the same order of magnitude as that created by CO2. It is also responsible for flooding.
Action to counter global warming
Following the Kyoto and Paris Agreements, the fight against climate change is almost exclusively focused on reducing CO2 emissions. Unfortunately, we’ve got the wrong target. If we reduce anthropogenic CO2 emissions to zero, its concentration will fall by just 2.5% per year. In other words, nothing. Let’s not forget that the drastic reduction in carbon emissions during the 2020 confinements did nothing to slow the rise in CO2 levels, or in temperatures, and this was due to concomitant phenomena. What’s the point of cancelling CO2 emissions at a huge cost if temperatures continue to rise?
In the case of methane, on the other hand, it would be relatively easy to plug the main leaks, which are easily identifiable. The fight against methane involves controlling open-air landfills and gas installations, which are responsible for 40% and 26% of emissions respectively. Dairies and composts emit 26%. Doing without milk seems difficult. We need to act first on the first two, less natural causes. So let’s introduce a methane tax… instead of this ineffective carbon tax!
But above all, let’s stop focusing on CO2 and tackle the human activities that cause most of the warming. Priority should therefore be given to preserving tropical forests, especially the Amazon. If the entire Amazon rainforest were to be chainsawed, it would be a global ecological disaster, both in terms of climate and biodiversity. The Amazon would become nothing less than a desert, which is all the more plausible given its location in the “right” band of latitudes. Putting an end to deforestation now would make a tangible contribution to mitigating global warming. Why not set up a global fund for the conservation of tropical forests… instead of financing anti-oil activists? Therein lies the urgency of action to save the planet.
We can’t stop urbanization, but we can start to think differently about cities and buildings. Interesting experiments are being conducted here and there, notably to combat those pesky heat islands. It’s in cities’ own interests to take action, because it’s first and foremost they themselves who will reap the rewards of their actions.
We also need to adopt a more rational, non-ideological approach to energy transition, especially in Europe. Haste is also a bad advisor. So-called renewable energies have reached their limit in Germany. Sun and wind alone cannot replace fossil fuels. Innovation will be key in the future, as it has always been in the history of mankind.
Mr Vieillefosse’s book concludes as follows: Isn’t it time we looked at the problem from a scientific rather than a political angle, and took rational, effective measures rather than acquiescing to sad demagoguery? May this book open the fight against global warming to a plurality of possible solutions.
May his wish come true. At any rate, it’s worth saving the Amazon and reducing urban heat islands.
-30-
Source : Vieillefosse, Michel. Réchauffement climatique. Editions L’Harmattan.
“But data from the world’s oceans, which drive climate, show that their temperature began to diverge from their natural cycle around 1980.” This one line shows that this report is on a mission to reach a conclusion and not a scientific investigative report. The oceans, influenced by how much of the seawater is frozen and temporarily stored on continental masses as snow and ice, vary the sea level from 140 meters lower than today and, here’s the important part with respect to this report, up to 40 meters higher than today. Claiming the detection of a signal in 1980 is not justified. However, there are useful snippets of information in the report.
The whole book is based on real-world observations, and science is all about observations and what we can derive from them. This approach departs from IPCC’s reliance on approximate and unreliable climate models, i.e. pseudoscience. Language such as «detection of a signal» is not used in the book. Besides, 1980 is not the point. The real point is 1960, that’s when we started to have reliable, measured data from space and in situ. Still, 1980 is when oceans started to absorb excess heat. Carbo-centrists say that this excess heat comes from the atmosphere, but basic physics says this is not possible. The book provides an answer. In my very humble opinion, and I am no expert, this book is revolutionary and resistance is normal. It’s worth having a second look.
Besides, why are referring to the sea level rise since the last Ice Age. The book focusses on the satellite and in situ data since 1960, especially as it relates to CO2, deforestation and urbanization effects. Are you fully awake ?
I’m wide awake (I just got back from playing golf), and my statement, with respect to “ocean anomalies”. is correct. Additionally, a scientific theory needs a detectable signal to start the theory process, and the sea level cycles and variances denies any such (anthropogenic) signal exists. Go back to sleep.
Read this : https://wattsupwiththat.com/2021/01/16/the-ocean-warming-enigma/
Look a the ocean heat content graph : if you don’t see a «signal» around 1980, you should think of getting your eyes checked.
You miss the point. The NATURAL CYCLES of ocean temperatures, displayed by sea levels, includes much warmer sea water than shown in the graph. Noting in the graph displays anything abnormal. Call me when the sea level is higher than historic, because that would be a signal. Rate of rise? Mikey Mann tried to fabricate a rise anomaly with the hockey stick. No signal.
I understand that sea levels are not the issue here. We have a mass of space and in situ data going back to 1960. The author says let’s use it instead of models to explain climate change. He finds that there are discrepancies in the temperature anomalies. He looks for reasons. He finds urbanization for Beijng and deforestation for Manaus. He then calculates the global effect for each component of climate change since 1960, based on the observations, and concludes that deforestation and urbanization account for 0,67 C, three times more than CO2. This is a truly investigative and scientific report, contrary to your ex cathedra statement. Do you get the point ? That’s all folks ! End of discussion.
I would love to see where this “ocean temperature” was actually measured in say 1960, 1980. 2000 etc 😉
So would I, because it’s highly likely that they are finding signals of changing ocean currents, but no appreciable net change in total heat content. The world is really big and complex.
The graph does not provide spatial context. Clearly you have not looked spatially at the ocean heat content. Ocean heat is predominately being RETAINED in the region of the Ferrel Cells. These are regions of high precipitation and are regions of Net radiation heat loss. So the only way that the regions can retain more heat is through increased precipitation and steeping of the thermocline. And the SH has retained twice as much heat as the NH. But the NH has higher temperature rise than the SH.
The current changes did not start in 1980. The current warming trends date back to around 1500 and will continue for another few thousand years as the June solar intensity over the land mass continuers to climb.
The precession cycle is the dominant driver of climate trends and we are starting to see the early signs of increased snowfall and advancing ice. Most people are unaware that Greenland is gaining permanent ice extent.
The author doesn’t go back to 1500… in his book, he presents a graph of actual ocean temperature evolution vs its 60 year cycle. The divergence point is around 1980. That is when anthropogenic warming starts… Anyways, it’s not really important.
Please go below to pursue the other conversation.
“Observation of the Earth shows that deforestation and urbanization cause three times more warming than CO2”
Living in a relatively small country on a relatively small island, and with an ever increasing population arriving daily…. that’s a no brainer.
If there is to be a scientific approach, wouldn’t that also find that there are multiple large benefits of global warming, like longer growing seasons, more plant growth, more food production, less winter deaths, etc. In other words, that global warming is the ‘good guy’ to be encouraged and that global cooling is the ‘bad guy’ ti be avoided
Absolutely. Living in a cold country, I am all for global warming. But IPCC wants to stop it by eliminating CO2 emissions, at a huge cost. This book proves that this is non-sense. CO2 emissions are not the real cause of global warming, which by the way is not really global.
The Joe Bribe’em FBI wants your address. Saying good things about CO2 is a felony. CO2 Insurrection. Head for the hills, or you will be in a bus to a climate reeducation camp, and not to sing Kumbaya
This was Freeman Dyson’s main criticism of climate science today – it is not holistic. The climate models do *NOT* give us a value for the best GAT, to do so it would have to include all factors – such as the ones you list.
Climate science seems to want to define the GAT in 1850 (which is actually impossible to define even in the tens digit) as the target we should strive for. Why? Wes the Earth in that good of a shape in 1850?
I’ve been throwing out a question for a while now to shock alarmist’s out of their myopia.
“What if us releasing the trapped CO2 was the greatest symbiotic gift humans have ever given nature?”
Why, its almost like evolution planned it that way. Curious that plants had already evolved to use 4 times the CO2 in the atmosphere and have genetically retained that ability even though 2 million years have passed since they have been able to do so.
“the real causes of global warming – deforestation of tropical forests, urban heat islands and methane leakage”
“deforestation and urbanization cause three times more warming than CO2”
It is good news when an article has a title that immediately identifies the author as a fool.
No one knows the exact effect of CO2 and any feedbacks since 1975.
Therefore the claim that other variables could be three times more than an unknown CO2 number is claptrap.
Deforestation would affect only certain land ares. Urbanization would only affect about 2% of the planet’s surface, also land areas
Deforestation and urbanization do not affect the oceans, which are 71% of the planet’s surface and they are waring too.
Most warming since 1975 is TMIN.
Increasing UHI would raise TMIN temperatures for urban weather stations. Deforestation should not affect night temperatures like UHI changes would.
Strangely, the rural USCRN network with no UHI, actually show more warming than the far less rural ClimDiv networks, with UHI. Both from NOAA. That would be evidence that UHI increases do not matter, if I trusted NOAA. But I don’t.
NASA-GISS claims moving urban weather stations to suburban airports reduced UHI. I don’t trust them either.
My guess is UHI increases are one of many manmade causes of global warming after 1975, but also very gradual and relatively small because oceans are not affected. There are no reliable data for a data based conclusion about UHI trends. A lot of guesses.
While methane is a powerful greenhouse gas, it has very little effect when there is water vapor in the air, because absorption frequencies overlap.
Antarctica not warming is a symptom of greenhouse gas warming … that does not have the normal warming effect on Antarctica because most of the continent has a permanent temperature inversion
The rapid Arctic warming can not be caused by more sunlight and melting sea ice changing albedo because it is warming almost entirely in the six coldest months of the year with little sunlight
Any albedo change from deforestation would be at least partially offset by the albedo change from greening of our planet caused by more CO2 in the atmosphere
This is yet another attempt to claim CO2 does very little or nothing from conservatives who must enjoy making fools of themselves … by rejecting the work of almost 100% of climate scientists since 1896.
Scientists who do research and write at least one paper on climate are climate scientists
CO2 is a weak greenhouse gas above 420ppm, Rising CO2 causes harmless warming, mainly at night, in colder months, in colder nations.
No one is ever harmed from more CO2. Most people benefit from warmer winters. All plants benefit from more CO2. It’s all good news
We don’t need alternate theories to explain global warming since 1975
We need to celebrate the warming and more CO2 … and hope this warming trend continues for another 48 years.
The Climate Howlers claim CO2 caused all the warming after 1975. They don’t know that, but they do claim that.
… But the actual warming since 1975 has been good news, so it really doesn’t matter if leftists are right or wrong about CO2.
Whatever more CO2 did to the climate was pleasant.
“We need to celebrate the warming “
Even if it’s happening elsewhere? If only it were uniform.
Warming is mainly happening in colder nations / states in the NH, mainly at night and mainly in the six coldest months of the year.
Our SE Michigan winters are milder with very little snow. 10 minutes of snow shoveling the entire winter, I had to use the AC yesterday because the house was too hot.
Last summer was unusually cool with the most rain since I moved here in 1977. Never had to water the lawn and it stayed green all summer. For the first time.
Maybe in another 50 years Michigan climate will be like the San Diego climate now?
Hopefully by then the US will have sold California back to Mexico … to get back the $15 million we paid them for it.
Leftists are bad news
Warming is good news
The strong cooling effect of tropical forest is a fact. By Do your research. So deforestation has a warming effect. It’s a no brainer.
https://www.newscientist.com/article/2313309-world-would-be-1c-warmer-without-cooling-effect-of-tropical-forests/
Concerning urban heat islands, if you live in a city you should know by experience that they are also a fact.
Deforstation only affects certain small areas but is at least partially offset by greening of the planet from more CO2 in the air
I do not deny deforestation. It is one of many manmade causes of warming, Very likely a minor cause
UHI does not cause warming. Only an INCREASE of UHI causes warming.
Urban areas are a mere 2% of earth”s surface … but I know too many land weather stations are urban
Once again, increasing UHI is a manmade cause of global warming, but I believe a minor cause and very hard to estimate.
Rural stations could have more warming from nearby economic growth than city stations
The majority of warming after 1975 can be explained by more CO2, less SO2 and more sunlight reaching earth’s surface (from less SO2 in the air and a smaller percentage of cloudiness)
The manmade / natural cause split requires much more detail on how much solar energy clouds are blocking each year, and how much upwelling radiation they are deflecting back down each year.
Global average water vapor data are needed to estimate the actual water vapor positive feedback
With so many unknowns, it is amazing how many people say CO2 does everything or CO2 does nothing.
My conclusion: Whatever CO2 doing to the climate since 1975 was good news for me and my plants.
There is no science or observations to justify demonizing CO2.
And that would still be true if CO2 was the only cause of all the warming since 1975, as a worst case assumption
It is my opinion that “deforestation and urbanization cause three times more warming than CO2”, is, to use a scientific term, TOTAL BS
“This is yet another attempt to claim CO2 does very little or nothing from conservatives who must enjoy making fools of themselves … by rejecting the work of almost 100% of climate scientists since 1896.”
That’s hot air. You have no evidence that CO2 does a lot or that many climate scientists say that it does, although such agreement is not science but, as Crichton said, politics.
RG “believes” in a fantasy consensus as being the only “science” that matters..
Evidence is not something that is necessary for his CO2 lukewarmerism.
Evidence of what CO2 does is what BeNasty2000 deliberately ignores … to be a CO2 Does Nothing Nutter and EL Nino / Volcano Nutter.
I think you were hired by leftists to post here as the new Floyd. R. Turbo of climate.
The Tonight Show – Johnny ‘goes up’ – Floyd R. Turbo Sketch! – June 25, 1981 (youtube.com)
The evidence of what CO2 does has been collected since 1896. Your comment is evidence that you are not very bright. CO2 is not satanic gas, but it also does not do nothing.
You say that CO2 does more than “little or nothing” and that this is supported by evidence. So provide the evidence that CO2 affects climate more than a “little” that is actually observed and not a guess or estimate. Words are cheap. If it is not measurable your comment is hot air, reflecting a lack of knowledge about climate science and the scientific method.
“Deforestation would affect only certain land ares. Urbanization would only affect about 2% of the planet’s surface, also land areas”
Do you have a reference for that?
I doubled the 0.69% estimate below and used 1.5% to cover areas near each city that could have had a lot of economic growth/
In general, the global urban land area as a percentage of the total Earth’s land surface is 0.22 % in 1992 and increased to 0.69 % in 2020. Specifically, Asia, Europe, and North America show a larger urban distribution and faster urban expansion than other continents.
Feb 8, 2022
Today, the greatest amount of deforestation is occurring in tropical rainforests, aided by extensive road construction into regions that were once almost inaccessible. Building or upgrading roads into forests makes them more accessible for exploitation.
Feb 21, 2024
Global forest area down 4% in 26 years
Forests cover over four billion hectares of the Earth’s landmass, around 31 percent of total land area. As of 2020, worldwide forest area measured some 4.06 billion hectares, down from approximately 4.24 billion hectares in 1990.
Mar 9, 2023
You start out with an ad hominem attack on the author. RED FLAG.
You also missed a couple of key points in your rant.
I will not waste my time pointing out your misses. You would not believe them.
You obviously have nothing and this is an empty head fake. Your only goal was an insult.
RG loses.
So much just WRONG with that RG rant, it is hard to know where to start.
“Strangely, the rural USCRN network with no UHI, actually show more warming than the far less rural ClimDiv networks, with UHI.”
That is because ClimDiv is being deliberately constrained by USCRN.. They cannot let them diverge.
Poor RG still hasn’t summoned enough brain-power to realise that.
“Most warming since 1975 is TMIN.”
URBAN warming from massive urban expansion and densification will do that.
“The rapid Arctic warming”
There was no warming in the Arctic this century until the 2016 El Nino.
CO2 warming??? where is the evidence ! Still waiting…
Ranting on about 100% of scientists… is no form of evidence whatsoever.
He is an embarrassing disgrace to lukewarmism.
I have nominated your brilliant climate science post for a Nobel p Prize
You are perpetually stuck on stupid My initial post mentioned increased UHI and TMIN.
But the rising TMIN effect includes the entire globe not just urban areas that are just 0.7% of Earth’s surface.
Factually wrong. You are picking numbers out of the air, The percentage of the Earth’s land covered by urban areas in 2005 is about 3% (livescience, 2005) and so it’s larger now.
WOW! Where do this kind of “experts” pop up?
Well, it is just pointless..
“CO2 levels have risen by some 140 ppm to 418 ppm over the past 60 years”
1960 = 316.91 ppm
2023 = 421.08 ppm
Increase = +104.17 ppm
NOT +140 ppm
My research time: One minute
SOURCE:
Atmospheric CO2 ppm by year 1959-2023 | Statista
I agree that the book probably needs refinement but the approach based on observing the Earth rather than simulating it in models certainly has its merits.
The climate confuser games are programmed so CAGW predictions are supported. The IPCC would ignore them, if not. I’m surprised the IPCC has not sanctioned the Russian INM and got it thrown out of CMIP6
The whole purpose of climate confuser games is to scare people. What’s wrong with those Russians?
This essay comments on something that has bothered me as I study local temperatures. There are just too many stations that are easy to find around the globe with little or no rise in temperature. For something like ubiquitous CO2, this just upset the apple cart as this essay says.
I recently looked for information on population statistics on how many people were in farming in the past and current time. It is amazing how fast and complete the depopulation of rural areas has occurred. The has been an explosion of urban and suburban population. To think that this hasn’t affected the temperature measuring stations just isn’t believable.
Whether this essay ultimately pans out, it is at least based on observations and not what some model says is happening. That’s one step in the right direction.
It’s gotta be the CO2 so eschew impure thoughts-
Your heat-trapping dark roof costs almost $700 extra a year in electricity. Why are they still so common? – ABC News
Well, during the summer, yes, during the winter, no and it helps melt the snow off the roof saving on house repair costs.
Well, no, the earth cools only via radiation to space, as it is suspended in a vacuum. These other processes move energy around within the earth system, they do not remove energy from it.
But nitpicks aside, the fundamental premise of this article is completely mistaken – land use changes are absolutely not ignored by climate models, indeed there are entire sections of the IPCC reports dedicated to discussing land use changes and their impacts on climate change.
You did not read the whole paragraph. You missed : Let’s understand that these mechanisms act as heat elevators; they cool the lower atmosphere; infrared radiation then takes over to evacuate the heat into the void; ironically, it’s mainly CO2 that takes on this task in the absence of high-altitude water vapour.
Having an open mind is basic in science.
Yes, I don’t disagree with the rest of the paragraph, just the wording of the part I quoted. You also seem to not have read the entirety of my comment, so I’ll quote the rest again for you:
“But nitpicks aside, the fundamental premise of this article is completely mistaken – land use changes are absolutely not ignored by climate models, indeed there are entire sections of the IPCC reports dedicated to discussing land use changes and their impacts on climate change.”
There you go again AlanJ. Being a leftist must require the ability to obfuscate without even trying.
So talking about it in the reports is the same as having those changes mathematically represented in the actual parameters of the MODELS? I think not.
Nice try though, lol.
No, but the issue is not that land use change is not represented in climate change studies, the issue is that the author of this article and the WUWT readership are ignorant of the fact that it is. Reading the IPCC reports and associated peer reviewed literature will solve the actual issue here, which is a lack of education.
So, no evidence that land use changes are implemented in the models..
… just as Drake says.
Thanks AJ.
Yes the IPCC “mentions” many things….
Only one with the lack of education… is you. !
The issue was that the land use changes are not reflected in the MODELS appropriately. They certainly aren’t in the different scenarios. If they are parameterized like they parameterize clouds then the models do not handle land use change correctly. The issue is *NOT* whether the IPCC has mentioned land use changes.
You say “no, but” a lot. That’s the same as saying, “look over here, not over there.”
Also, the premise is not land use change but evaporation, or the lack of. Can’t you read ?
What does the article posit is the cause of the change in evaporation?
If you cut down the trees in tropical forests, you lose the evaporation. If you pour concrete and asphalt on the soil in the cities, you lose the evaporation. Geez, it’s written all over the place in the article. Are you sure you have read it ?
Hmm, cutting down forests to make farmland, paving grassland to make cities and roads. What descriptive bucket could we place these changes to the use of land into? How could we label them?
For IPCC, land use changes refer to CO2 sinks. Evaporation is ignored. See for yourself
Under the United Nations Framework Convention on Climate Change any process, activity or mechanism which removes a greenhouse gas (GHG) from the atmosphere is referred to as a “sink“. Human activities impact terrestrial sinks, through land use, land-use change and forestry (LULUCF), consequently, the exchange of CO2 (carbon cycle) between the terrestrial biosphere and the atmosphere is altered.
From the IPCC, AR6, WGI, Chapter 8, FAQ 8.1: “How Does Land Use Change Alter the Water Cycle? “:
But by all means, keep lying to yourself and everyone else here, big lies are the surest way to get accolades from the WUWT contrarian set.
Do you know what FAQ means ? It means Frequently asked questions. Yeah, tell me know how the IPCC measures and takes into account the loss of evaporation in the Assessment Report itself.
I don’t think it’s productive to continue embarrassing yourself.
That is not an answer. When you have no argument, you resort to insult. Typical.
🤣 – right on.
You’ve not asked an earnest question, you’re attempting to backpedal to save face. Your initial contention was that the article has nothing to do with land use change. You were embarrassed on that point and so pivoted into arguing instead that the IPCC, specifically, defines land use change in a way that precludes consideration of the effects of land use change on evaporation. You were again embarrassed on that point, so you’re now trying to pivot into suggesting that the section of the IPCC report I quoted lacks specifics.
So, I think you’ve embarrassed yourself enough, and you will have to seek out other people to continue humbling you if you haven’t had enough yet.
Exempts himself from his own rule. Typical leftist.
Can. With no qualification on extent or amount. Got it.
Uh oh! You’ve done it now. You’ve invoked word salad AJ to correct you!
You really need to walk around in a forest where the ground is shaded while in farmland the soil is still generally exposed to the sun in the summertime.
You need to back to school. Temperature of a gas is not a direct measurement of energy. Look up the term adiabatic. The term describes what occurs as a parcel of air roses. It tells you that energy neither leaves or arrives in that parcel. It DOESNT tell you that the parcel is isothermal.
Why then does the parcel of air cool as it rises? Answer that and you’ll begin to understand a little of the atmosphere. Tell us your hypothesis.
On the contrary, I think you need to reread my comment, because you’re talking past anything I said.
Tell everyone how adiabatic cooling is not real, only radiation counts.
Adiabatic cooling is quite real, but it doesn’t remove energy from the earth/atmosphere system, it just redistributes it within the system. The only way to remove energy from a planetary system is via radiant emission to space.
You missed the whole point of the article didn’t you? Evaporative cooling cools the surface. When water vapor cools at altitude it releases the energy to space. The same energy it absorbed at the surface.
The teenager didn’t read the article which is why he is being corrected so much.
He is a typical warmist/alarmist we have to put up with.
Most clouds develop as a result of adiabatic cooling in rising air.
Clouds form when air rises and becomes saturated in response to adiabatic cooling. migrate, warmer air is pushed aloft. This results in adiabatic cooling and cloud formation.
Evaporation is a cooling process because when liquid turns to gas, it needs more energy, and so it has to take that energy from its surroundings. The energy is in the form of heat, and when the heat energy leaves with the evaporating liquid, the surroundings get cooler.
And OLR is increasing.
Your points are pointless.
In the classical definition, temperature of a gas is the average kinetic energy of the molecules impacting the thermometer. Energy.
Volumes of air are cooler at lower pressure primarily due to a lower density of molecules per unit volume. Fewer molecules to impact the thermometer, less energy exchanged.
Exactly. As a parcel of air rises, it expands and cools. Same energy, larger volume, smaller temperature. Basic ideal gas law.
The computer models work on a 25 kilometer grid. Any deforestation is an estimate probably with a tuning knob.
The climate models are not robust in the area of the thermal engine of the equator to the poles. They are not devoid, do not read this wrong, they are merely inadequate.
“There’s a far more scientific way of understanding the climate, and that involves observing the actual climate system directly from space or in situ.”
And can that understanding be in any way sensible unless a retrospective analysis of data from at least 10 000 years?
Is climate and climate change science or history?
Isn’t real time observation of the climate system, weather?
The book examines real-world space and in-situ data starting in 1960 when it became available. 60 years of data, that’s climate… not weather,
My climate, a few tens of miles east of the Cascade Crest in Washington State, is the same now as 60 years ago, or 120 years ago. Well, that is what the Ponderosa Pines tell me. I always believe my elders.
My climate in Montreal has changed considerably since 1980. I am myself an elder. I was born way before, and I know for sure that winters here are much milder today. I like it.
First of all, instantaneous measurements of a locale is weather.
Climate is the average weather over a length of time (not debating 30 versus 100,000 years here).
Bottom line, weather causes climate change. Eliminate the then data and integrate the now data and the numbers change.
The trouble with you dudes is you were never schooled in woke maths-
‘Math operates on logic’: Concerns over ANU trying to change basic numeracy (msn.com)
It’s a feel kinda thingy.
Ouch. That sounds like a variant of the same intersectional/woke nonsense that is corrupting STEM here in the USA. For example, “EquitableMath” is a project funded by the Bill and Melinda Gates Foundation, which advocates “shifting [mathematics] instructional practices to provide meaningful access to priority content while ensuring that those practices are research- and assets-based, and culturally responsive.”
In case you have trouble translating eduspeak gibberish, here’s an excerpt which illustrates what they mean:
It’s STEAM now, Dave. Want to guess what the “A” is?
“Antiracism?”
“Astrology?”
“Acupuncture?”
“Aboriginal knowledge?”
“Alimentary effluent?”
Pretty sure it’s not astrophysics.
I have no problem offering a course in indigenous math concepts. Expanding one’s thinking is the result. College is about expanding one’s thinking.
Studying ancient Celtic languages is fine, but does not replace English, as another example.
I would not wish to fly in a 737 where the aircraft was designed using social concepts of patterns as (I may have not quite gotten this right) described in the link.
“The IPCC has arbitrarily ruled that climate change began with industrialization, i.e. around 1850 or 1880, since it assumes that GHG emissions are the cause.”
IPCC’s charter is the driving force for this assumption which in turn is the source of much of the misinformation, hysteria and misguided political actions surrounding global warming, CO2 and a variety of derivative actions.
Right. I must add that IPCC models can’t really explain the first warming phase 1910-1940, the reason being that it was natural and not due to CO2. The warming since 1960 is essentially anthropogenic but the data says that main drivers are deforestation and urbanization, not CO2. I’m no expert but I find this worth considering.
Oups, the warming since 1980
There is a growing body of data that indicates the sun is not constant and over the last several solar cycles, irradiance has been slowly increasing.
Too lazy to look up the links, but WUWT has them somewhere.
So, no. The just is out about the warming since 1960 being essentially anthropogenic.
Too much oversimplification and giving the masses an evil to hate and in doing so, controlling the masses.
The author has calculated the effect of the small irradiance fluctuations over the period, and guess what ? It’s slightly negative. Read the book.
A methane tax? You are seriously unhinged, or misinformed.
https://wattsupwiththat.com/2014/04/11/methane-the-irrelevant-greenhouse-gas/
No “climate” taxes of any kind, thanks.
It was irony.
See Poe’s Law.
Whether by tax or some other financial incentive, the methane being leaked is a commodity and someone should figure out how to economically capture it for fueling steam turbine generators.
Earth cools not only through infrared radiation to space, but also through convection, evaporation and plant transpiration. Let’s understand that these mechanisms act as heat elevators; they cool the lower atmosphere; infrared radiation then takes over to evacuate the heat into the void; ironically, it’s mainly CO2 that takes on this task in the absence of high-altitude water vapor.
El Niños, Hunga Tonga Volcanic Eruption, and the Tropics
https://www.windtaskforce.org/profiles/blogs/hunga-tonga-volcanic-eruption
Also see
https://www.windtaskforce.org/profiles/blogs/natural-forces-cause-periodic-global-warming
Upward IR Radiation at High Elevation: The atmosphere above the TS is transparent to IR radiation (aka atmospheric window).
WV is about 3.3 ppm at 20 km; irrelevant regarding absorbing photons
CO2 is about 390 ppm at 20 km; at low temperatures of about -50 C (223 K), photon wavelengths are beyond CO2 absorption bands
Collision rates are less, due to 1) low temperature, 2) molecules moving slower and further apart.
Collision rates are 4 billion/s at sea level; 1 billion/s at 10 km; 7 million/s at 70 km
With sufficient window transparency, the upward radiation flux becomes the dominant heat transfer/cooling mode, at 40.1 W/m^2
Total upward radiation flux (TS + clouds + window) is 239.9 W/m^2
See URLs and Image 11A and NASA image
https://www.engineeringtoolbox.com/air-altitude-pressure-d_462.html
https://www.windtaskforce.org/profiles/blogs/the-greenhouse-model-and-co2-contribution
Addition
Photons are packets of energy with various frequencies; Ef = hc/λ; h = 6.626 x 10^-34, Planck’s constant.
f = c, speed of light in vacuum 3 x 10^8 meter/λ, wavelength
wavenumber = cm/wavelength = 10000 x 10^-6 /15 x 10^-6 = 666.7
15 micrometer IR photon = (6.626 x 10^-34) x (3 x 10^8)/(15 x 10^-6) = 1.325 x 10^-20 joule
0.55 micrometer green photon = (6.626 x 10^-34) x (3 x 10^8)/(0.55 x 10^-6) = 36.136 x 10^-20 joule
Ef ratio = 15/0.55 = 27.27
Above 7 million/s, at 70 km, should read at 50 km
” If we reduce anthropogenic CO2 emissions to zero, its concentration will fall by just 2.5% per year. In other words, nothing.”
Oops! Meant to add that concentration has been increasing at about 2ppm per year. If true, 2.5% reduction per year (>10ppm) seems more than nothing.
I think that was a typo. I think the author typed “2.5%” but meant “2.5 ppmv.”
Anthropogenic emissions are currently about 5 ppmv per year, which outpaces natural CO2 removals by about 2.5 ppmv per year. If anthropogenic CO2 emissions were suddenly reduced to zero, we’d be left with just the continuing natural CO2 removals, initially at a rate of about 2.5 ppmv per year. That is to say, the CO2 level would be falling by 2.5 ppmv per year.
You are probably right. I stick to the book, I am in no position to correct the author. But 2.5 ppm makes a lot of sense. Close to nothing.
Assuming natural CO2 emissions are constant.
Given 70% of the planet is ocean and water releases or absorbs gasses based on temperature and partial pressures, CO2 emissions are not constant.
Not to mention the earth is greening, which also changes the balance.
[Part 1 of 2]
OBJECTION! By referring to “the true culprits of anthropogenic warming” the prosecution assumes a crime not in evidence.
Scientists and historians call the warmest periods “climate optimums,” because they’re objectively BETTER than cold periods. So the causes of warming are our benefactors, not “culprits.”
BTW, it is not clear to me how much of this article represents Mr. Girouard’s work, and how much is from Vieillefosse‘s book. That would be good to know.
I found much of the article interesting, but I disagree with some points, including this:
“Arctic [warming] amplification observed since 1990 is mainly due to the influx of warmer waters from the tropics via the great oceanic heat conveyor, replacing the cold waters carried towards the Equator, and to the virtual absence of evaporation and lower albedo.”
The relative warmth of the Arctic (compared to Antarctica) is, indeed, due to heat carried north by the AMOC, but the AMOC isn’t carrying MORE warmth north now than it used to, so it hasn’t caused “Arctic amplification.”
Nor (contrary to widespread misconception) has reduced albedo due to diminished sea ice coverage caused warming via increased absorption of solar radiation. That’s because there’s little sunlight to warm anything, in the Arctic.
The Arctic’s radiation balance is negative, almost all year long. In other words, the Arctic Ocean radiates far more energy (as LW IR) than it absorbs (from sunlight). Only very briefly, around summer solstice, is Arctic radiation in approximate balance. (The Arctic’s energy deficit is made up by heat carried north by wind & water.)
That means reduced sea ice coverage increases heat LOSS by the Arctic ocean much more than it increases absorption of energy from sunlight.
These graphs are from L’Ecuyer et al. (2015):
https://sealevel.info/2015_lecuyer_eeb_jcli_fig7-8.html

The black line in each graph is the net radiation balance. As you can see, for the Arctic it is negative almost all year long; here’s a larger version:
http://sealevel.info/2015_lecuyer_eeb_jcli_fig8_full_sized_arctic_only02.png
Not only does reduced ice coverage increase radiative heat loss by the water, it also dramatically increases evaporative heat loss. Based on Nimbus-5 observations, Zwally, et al. 1983 (NASA document ID 19840002650) reported that:
“…the release of heat to the atmosphere from the open water is up to 100 times greater than the heat conducted through the ice.”
In other words, sea ice loss is a strong negative (attenuating/stabilizing) feedback mechanism, not a positive (amplifying) feedback. Sea ice coverage reduction accelerates heat loss from the Arctic Ocean to the air, cooling the water.
warmer water temp → less sea ice coverage → more evaporation → cooler water temp
However, although moving heat from water to air cools the ocean, it simultaneously warms the air. That is why Arctic air temperatures are warming more than other places. It’s actually a sign that negative feedbacks are working to regulate and stabilize water temperatures.
The article says, “convection, evaporation and plant transpiration… act as heat elevators.”
Great analogy! The water cycle is a classic phase-change refrigeration cycle, just like the Freon refrigeration cycle in your refrigerator. Water evaporates at the surface, absorbing heat of evaporation. Because the molecular weight of water vapor molecules is just 18 (compared to about 29 for dry air), moist air is lighter than dry air (perhaps contrary to intuition). So the moist air rises to the mid-troposphere, where the water condenses into clouds, releasing the latent heat which it had absorbed at the surface. The liquid water then falls to the surface, and the cycle repeats.
That process is the most important way in which heat is removed from surface of the Earth (though that’s largely because the 7/10-ths of the Earth is covered with water).
(OTOH, sometimes latent heat transfer runs the other way. During cool evenings, when the temperature drops to the dew point, and moisture condenses at the surface [either land or sea!], that process warms the surface [relative to what it otherwise would be], rather than cooling it.)
The article says, “CO2 levels have risen by some 140 ppm to 418 ppm over the past 60 years.”
That’s might be a typo. It’s not accurate. The current level is about 422 ppmv. In 1964 (sixty years ago) it was about 320 ppmv, i.e., only 102 ppmv lower, not 140.
It was way back around 1800 when the CO2 level was 140 ppmv lower than now. Here’s a graph:
https://sealevel.info/co2.html
(You can hover your mouse cursor over the trace to see exact values.)
[…cont’d in Part 2]
[Part 2 of 2]
The article says, “According to ERBE satellite data, this increase [in CO2 level] has blocked 1.42 W/m2 of energy, which translates into a 0.21°C rise in the temperature of the lower atmosphere.”
But that’s a very low estimate of the warming effect.
The radiative effect seems about right, if you’re talking about “since 1960.” We’ve seen a total CO2 “forcing” since the 1700s = (log2(422/280)=59%) of a “doubling” of CO2, so far. The radiative effect of that is debated, with the IPCC still claiming 3.7±0.4 W/m² per doubling, but the best evidence indicating about 3.0 W/m² per doubling. 59% of 3.0 = 1.77 W/m². But since 1960 we’ve had only log2(422/320)=40% of a doubling, which is 1.20 W/m². Or, if you use the IPCC’s 3.7 W/m² per doubling, 40% of that is 1.48 W/m², which is very close to the article’s1.42 W/m² figure. OTOH, if CO2 accounts for only 80% of 1.48 W/m², that’s just 1.184 W/m². But, anyhow, I’d say it’s close enough for government work.
But the warming effect should be larger than the article’s 0.21°C estimate.
For a first-order estimate of how to relate radiative forcing to temperature, consider the Stefan-Boltzman relation:
E = ε⋅σ⋅T⁴, where epsilon ε is emissivity, sigma σ is the Stefan-Boltzman constant = 5.670374419E-8 W/m²K⁴, temperature T is in Kelvin, E = radiative emission.
(For simplicity, let’s ignore that ε [0..1] is actually a function of frequency, except for a perfect grey-body.)
If E = 340.25 W/m² and ε = 0.87, T = (340.25/(0.87*5.670374419E-8))^(1/4) = 15°C.
(Yeah, I cheated: I used a fake ε to get a reasonable temperature in spite of ignoring the atmosphere, etc. So sue me.)
Now see what happens if we add 1 W/m²:
((340.25+1)/(0.87*5.670374419E-8))^(1/4) – (340.25/(0.87*5.670374419E-8))^(1/4)
The arithmetic predicts a temperature increase of 0.212°C per 1 W/m².
If we add the IPCC’s 3.7 W/m² (from a “doubling” with no feedbacks) we get 3.7× that, which is +0.78°C. (They typically say “about 1°C”)
For an addition of 1.77 W/m² we get +0.374°C.
Or adding 1.42 W/m² yields +0.300°C.
However, it generally agreed, even by skeptics of climate alarmism, that that sort of calculation underestimates the net warming from additional CO2, due to the combined effects of many feedbacks, both positive and negative. Comparisons of the warming and CO2 trends suggest an “equilibrium climate sensitivity” from doubling CO2 of perhaps 1.5°C (though the IPCC estimates 3°C), and 40% of 1.5°C is 0.6°C (a small part of which is yet unrealized).
The article says, “methane has risen from 1.36 ppm to 1.86 ppm, for a forcing of 0.46 W/m².”
Actually, the level has risen from roughly 1.30 ppmv in 1964 (from ice cores) to 1.925 ppmv now (at Mauna Loa):
https://sealevel.info/ch4.html
I agree that the effect on temperature from that methane rise is minimal (perhaps 0.1°C), However, that seems to me like a dispositive rebuttal to the article’s suggestion of, “let’s introduce a methane tax.”
(However, I agree that a methane tax would be less destructive than a broader carbon tax.)
The article says, “Satellite measurements show that tropical rainforests (6.25 million square kilometers, or around a third of the world’s forests) have an average cooling effect of – 2.4°C on the ground, compared with cultivated areas. At mid-latitudes, the effect is much less marked, if not non-existent. By contrast, boreal forests above 50° latitude have a local warming effect of +0.8°C.”
Those are interesting statistics. Can you please provide a reference, Robert?
In fact, references for the many statistics in this article would greatly enhance its usefulness.
BTW, thank you for teaching me a new word: “auscultation.”
###
I tried to stick as close as possible to the book. I thought it would be a good idea to give exposure to Mr Vieillefosse’s approach, which makes a lot of sense in my humble opinion. Yes, there are a few things that are possibly wrong but you must look at the big picture : using observations and measurements rather than computer simulations. I am amazed by the skepticism displayed on this board. I mean observations should prevail over simulations.
By the way, I did a story on a another book which I found fascinating and my goal is always to share for the benefit of all.
https://wattsupwiththat.com/2023/08/02/a-brief-history-of-climate-from-prehistory-to-the-imaginary-crisis-of-the-21st-century/
“the true culprits of anthropogenic warming”
Given the Code Red and Precipice alarms being sounded by the UN and blaming it all on CO2, I suggest there was a bit of sarcasm/humor/counter punch in that statement.
Given the climate is complex beyond our limited understanding it is likely there are more than 1 or 2 or 3 factors that affect everything, and differently by location.
This is an interesting article. But it really misses the main point. Why is increased CO2 and increased temps a bad thing? These two have been rising steadily for 60 years, yet nothing bad has happened. There has been no increase in the frequency or severity of hurricanes, floods, droughts, wildfires, or severe weather of any kind. No island nations have been washed away by rising oceans. Crop yields are at or near record highs. There is sea ice in the Arctic all year round. The Antarctic recently set its coldest winter on record and the sea mass is at or near record levels.
Rising CO2 and literally greened the planet, as the article mentioned. And since ten times as many people die from cold as heat, the warmer temps may mean more people die due to heat, but many more lives are saved from death by cold That’s a good thing.
What’s the bad thing about rising temps and CO2. I have yet to have someone show me what problems they have caused already. I’ve seen a lot of predictions for future damage. And I’ve seen a lot of failed predictions for damage that should have already been seen but hasn’t. But I’ve never seen anyone show me what damage has already been done. Funny that.
The book does not say increased CO2 is a bad thing, on the contrary. It says cutting CO2 emissions is useless. As for rising temperatures, they are not always a good thing, for example if you are living in New Delhi given the strong urban heat island. The book says we should strive to reduce these and prevent deforestation of tropical forests.
The world has populations living in -20 F and +90 F and have adapted. It is illogical to assume (a) we can regulate the climate to a fraction of a degree, (b) it will be a step function (precipice) with devastating consequences, and (c) humans who have adapted to changes for the past 300,000 years will not acclimate to an additional 1.5 C.
The author states
The Amazon would become nothing less than a desert, which is all the more plausible given its location in the “right” band of latitudes
Since when has the equator been a place where deserts are located?
Checking out the globe I find equatorial rainforests on almost all the land located at or near the equator. This accounts for all the major tropical rainforests in the world. There is not one major desert at the equator. This is the right band of latitudes for rain forests not deserts based on observations and thus, science.
That’s a detail. Probably, this sentence should have been taken out. At any rate, truth is tropical forests that are transformed into savannas do not evaporate.
People generally do not like change. People generally are afraid of change. So announcing a change in alarming hyperbolic rhetoric can only have one purpose.
This has a lot of good information but runs off the rails at times.
For instance there is no justification for taxing methane. Handing more money over to the government to piss away isn’t a solution for anything. Stop doing that!
Number two there is no justification for an energy transition. Use fossil fuel and nuclear as efficiently, safely and economically as possible. That is the answer. Wind, solar, hydrogen, battery and all the other crackpot so called solutions aren’t solutions at all rather they are the problem.
Any attempt to force inhabitants to not use their own resources is not going work. Help them use their resources efficiently and responsibly with a huge emphasis on restoration. This is a better solution. And for god sake stop cutting down our forests so Europe can burn them.
Get the government out of the energy business and the vast majority of our issues simply disappear.
This is not based on observation. It is an assumption that is wrong.
Oceans have retained more heat mainly in the region of the Ferrel Cells and, to a lesser degree, in the tropics. This is due to increased atmospheric moisture and an associated increase in precipitation over these regions.
UAH TLT and Berkeley LST also show warming lobes in the region of the Ferrel; Cells.
There is a significant distinction between retaining heat at depth and “uptaking” heat from the surface.
I am not an expert. The author is not explicit on this issue. I tried to reach him on his FB page for an answer but his last post was in 2023… You have a point. But then, if he is wrong, what is the cause of ocean warming. Physics it can’t be the atmosphere.
Oceans absorb heat and land loses heat. The internal transfer of energy is indicated by runoff from land to ocean. This has a downward trend in all months except May because snowfall is increasing and sunlight over land is increasing in May. The land is now warmer than it was 500 years ago.
Most of the land is in the NH has been getting more intense sunlight for 500 years now. That is a function of the precession cycle. In 9,000 years, the June solar intentensity in the NH will be almost as much as what the SH gets in December now. It will be up by 20W/m^2from present level. The linked web site can be used to see how the sunlight changes at different latitudes for different months.
http://vo.imcce.fr/insola/earth/online/earth/online/index.php
The solar constant is close to 1361W/m^2 according to the SORCE Project.
Since the warming of the NH started around 500 years ago, some of the additional energy input to land has reduced the amount of land ice and also increased biomass. Both these are a memory effect that are currently accelerating the warming of the land. That means the oceans are transferring less heat to the land so runoff is in general decline. Rainfall has not declined though because there is more water in the atmosphere. A lot of the land water gets recycled as precipitation over land.
All climate models are running warm for the high southern latitudes and cold for the high northern latitudes because the current warming is the result of the changing orbit. It has nothing to do with CO2.
If you take a latitudinal plot of outgoing long wave and reflected solar per attached, you find reflected solar has reduced almost everywhere and OLR has increased almost everywhere. According to “greenhouse” theory, the OLR should have reduced.
The. NH oceans will continue to warm a lot more yet. The land will begin to cool again when the snow advances south and down slope. So far only Greenland is showing increased permanent ice cover and gain in elevation of the summit.
I know this because it has all happened before in the same phase of the precession cycle. It is obvious if you understand that getting water from ocean to land is truly energy intensive. But once the ice is permanent on the land, the land temperature drops off and the water cycle speeds up as the elevation of the land increases while sea level falls.
You are much much more knowledgeable than me, no doubt about that. But let’s concentrate on the last 60 years. That’s the period the book is all about. Is it possible that, because of tropical deforestation and urban heat islands since 1960, the ground has become warmer and runoff from land to ocean has also become warmer, thus making oceans warmer. Sorry for my clumsy English at times.
I found this study showing that rivers and streams in urban areas are getting warmer:
https://www.sdu.dk/en/om_sdu/fakulteterne/naturvidenskab/nyheder-2023/varmere-vandloeb-i-byerne
OK for now, going to bed
Urban heat effect has limited spacial coverage. There is ample evidence to be certain it contributes to higher temperature in urban areas. Roy Spencer has done extensive analysis of UHI and has posts at WUWT.
The location on Earth that is retaining most heat is at 45S. Not much river run off at that latitude. The SH is retaining twice as much heat as the NH but most of the warming is occurring in the NH is January. Not much river runoff in January in the NH.
The warming trend has been around a lot longer than 60 years. The central England temperature recording started in 1659. The temperature had an upward trend of 0.54C over the first century of observation.
Land ice has generally been lost over the past 100 years and that causes land to heat up faster in spring and stay warmer till the snow hits in October and November.
Early season snowfall is rising strongly and will eventually overtake melt.
The only locating where permanent land ice is advancing is on Greenland. The summit is also gaining elevation.
The temperature increase in the NH will continue until the permafrost advances again. I predict by 2200 based on current rate of rise of NH ocean surface temperature.
We are in an interglacial, neo-glacial phase, and heading for a new full blown glacial. Let’s enjoy the warm weather while it lasts.
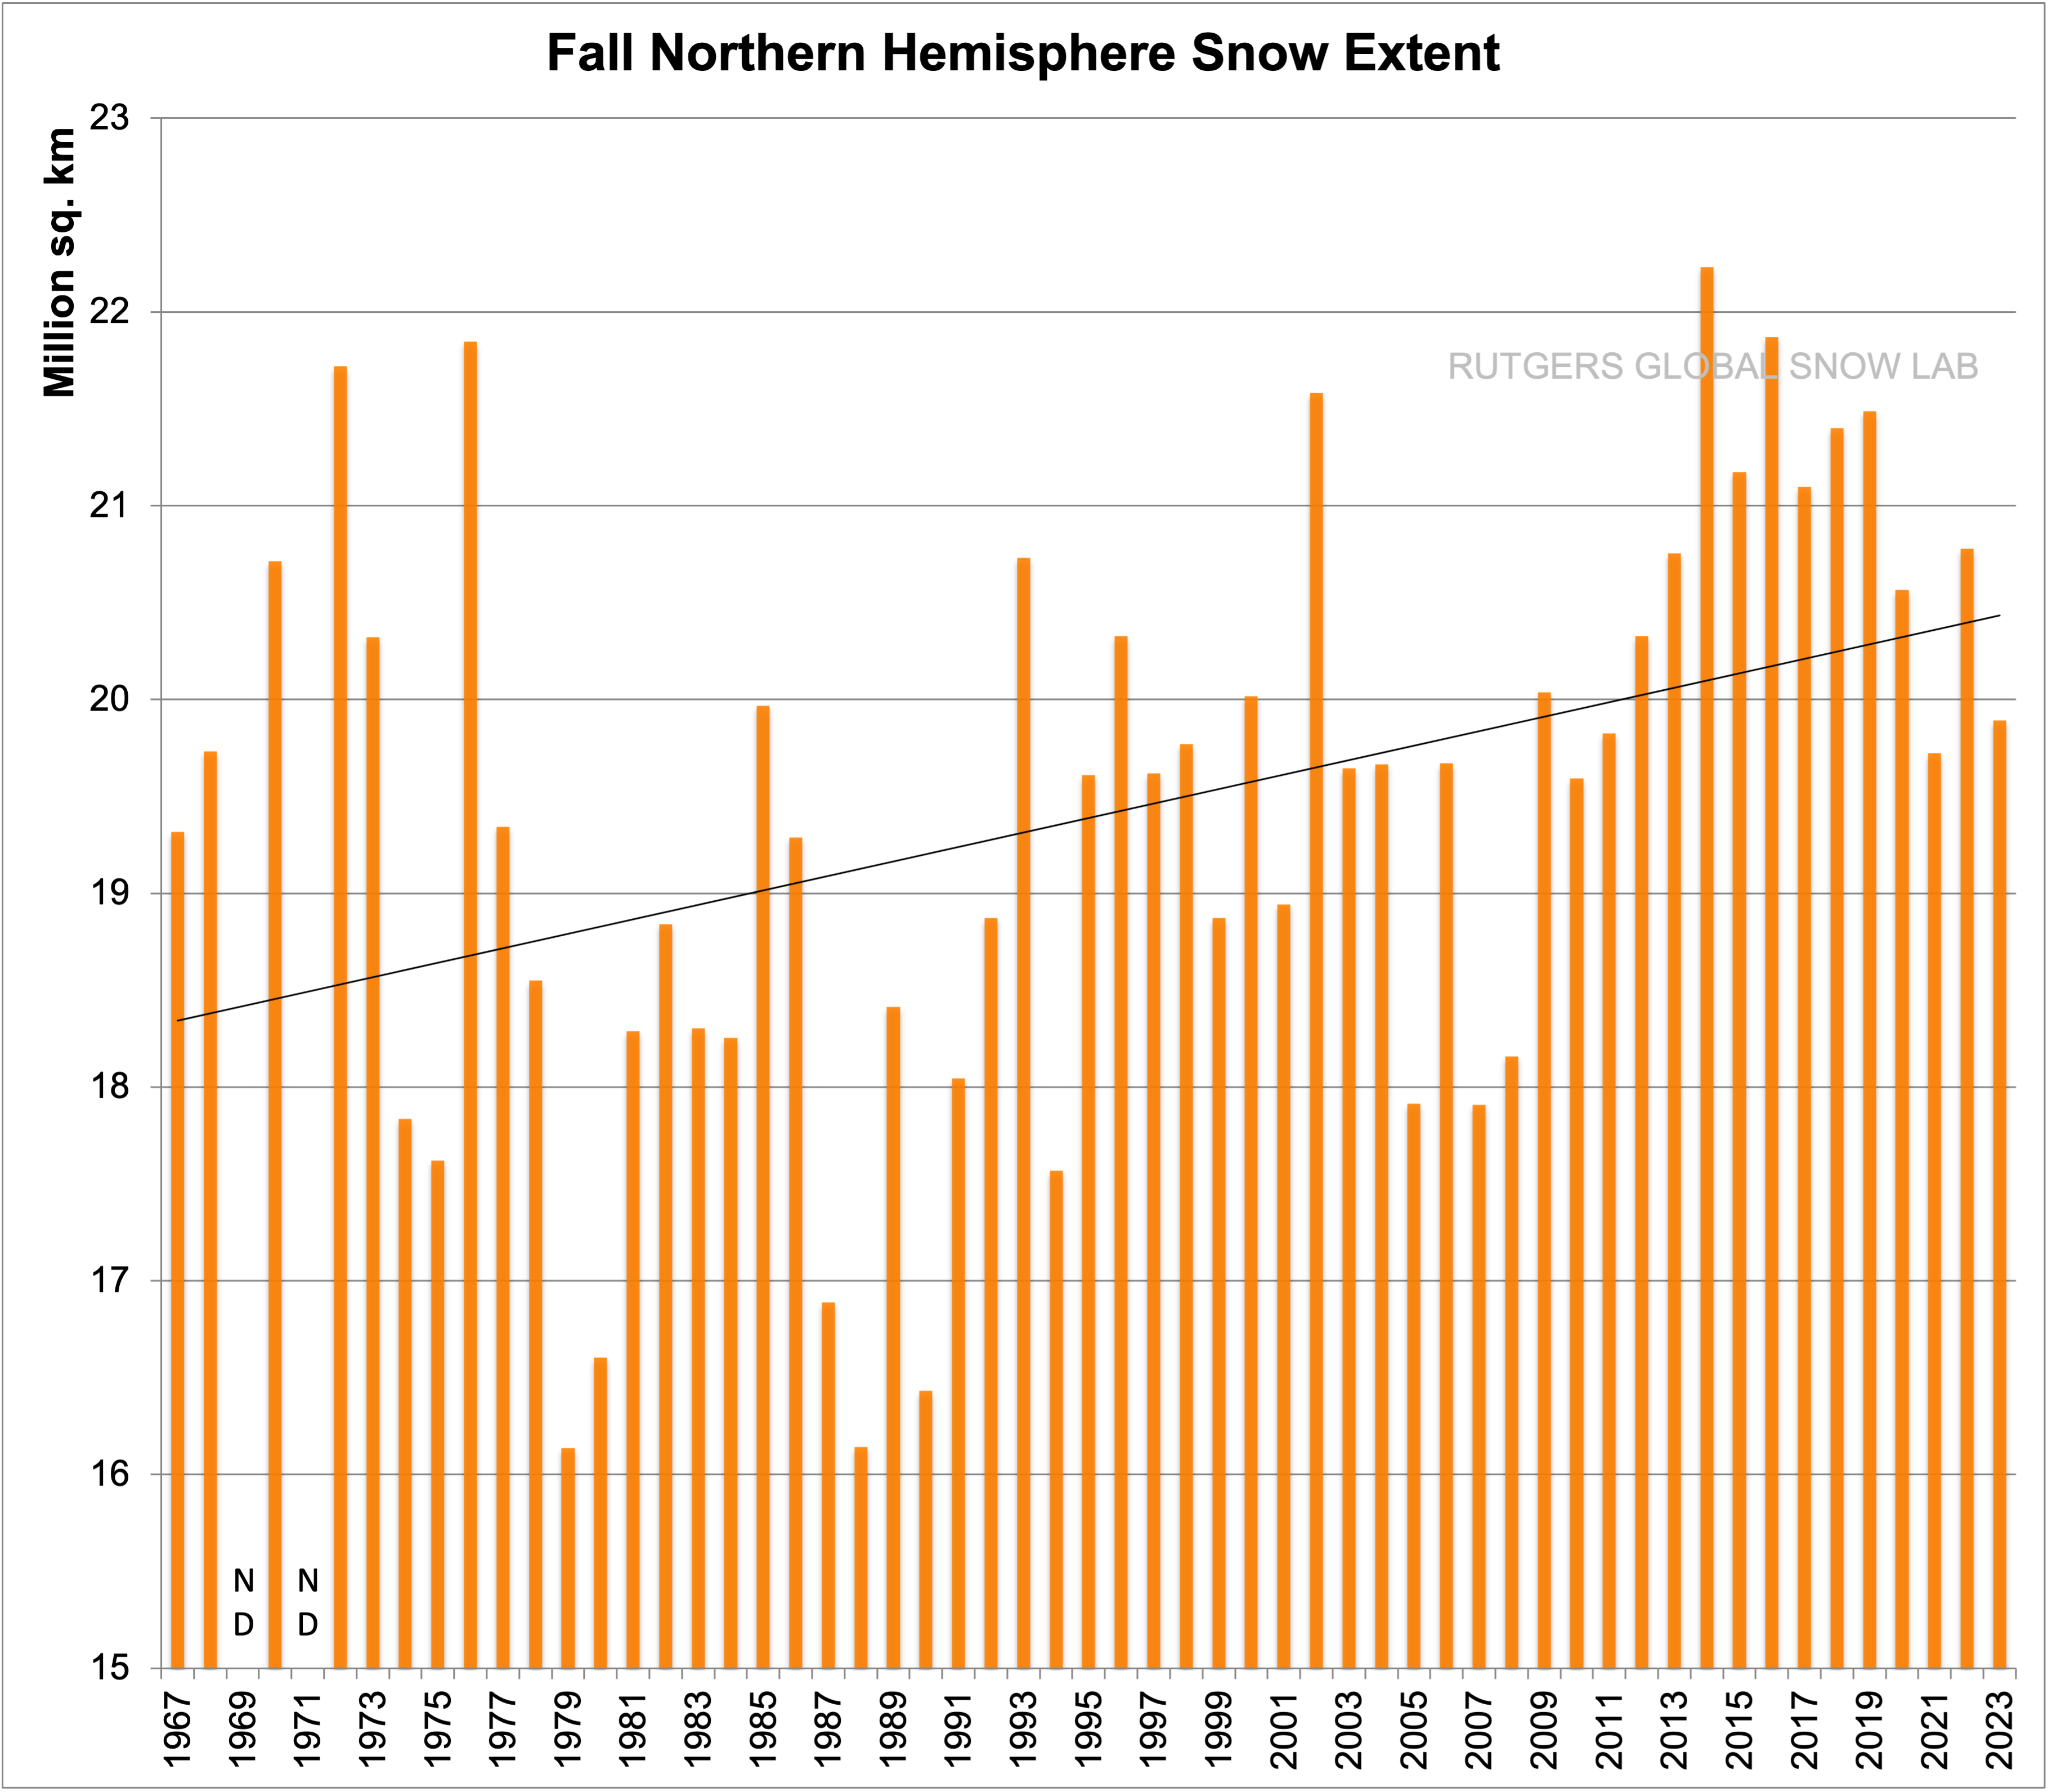
The snow chart is data mined and deceptive
Here is the annual NH chart
Michel Vieillefosse appears to have retired from isae-supaero.fr but he is active on LinkedIn:
https://www.linkedin.com/in/michel-vieillefosse-96ab57234/
I just left replies to his two most recent posts, inviting him to join this conversation.
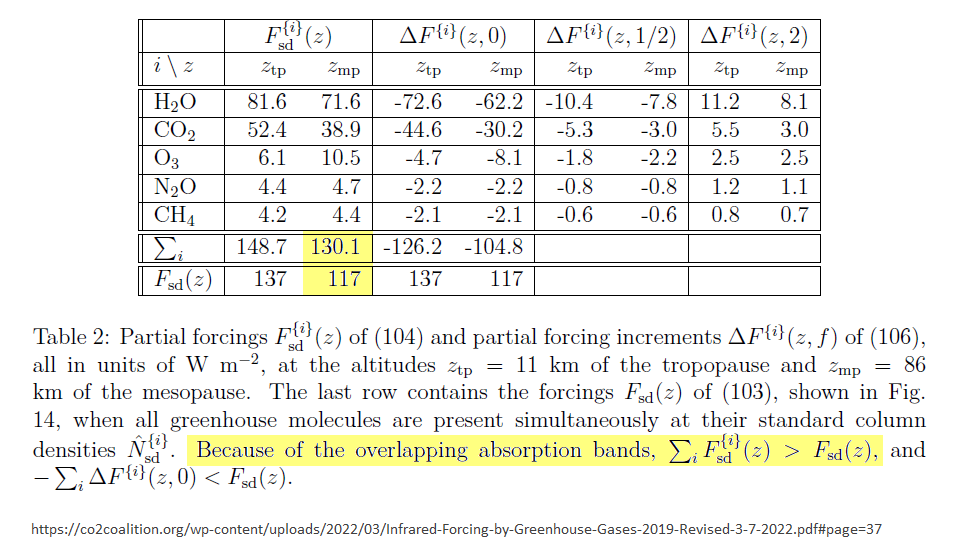
Very good idea. Also, some scientists ought to test, replicate his approach. He says he can measure/calculate directly from data the contribution of each component of climate change (CO2, NH4, O3, sun, etc) to the warming observed since 1960. Someone has to check that out. How come nobody thought of that before ????
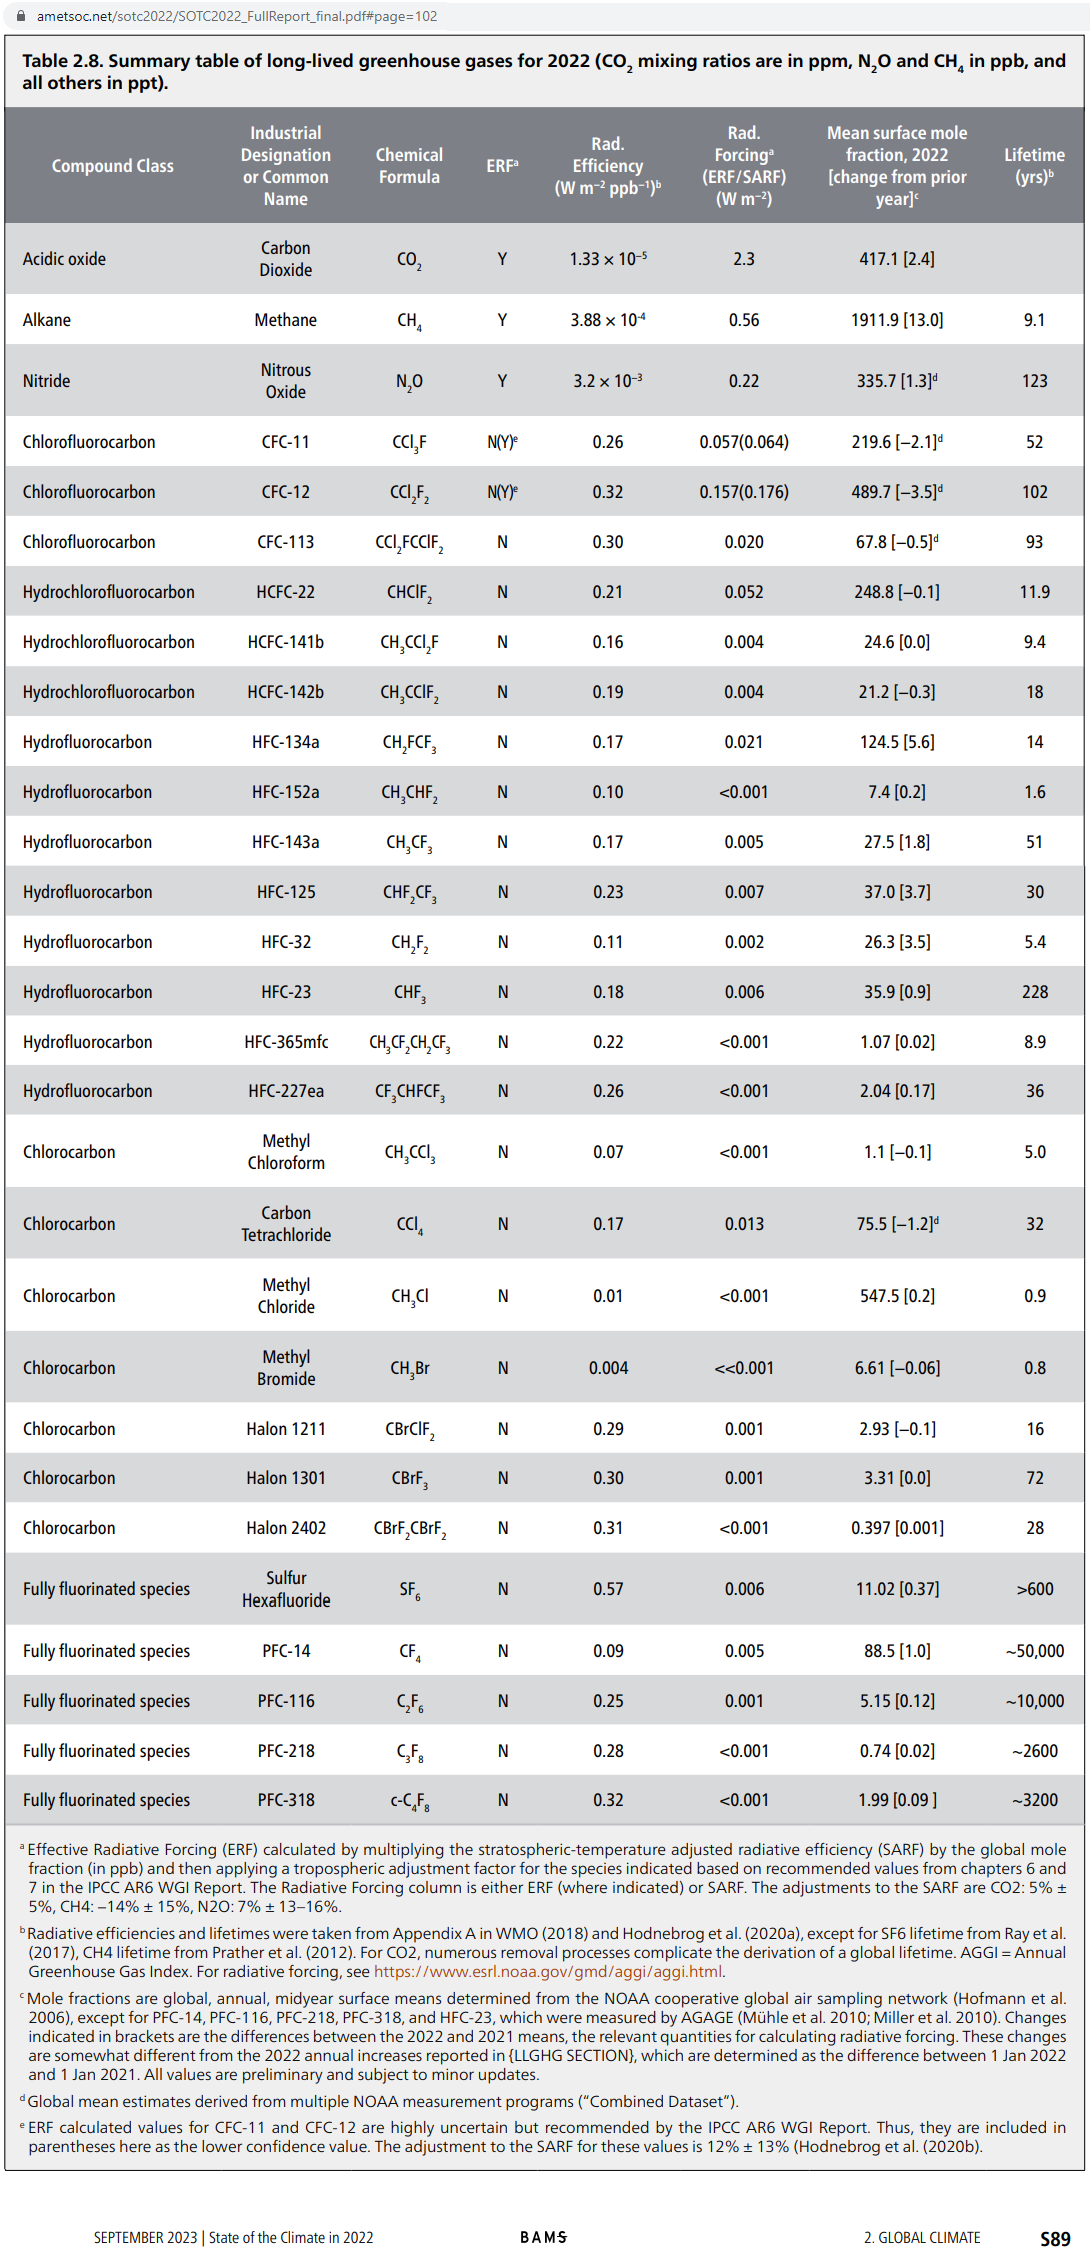
Distinguishing the various effects is tricky, but…
https://sealevel.info/vanWijingaarden_and_Happer_Infrared-Forcing-by-Greenhouse-Gases-2019-Revised-3-7-2022.pdf
and
https://sealevel.info/AMS_list_of_GHGs_State_of_the_Climate_2021.pdf
Just thinking. Could it be that the excess heat is absorbed in the soil, then picked up by rainwater, which then reaches the ocean via the hydrographic system ?
Some of the sunlight that hits a leaf is converted not to heat but to chemical energy in the form of cellulose, lignin, flowers, fruit and all the other compounds plants and trees make. Photosynthesis is a significant converter of sunlight to something besides heat.
You need to determine if it is permanently locked away. Coral is able to permanently lock up energy. Unless trees get buried under ice, they are energy stores for relatively limited time. Fruit either rots on the ground or is converted to growth in kids and maybe fat in adults but the population is not growing that fast so most of the energy will end up as heat when bodies get returned to where they came from.
When you look at energy stores, the big ones on Earth are Antarctica and Greenland. The ice on Antartica has been there for over 2.7Ma. The ice on Greenland around 400ka. These are much longer than the ocean heat with longest ventilation period around 2,000 years.
The current ocean heat retention of around 12ZJ per year would take 185,000 years to replace the ice on Antarctic if it all melted.
The Grand Canyon was probably formed through water flow so a lot of carving rock and moving dirt.
However, compared to the available solar EMR, all the processes that can lock away energy are relatively small. Around 30% of the incoming solar gets rejected. If more was needed to get the tropical oceans to 30C, it would be let in. Tropical oceans control the heat input to Earth not CO2.
Robert,
Interesting that you’ve cited two serious and very skeptical examinations of the basis of the Global Warming theory, and both in French. Thanks, I wouldn’t have seen either without these posts.
My impression is that the climate mania is for the most part confined to the English speaking world and that climate alarmism does not figure much in French political or cultural life in the way that it does in the English language media in Britain, the US, Australia or Canada. There are also some skeptical voices and books in German, and the evident failure of the Energiewende appears to be prompting a rethink there. In Holland we have seen the revolt of the farmers and the election success of Wilders.
It is going to be interesting to observe the pending UK election – probably in October or November of this year. There will be one, and only one, political party, Reform, which will have as part of its platform the complete abandonment of Net Zero and the use of the consequent financial savings for health and welfare.
It will be interesting to see how they do.
Not really, it has more to do with Western civilization (and Christian religion or values) than language. Quebec is probably where the alarmist ideology has the strongest hold; all parties are pro climate; one party Climat Quebec has the most extreme position I have seen; media are totally biased, etc. In the anglophone world, the US is polarized on climate, as well on many other issues. UK is the champion in terms of emission cutting but now we see some common sense on the horizon. Germany has a problem with ideology and the Verts are ruling with no end in sight. I think they are crazy, they shut down 23 perfectly working nuclear plants, built the most renewables, yet their emissions have not gone down since they use more and more lignite.
Michel
I can’t let say that the crap Robert is citing here would be representative of what the majority of French people think.
Of course, as in a any other countries, we have a few climate-deniers (we have also flat-earth believers! ). But probably less than in other countries
France is the country of Descartes and we are quite rational
Most French people consider climate-skeptics as idiots and stupid deniers who do not accept physical realities.
In the social media, climate-deniers are just making fools of themselves.
Thanks for your interest.
I first respond globally to the 130 comments.
1/ This is an excellent summary by Robert Girouard. He tried to stick to the book as much as possible, doing an excellent job. I thank him for that. I was not consulted to reread it. There are some minor differences on some values which do not correspond to the French text that I published. (140 ppm) this does not change the general meaning.
2/ A certain number of comments refer to events prior to 1960.
In the book, I deliberately only spoke about events after 1960, because the data published before this date are tainted by too many uncertainties or by the simple absence of records. Many areas are not covered. For example, CO2 only has readings from this date.
4/ Reducing CO2 emissions to zero. We lack perspective since this has not happened since 1960. We do not know how nature will react. It is sized to absorb half of the surplus whatever this level of surplus. It’s an observation. How will it scale with a constant CO2 rate?
5 / The warming of the Arctic has mainly taken place during the polar night from September to March, since 1990. We do not observe any progression in summer. The Arctic becomes wetter at high altitudes under the influence of southerly winds. The increase in humidity at high altitude reduces infrared emissions.
6/ Heat islands now represent 4% of the country’s surface area in France. If their temperature increases by 5°C, the difference becomes 0.2°C overall. As a reminder, CO2 increased by 0.01% in volume.
7/ Evaporation gives up its energy at the top of the clouds at 5000 m. This energy is transformed into radiation. Water helps extract 53% of the energy from the ground and sends it into space. It serves as an elevator. The destruction of forests blocks the cycle.
8/ Solar fluctuations are 11 years. Compared to 1960, 2021 (book writing) was at a lower level. But 2023 gets stronger.
Bonjour M. Vieillefosse,
J’ai essayé de vous rejoindre via FB mais n’ai pas eu de réponse. SVP accepter ma demande.
For the benefit of all, have your measurements/calculations been checked by a third party ?
The vast majority of the measures highlighted are provided by a third party. (Nasa, NOAA, Giss, Mauna loa, Lasp Boulder, IEA, Japan meteorology…) little contested organizations. I have attached the links allowing you to do so.
Pressures, temperatures as a function of altitude, absolute humidity, relative humidity, infrared emission in space, precipitation, wind, over the entire globe, or over specific areas, and over 60 years are mainly provided by NOAA. Incidentally, I compared these data to those from Météo France.
My role was to take a common zero reference for all the data, January 1, 1960, to convert this data into W/m2 in order to be able to work on it. Make sure to understand the spectral band of the sensors used, their calibration and their connections over time when changing sensors.
There are some data for which I was forced to make approximations or use values from previous years, due to failure to obtain the exact data (surface area of metropolises, industrial zones, fallow land, aerosols, etc.)
More than half of the 98 graphs published are raw data, formatted as a graph, to be readable.
My goal was not to have extremely precise values. But above all to obtain the orders of magnitude of the main phenomena: those which are important and those which are less so. I eliminated all factors that had consequences lower than 10 – 6.
I claim uncertainty about the data on deforestation and urbanization.
I am aware that the verification of the calculations will have to be carried out in a second step, starting with the most significant variables.
To date, no one has proposed a classification of human anthropogenic actions and their comparison with CO2.
The order of arrival seems more important to me than the precision of the measurements at this stage.
For six years at the French space agency I carried out measurements by plane, by satellite, calibrations, and modeling of the atmosphere in the visible and infrared domain, to best define our observation satellites (Meteosat , SPOT…).
M.Viellefosse,
You say “Heat islands now represent 4% of the country’s surface area in France.
If their temperature increases by 5°C, the difference becomes 0.2°C overall.”
I can not believe this how you conclude that uirbainzation effect is 0.21 C° of global warming wordwide ?
If not, how do you achieve this result of 0.21 °C ?
Thanks.
Urbanization values are easily verifiable in the countries concerned using published NOAA data. For example, France has had a temperature anomaly of 1°C, higher than the rest of the planet, for 60 years even though it has one of the lowest CO2 levels of industrialized countries. Meteo France confirms these figures. These are measures. Examples by country are given in the book.
Your gonna be joking.
This is the CO2 concentration which matters, which is the same above all countries (as it mixes very quickly).
This is regardless of how much this country emitted.
France has had the same CO2 above its head as any other countries and is not more urbanized.
So really, this is how you calculated your 0.21 °C ?
This si even worse thaan what I thought.
From a satellite’s point of view
Global urban areas cover only 0.7% of Earth’s surface
Global forest areas as a percentage of Earth’s surface have declined only 0.8% since 1990.
Earth’s total surface area
51 billion hectares
Earth’s forest area
4 billion hectares
Deforestation since 1990
420 million hectares
Deforestation since 1990
(0.8%) of Earth’s total surface area
The claim that Urbanization and Deforestation caused three times more global warming than CO2 is the dumbest claim I can recall in 26 years of climate and energy reading
The first problem is no one knows the exact warming caused by CO2, urbanization and deforestation, in the past 48 years.
Three unknown numbers
Only a fool would claim two unknown numbers combined are three times as large as a third unknown number.
You could eliminate one unknown number by using lab spectroscopy to estimate the effect of CO2. That would leave out any feedbacks. The other two variables would still be unknown and both affect TINY areas of Earth’s surface from a satellite’s point of view
The claim in the title of this article is Total BS and the author is a fool for believing it.